The Economic Value of Biochar in Crop Production and Carbon ...
The Economic Value of Biochar in Crop Production and Carbon ...
The Economic Value of Biochar in Crop Production and Carbon ...

You also want an ePaper? Increase the reach of your titles
YUMPU automatically turns print PDFs into web optimized ePapers that Google loves.
productivity, <strong>and</strong> some exam<strong>in</strong>e biochar’s potential <strong>in</strong> sequester<strong>in</strong>g carbon. However, this is thefirst study to our knowledge that l<strong>in</strong>ks farm pr<strong>of</strong>itability with the economic value <strong>of</strong> biochar as asoil additive <strong>and</strong> as a source <strong>of</strong> carbon <strong>of</strong>fset credits.<strong>The</strong> follow<strong>in</strong>g two sections provide a review <strong>of</strong> exist<strong>in</strong>g studies <strong>of</strong> the impacts <strong>of</strong> biochar soilapplication to crop productivity <strong>and</strong> to carbon (C) sequestration. We rely on the results <strong>of</strong> thesestudies <strong>in</strong> our analysis <strong>of</strong> the economic value <strong>of</strong> biochar as a soil amendment. Section 4describes our methodology, <strong>and</strong> Section 5 presents estimated costs <strong>and</strong> returns <strong>in</strong> crop productionfor the case <strong>of</strong> wheat, with <strong>and</strong> without the application <strong>of</strong> biochar. Section 6 concludes.2. Impacts <strong>of</strong> biochar on crop productivity — related studiesA number <strong>of</strong> studies have <strong>in</strong>vestigated the response <strong>of</strong> crops to biochar application. Table 1presents summaries <strong>of</strong> a limited sample <strong>of</strong> these studies show<strong>in</strong>g the impacts <strong>of</strong> biochar on cropresponse <strong>in</strong> terms <strong>of</strong> yield or plant biomass. Observed impacts vary depend<strong>in</strong>g on <strong>in</strong>teractionsbetween the types <strong>of</strong> biochar used, crop studied, soil type, local conditions, among others. Somestudies have observed <strong>in</strong>creased crop productivity from us<strong>in</strong>g biochar alone (Baum <strong>and</strong> Weitner,2006; Chan et al., 2008). Other studies found a more positive crop response when biochar isapplied together with fertilizers (Ste<strong>in</strong>er et al., 2007). However, some studies have foundnegative crop response to biochar soil amendments. For example, Kishimoto <strong>and</strong> Sugiura (ascited <strong>in</strong> Chan <strong>and</strong> Xu, 2009) reported reductions <strong>in</strong> soybean yields with higher application rates<strong>of</strong> biochar. Coll<strong>in</strong>s (2008) found a decl<strong>in</strong>e <strong>in</strong> the root-shoot ratio <strong>of</strong> wheat <strong>in</strong> Qu<strong>in</strong>cy s<strong>and</strong> soilamended with peanut hull biochar <strong>and</strong> s<strong>of</strong>twood bark biochar compared to unamended soil. 1An<strong>in</strong>crease <strong>in</strong> the root-shoot ratio <strong>of</strong> wheat, however, is found <strong>in</strong> Hale silt loam soil amended with1 <strong>The</strong> root/shoot ratio is the ratio <strong>of</strong> below-ground level biomass <strong>and</strong> above-ground level biomass.3
s<strong>of</strong>twood bark biochar. Coll<strong>in</strong>s (unpublished data) also found a significant <strong>in</strong>crease <strong>in</strong> soil waterhold<strong>in</strong>g capacity on silt loam soils but not on s<strong>and</strong>y soil. This could potentially <strong>in</strong>crease cropyields <strong>in</strong> a dryl<strong>and</strong> production region that is <strong>of</strong>ten water-limited for yield. Lehmann et al. (2006)discussed a greenhouse study <strong>in</strong> Columbia where biochar application led to low N availability tocrops. Legum<strong>in</strong>ous crops were found to compensate for this due to biological N 2 fixation<strong>in</strong>duced by biochar application. On the other h<strong>and</strong>, non-legume crops were found to requireadditional N fertilizers due to low N availability. <strong>The</strong> above studies are controlled, small-scaleexperiments. At this po<strong>in</strong>t, it is not possible to draw conclusions on the effect <strong>of</strong> biochar that canbe broadly applied, especially <strong>in</strong> temperate regions with younger soils (compared to highlyweathered soils <strong>in</strong> more tropical environments). Furthermore, biochar itself will not contributemean<strong>in</strong>gful amounts <strong>of</strong> nutrients given its high stability, so the potential for biochar to reducechemical fertilizer requirements rema<strong>in</strong>s unclear. 2Nonetheless, the evidence from availablestudies does show that soil application <strong>of</strong> biochar <strong>of</strong>ten affects crop productivity <strong>and</strong> can bebeneficial <strong>in</strong> some situations.One consistent effect <strong>of</strong> biochar amendment has been change <strong>in</strong> soil pH (most frequentlyrais<strong>in</strong>g it), which implies a lim<strong>in</strong>g value <strong>of</strong> biochar. Coll<strong>in</strong>s (2008) found nearly a unit <strong>in</strong>crease<strong>in</strong> soil pH with biochar derived from herbaceous feedstocks (switchgrass, digested fiber) <strong>and</strong> 0.5to 1 unit <strong>in</strong>crease <strong>in</strong> the soil pH with biochar derived from woody sources (s<strong>of</strong>twood bark, woodpellets) (Table 2). Van Zwieten et al. (2007) also reported an <strong>in</strong>crease <strong>in</strong> the soil pH <strong>and</strong> 30 to 40percent <strong>in</strong>crease <strong>in</strong> the height <strong>of</strong> wheat when biochar was applied to an acidic soil. Rondon et al.(2007) credited the improvement <strong>of</strong> bean productivity due to the elevation <strong>of</strong> soil pH <strong>and</strong> other2 In Coll<strong>in</strong>s (2008), total nitrogen <strong>in</strong> the soil is found to <strong>in</strong>crease (although at small amounts) after addition <strong>of</strong>biochar. This does not, however, imply that a lesser amount <strong>of</strong> N fertilizer may be needed when biochar is added tothe soil. N <strong>in</strong> biochar is not available to plants. It is fused <strong>in</strong> the C matrix (H. Coll<strong>in</strong>s, personal communication,2009).4
soil nutrients as a consequence <strong>of</strong> biochar use. <strong>Biochar</strong> may be considered a potential substitutefor agricultural lime, especially <strong>in</strong> agricultural regions that have acidic soils. However, a unitchange <strong>in</strong> the soil pH would require 0.54 metric ton (MT) to 3.91 metric tons per acre <strong>of</strong>agricultural lime, depend<strong>in</strong>g on the soil type (CPHA, 2002). For example, a s<strong>and</strong> soil typerequires 0.54 MT/acre <strong>of</strong> lime to <strong>in</strong>crease the soil pH by a unit as compared to about 17 MT/acrebiochar 3 needed to achieve the same desired change <strong>in</strong> soil pH (Coll<strong>in</strong>s, 2008). Thus, it may notbe economically feasible for farmers to use biochar <strong>in</strong> crop production solely for pH adjustments<strong>in</strong>ce it would entail a relatively higher cost compared to agricultural lime. On the other h<strong>and</strong>,other potential benefits from add<strong>in</strong>g biochar to the soil such as avoided emissions <strong>of</strong> lime <strong>and</strong> thecapacity <strong>of</strong> biochar to sequester carbon (to be discussed <strong>in</strong> the next section) should beconsidered. It is possible that the economic returns from us<strong>in</strong>g biochar may be higher than fromus<strong>in</strong>g lime after account<strong>in</strong>g for any other non-pH related plant growth benefits or carbon <strong>of</strong>fsetcredits, were they to be available to farmers.3. <strong>Biochar</strong> carbon sequestration — related studies, policy <strong>and</strong> program<strong>Biochar</strong> is produced through the process <strong>of</strong> pyrolysis. <strong>The</strong> three ma<strong>in</strong> products <strong>of</strong> pyrolysis:liquid (bio-oil), biochar, <strong>and</strong> gas, can <strong>in</strong>fluence the global carbon (C) cycle <strong>in</strong> two ways. First,all three pyrolysis products may be used as an energy source that can displace fossil energy use.Second, if the carbon-rich <strong>and</strong> stable biochar is produced from a biomass feedstock that removescarbon dioxide (CO 2 ) from the air via photosynthesis, which would otherwise have decomposed,3 This refers to Qu<strong>in</strong>cy s<strong>and</strong> soil type. <strong>The</strong> biochar requirement to raise the pH by a unit depends on the type<strong>of</strong> char used, e.g., switchgrass, digested fiber, bark, etc. Assum<strong>in</strong>g an average pH <strong>in</strong>crease across the chars <strong>of</strong> 0.058pH unit/ton <strong>of</strong> biochar, it would require about ~17.24 tons <strong>of</strong> biochar to <strong>in</strong>crease the soil pH by 1 unit.5
then char-amended l<strong>and</strong> becomes a carbon s<strong>in</strong>k for more <strong>in</strong>tensive <strong>and</strong> long-last<strong>in</strong>g carbonstorage.Lehmann et al. (2006) estimated an annual sequestration <strong>of</strong> 0.2 Pg C (200 million metrictons) through slash-<strong>and</strong>-char (<strong>in</strong>stead <strong>of</strong> slash-<strong>and</strong> burn) <strong>and</strong> biochar application to the soil.Furthermore, the study reported that low-temperature pyrolysis <strong>of</strong> biomass comb<strong>in</strong>ed with thecapture <strong>of</strong> gas <strong>and</strong> liquid products for bioenergy production <strong>and</strong> soil application <strong>of</strong> biochar, couldsequester the equivalent <strong>of</strong> about 10% <strong>of</strong> the annual US fossil-fuel emissions.Laird (2008) proposed a national system <strong>of</strong> distributed fast pyrolyzers for convert<strong>in</strong>g biomass<strong>in</strong>to bio-oil, gas <strong>and</strong> char. Similar to Lehmann et al. (2006), he assumed that bio-oil <strong>and</strong> gas areused as energy sources that can displace fossil fuel use, while char was applied to agriculturalsoils. Assum<strong>in</strong>g the United States can produce 1.1 billion metric tons <strong>of</strong> biomass per year fromharvestable forest <strong>and</strong> crop l<strong>and</strong>s, the implementation <strong>of</strong> Laird’s proposal could displace 25% <strong>of</strong>the nation’s fossil fuel oil consumption per year. <strong>The</strong> study also estimated the aggregate carboncredit for fossil fuel displacement <strong>and</strong> biochar C sequestration to be 10% <strong>of</strong> the average annualUS CO 2 -C emissions.<strong>The</strong> carbon content <strong>of</strong> biochar varies depend<strong>in</strong>g on the feedstock. Coll<strong>in</strong>s (2008) showedbiochar carbon content (from slow pyrolysis) rang<strong>in</strong>g from 61% to 80%, the highest be<strong>in</strong>g fromwood pellets (Table 2). Woody feedstocks (bark, wood pellets) tended to have a higher carboncontent compared to herbaceous feedstocks (switchgrass, digested fiber). Based on these figures,approximately 0.61 to 0.80 MT <strong>of</strong> carbon (or 2.2 to 2.93 MT <strong>of</strong> CO 2 ) 4 is sequestered for everyton <strong>of</strong> biochar applied to the soil.4 To convert from carbon to carbon dioxide, multiply by 44/12 (~3.67) (Blas<strong>in</strong>g et al., 2004).6
Incentives for greenhouse gas mitigation such as carbon market <strong>of</strong>fset credits may tip thescale <strong>in</strong> favor <strong>of</strong> biochar as a soil amendment rather than as a renewable energy source. At the<strong>in</strong>ternational level, the Kyoto Protocol under the United Nations Framework on Climate Change(UNFCCC) only allows C sequestration from afforestation <strong>and</strong> reforestation <strong>in</strong> the trad<strong>in</strong>gprogram established under the Clean Development Mechanism (CDM) (UNFCCC-CDM, 2009).<strong>Carbon</strong> sequestration <strong>in</strong> agricultural crops <strong>and</strong> soils is not currently eligible under CDM(Lehmann et al., 2006; FAO, 2009). In the United States, the Chicago Climate Exchange (CCX)has developed st<strong>and</strong>ardized rules for soil carbon management <strong>of</strong>fsets <strong>in</strong> the agricultural sector.Eligible projects are conservation tillage <strong>and</strong> grass plant<strong>in</strong>g, which have to be enrolled with aCCX-registered Offset Aggregator.In 2008, prices <strong>of</strong> traded CO 2 <strong>of</strong>fsets on the Chicago Climate Exchange were volatile,rang<strong>in</strong>g from $1 to $7.40 per metric ton <strong>of</strong> CO 2 (CCX, 2008). Dur<strong>in</strong>g the same year, the marketprices <strong>of</strong> CO 2 <strong>of</strong>fsets <strong>in</strong> the European Climate Exchange varied between $17 <strong>and</strong> $31 per metricton <strong>of</strong> CO 2 (ECX, 2008). <strong>The</strong> differences <strong>in</strong> price across markets are <strong>in</strong> part due to the fact thatparticipation <strong>in</strong> the CCX is currently optional; no entity is legally required to participate <strong>in</strong> thisexchange. However, recent policy discussions at the national level suggest <strong>in</strong>creased momentumtoward a b<strong>in</strong>d<strong>in</strong>g national carbon market. In the follow<strong>in</strong>g section, we estimate the value <strong>of</strong>biochar as an <strong>in</strong>put <strong>in</strong> crop production <strong>and</strong> as an <strong>in</strong>strument <strong>in</strong> C sequestration. We assume that acarbon market exists for avoided emissions <strong>and</strong> C sequestration due to use <strong>of</strong> biochar as soilamendment. Also, for the value <strong>of</strong> potential CO 2 <strong>of</strong>fset, we use a low <strong>and</strong> high value <strong>of</strong> $1/MTCO 2 <strong>and</strong> $31/MT CO 2 .4. Estimated costs <strong>and</strong> returns for us<strong>in</strong>g biochar as soil amendment7
In this section, we estimate the value <strong>of</strong> biochar as a soil amendment <strong>and</strong> the economicreturns to farmers under a set <strong>of</strong> assumed conditions. <strong>The</strong> calculation is done <strong>in</strong> two stages.First, we assess: (a) the avoided emissions from the soil application <strong>of</strong> biochar <strong>in</strong>stead <strong>of</strong>agricultural lime, exclud<strong>in</strong>g the energy <strong>and</strong> emissions from transport<strong>in</strong>g <strong>and</strong> spread<strong>in</strong>g thematerial; <strong>and</strong> (b) the amount <strong>of</strong> carbon sequestered from biochar application. Comb<strong>in</strong>ed, theemissions avoidance <strong>and</strong> sequestration effects are counted as CO 2 <strong>of</strong>fsets that can be sold underan assumed set <strong>of</strong> carbon <strong>of</strong>fset prices. Second, we calculate the pr<strong>of</strong>it <strong>of</strong> crop production giventwo scenarios —without biochar but with lime application to the soil, <strong>and</strong> with biocharapplication as a substitute for lime. We focus on dryl<strong>and</strong> wheat production <strong>in</strong> the state <strong>of</strong>Wash<strong>in</strong>gton as a case study.4.1. Estimates <strong>of</strong> avoided emissionsGaunt <strong>and</strong> Lehmann (2008) <strong>and</strong> McCarl et al. (2009) estimated the avoided greenhouse gasemissions <strong>of</strong> apply<strong>in</strong>g biochar to agricultural l<strong>and</strong> <strong>in</strong> terms <strong>of</strong> reduced agricultural <strong>in</strong>putrequirements due to a crop’s improved use <strong>of</strong> nutrients. This translates to reductions <strong>in</strong> bothfertilizer use <strong>and</strong> nitrous oxide emissions <strong>in</strong> fertilized fields. However, the dynamics <strong>of</strong> therelationship between fertilizers <strong>and</strong> biochar are not <strong>in</strong>cluded <strong>in</strong> our analysis s<strong>in</strong>ce the effects <strong>of</strong>biochar on the utilization <strong>in</strong>tensity <strong>of</strong> fertilizers depend on various factors like the type <strong>of</strong> cropstudied, soil type, soil quality <strong>and</strong> biochar type. On the other h<strong>and</strong>, there is strong consensusabout biochar’s positive effects on soil pH that is similar to lim<strong>in</strong>g effects, as exemplified bystudies discussed <strong>in</strong> section 2.Agricultural lime is commonly applied to soils to ameliorate the soil pH. <strong>The</strong> recommendedrates <strong>of</strong> lime application <strong>in</strong> western Wash<strong>in</strong>gton range from 0.91 metric ton to 4.54 metric tonsper acre every 3 to 5 years, roughly (C. Cogger, personal communication, 2009). Less or no lime8
is needed <strong>in</strong> Wash<strong>in</strong>gton east <strong>of</strong> the Cascades because the native soil pH is high (R. Koenig, C.Kogger <strong>and</strong> J. Davenport, personal communications, 2009). However, some soils <strong>in</strong> easternWash<strong>in</strong>gton with a long history <strong>of</strong> urea or ammonium-based nitrogen fertilizers haveexperienced a reduction <strong>in</strong> pH to a low enough level to justify the need for lime. When there is asoil acidity problem, lime applications range from 0.91 metric ton to 2.72 metric tons per acre (J.Davenport, personal communication, 2009).West <strong>and</strong> McBride (2005) estimated the net CO 2 emission from application <strong>of</strong> agriculturallime at about 0.059 metric ton C (or 0.22 metric ton CO 2 ) per ton <strong>of</strong> limestone, based on thechemical reaction <strong>of</strong> lime <strong>in</strong> the soil <strong>and</strong> transportation <strong>of</strong> lime-derived bicarbonates to the ocean(via leach<strong>in</strong>g <strong>and</strong> precipitation). This is the amount <strong>of</strong> emissions that can potentially be avoidedby replac<strong>in</strong>g lime with biochar. Us<strong>in</strong>g the CO 2 <strong>of</strong>fset price range <strong>of</strong> $1 to $31/MT CO 2 , thevalue <strong>of</strong> avoided emissions amounts to $0.22-$6.82 per metric ton <strong>of</strong> lime.4.2 Estimates <strong>of</strong> biochar carbon sequestration<strong>Biochar</strong> from herbaceous <strong>and</strong> woody feedstock sources are found to have a carbon content <strong>of</strong>60.5%-66.7% <strong>and</strong> 74.5%-80%, respectively. We can assume from these figures that for everyton <strong>of</strong> biochar applied to the soil, 0.61 to 0.80 ton <strong>of</strong> carbon (equivalent to 2.2-2.93 tons <strong>of</strong> CO 2 )can be sequestered (Coll<strong>in</strong>s, 2008). Us<strong>in</strong>g the highest carbon content <strong>of</strong> the wood-based biochar(i.e., 80%) <strong>and</strong> the CO 2 <strong>of</strong>fset price range, the approximate value <strong>of</strong> biochar C sequestration is$2.93-$90.83 per metric ton <strong>of</strong> biochar.4.4 Costs <strong>and</strong> returns <strong>of</strong> crop productionWe exam<strong>in</strong>e the potential economic returns to farmers if they utilize biochar as a substitutefor agricultural lime under three price scenarios: (a) $114.05 per metric ton based on the energycontent <strong>of</strong> a wood-based biochar; (b) $87 per metric ton; <strong>and</strong> (c) $350.74 per metric ton. <strong>The</strong> first9
value represents the opportunity cost <strong>of</strong> the foregone use <strong>of</strong> biochar as energy source. A woodbasedbiochar has an average energy content <strong>of</strong> 12,500-12,500 BTU/lb (Dynamotive EnergySystems, 2007). <strong>The</strong> energy content <strong>of</strong> the Central Appalachian coal is 12,500 BTU/lb <strong>and</strong> itsprice is $116.38 per metric ton as <strong>of</strong> 2008 (EIA, 2009). Us<strong>in</strong>g the energy content as basis, thecombustion value <strong>of</strong> biochar is 98% that <strong>of</strong> Central Appalachian coal, or $114.05/metric ton. <strong>The</strong>latter two prices are adopted from the estimated break-even prices <strong>of</strong> biochar <strong>in</strong> Granatste<strong>in</strong> et al.(2009).Wheat, a key economic crop <strong>in</strong> Wash<strong>in</strong>gton, belongs to a group <strong>of</strong> crops that can tolerateslightly acidic (i.e., 6.0-6.5) soil pH (CPHA, 2002). In general, wheat tends to favor soil pHbetween 6 <strong>and</strong> 7 (Beegle <strong>and</strong> L<strong>in</strong>genfelter, 2005). We focus on changes <strong>in</strong> w<strong>in</strong>ter wheat yieldgiven changes <strong>in</strong> the soil pH as a case study. <strong>The</strong> crop yield is estimated through the follow<strong>in</strong>gequation adopted from Mahler (1986):W<strong>in</strong>ter Wheat Yield = −2,960.56 + 1,530 SOILPH (1)where w<strong>in</strong>ter wheat yield is <strong>in</strong> kilograms per hectare, <strong>and</strong> SOILPH refers to the value <strong>of</strong> the soilpH <strong>of</strong> Palouse silt loam. Assum<strong>in</strong>g the base soil pH <strong>of</strong> 4.5 for this soil type from Coll<strong>in</strong>s (2008),<strong>in</strong>creas<strong>in</strong>g the soil pH to 6 would require 2.59 metric tons <strong>of</strong> limestone per acre (CPHA, 2002) or30.62 metric tons <strong>of</strong> biochar per acre (H. Coll<strong>in</strong>s, unpublished data). 5Us<strong>in</strong>g equation (1) with soil pH <strong>of</strong> 4.5, wheat yield is estimated at about 3,924.44 kg perhectare or 58.36 bushels per acre. 6On the other h<strong>and</strong>, with a soil pH <strong>of</strong> 6, the estimated wheat5 Note that the impact <strong>of</strong> char on soil pH depends on the soil type <strong>and</strong> the type <strong>of</strong> char. For the Palouse silt loamsoil type, an average pH <strong>in</strong>crease across the chars is ~0.049 pH unit/ ton <strong>of</strong> biochar per acre. Based on this, it wouldrequire about 30.62 tons/acre to <strong>in</strong>crease the soil pH from 4.5 to 6 (i.e., <strong>in</strong>crease by 1.5 units).6 Conversion: 1 bushel per acre x 0.06725 = 1 metric ton (or 1,000 kg) per hectare (Prairie Gra<strong>in</strong>s Magaz<strong>in</strong>e,2003).10
yield is about 6,219.44 kg per hectare or 92.5 bushels per acre. Pr<strong>of</strong>its from w<strong>in</strong>ter wheatproduction, with <strong>and</strong> without the application <strong>of</strong> biochar, are calculated as follows:Without biochar or agricultural lime:Pr<strong>of</strong>it 1 = P W *Q 1 – Total Cost; (2)Without biochar, with agricultural lime:Pr<strong>of</strong>it 2 = P W *Q 2 – Total Cost – P L *AGLIME; (3)With biochar, without agricultural lime:Pr<strong>of</strong>it 3 = P W *Q 2 + COFFSET – Total Cost – P Bi *BCHAR, (4)where P W refers to the Fall 2008 contract price <strong>of</strong> w<strong>in</strong>ter wheat, which is $7.50 per bushel(Union Elevator, 2008). Q 1 is the estimated yield <strong>of</strong> w<strong>in</strong>ter wheat given a soil pH <strong>of</strong> 4.5 <strong>in</strong>equation (2) <strong>and</strong> Q 2 <strong>in</strong> equations (3) <strong>and</strong> (4) is the estimated wheat yield given a soil pH <strong>of</strong> 6. <strong>The</strong>product <strong>of</strong> P W <strong>and</strong> Q gives the revenue <strong>in</strong> Table 3 below. P L is the price <strong>of</strong> lime at $51.53 permetric ton for a 100-lb bag <strong>in</strong> 2008 (Steve Eckhart, J.A. Jack <strong>and</strong> Sons, personal communication,2009). AGLIME refers to the application rate <strong>of</strong> agricultural lime (2.59 metric tons per acre); P Bmeans the biochar price; BCHAR represents the application rate <strong>of</strong> biochar (30.62 metric tons peracre); <strong>and</strong> COFFSET is the value <strong>of</strong> carbon <strong>of</strong>fset from avoided emissions <strong>and</strong> biochar Csequestration by replac<strong>in</strong>g lime with biochar. Total Cost denotes the sum <strong>of</strong> fixed cost <strong>and</strong>variable cost <strong>of</strong> w<strong>in</strong>ter wheat crop production based on the Eastern Whitman County 2008Enterprise Budget (Pa<strong>in</strong>ter, unpublished), exclusive <strong>of</strong> lime or biochar cost.Table 3 shows the estimated pr<strong>of</strong>its given the addition <strong>of</strong> agricultural lime or biochar to thesoil <strong>and</strong> different price scenarios. As discussed above, the yield <strong>of</strong> wheat is higher when the soilpH improves; hence, the revenue is higher with the application <strong>of</strong> lime or biochar than without.11
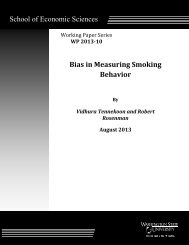
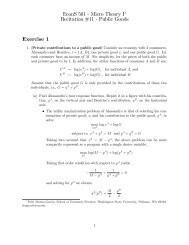
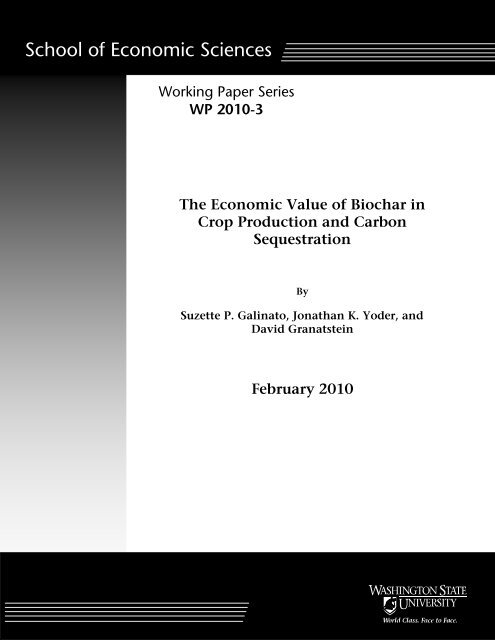
A farmer will ga<strong>in</strong> a pr<strong>of</strong>it even when there is an additional cost <strong>of</strong> agricultural lime. Whenbiochar replaces agricultural lime, on the other h<strong>and</strong>, gett<strong>in</strong>g a pr<strong>of</strong>it or a loss will depend on theprice <strong>of</strong> biochar <strong>and</strong> value <strong>of</strong> sequestered carbon. Without a carbon <strong>of</strong>fset market (COFFSET iszero <strong>in</strong> equation 4), the price <strong>of</strong> biochar has to be about $9.10/MT <strong>in</strong> order for a farmer to breakeven (pr<strong>of</strong>it = 0) 7 <strong>and</strong> about $4.34/MT for pr<strong>of</strong>it to be equal to that <strong>of</strong> agricultural lime scenario,exclud<strong>in</strong>g the transportation <strong>and</strong> application costs <strong>of</strong> biochar.Suppose now that a carbon <strong>of</strong>fset market exists. At $1/MT CO 2 , the farmer loses <strong>in</strong>comegiven any <strong>of</strong> the biochar price scenarios; <strong>and</strong> at $31/MT CO 2 , losses are also <strong>in</strong>curred if the price<strong>of</strong> biochar is high, i.e., at $351/MT or $114/MT. This means that the <strong>in</strong>come from <strong>of</strong>fsets is notenough to support the adoption <strong>of</strong> biochar <strong>in</strong> agricultural production. If, however, the price <strong>of</strong>biochar goes down to $87/MT <strong>and</strong> the carbon <strong>of</strong>fset is priced at $31/MT CO 2 , a pr<strong>of</strong>it is ga<strong>in</strong>ed<strong>and</strong> it is higher than the case where agricultural lime is used <strong>in</strong>stead. This implies that when theprice <strong>of</strong> biochar is low enough, the <strong>in</strong>come derived from carbon <strong>of</strong>fsets can outweigh the cost <strong>of</strong>biochar. It should be noted that the production cost does not <strong>in</strong>clude the cost <strong>of</strong> transport<strong>in</strong>g <strong>and</strong>apply<strong>in</strong>g lime or biochar to agricultural l<strong>and</strong> (mach<strong>in</strong>ery <strong>and</strong> labor cost). Includ<strong>in</strong>g these wouldlikely further drive up the estimated losses or decrease any pr<strong>of</strong>it earned.<strong>The</strong> differences <strong>in</strong> potential pr<strong>of</strong>it given vary<strong>in</strong>g prices <strong>of</strong> biochar <strong>and</strong> carbon <strong>of</strong>fset arefurther illustrated <strong>in</strong> Figure 1. Pr<strong>of</strong>it decl<strong>in</strong>es as the price <strong>of</strong> biochar <strong>in</strong>creases, hold<strong>in</strong>g otherth<strong>in</strong>gs constant. When the carbon <strong>of</strong>fset price is $31/MT CO 2 , the farmer will break even if theprice <strong>of</strong> biochar is approximately $100.52/MT. <strong>The</strong> farmer’s estimated pr<strong>of</strong>it with biocharapplication will be equal to the pr<strong>of</strong>it with agricultural lime application ($146/acre) if the price <strong>of</strong>7 From equation (4), the price <strong>of</strong> biochar (P B * ) at which pr<strong>of</strong>it is zero is derived by calculat<strong>in</strong>g:P B * = (P W *Q + COFFSET – Total Cost)/BCHAR.12
iochar is about $95.75/MT. On the other h<strong>and</strong>, at a carbon <strong>of</strong>fset price <strong>of</strong> $1/MT CO 2 , a pr<strong>of</strong>it<strong>of</strong> about $62.84 per acre is ga<strong>in</strong>ed when the price <strong>of</strong> biochar is $10/MT. At this lower <strong>of</strong>fsetprice, the farmer will break even if the price <strong>of</strong> biochar is approximately $12.05/MT.5. ConclusionsOur quantitative analyses focus on us<strong>in</strong>g biochar as a soil additive <strong>and</strong> its potential carbonsequestration benefits for agricultural uses. We f<strong>in</strong>d that biochar soil application can beeconomically feasible given the follow<strong>in</strong>g scenarios:• If there exists a carbon market that recognizes the avoided emissions <strong>and</strong> carbonsequestration due to the application <strong>of</strong> biochar to agricultural soils. This is a necessarycondition if biochar will be promoted as a technology for carbon sequestration; <strong>and</strong>• If the market price <strong>of</strong> biochar is low enough so that a farmer will earn a pr<strong>of</strong>it after apply<strong>in</strong>gbiochar to the crop field (i.e., <strong>in</strong> our case study, lower than $12.05/MT <strong>and</strong> $100.52/MTwhen the price <strong>of</strong> carbon <strong>of</strong>fset if $1/MT CO 2 <strong>and</strong> $31/MT CO 2 , respectively).It is clear that biochar has potential as a soil amendment <strong>and</strong> its value as such would likely<strong>in</strong>crease as social <strong>and</strong> regulatory <strong>in</strong>terest <strong>in</strong> carbon sequestration <strong>in</strong>creases because <strong>of</strong> thelongevity <strong>of</strong> carbon <strong>in</strong> the soil. However, more substantial <strong>in</strong>creases <strong>in</strong> crop production need tobe documented across a range <strong>of</strong> crops <strong>and</strong> soils that can add value to the farm at a level beyondthe estimated value <strong>of</strong> biochar for carbon sequestration. Under the current economic situation,growers are unlikely to adopt biochar use without greater payback. Also at this time, even ifgrowers found biochar beneficial, they could face difficulty <strong>in</strong> sourc<strong>in</strong>g quantities large enoughfor farm application.13
Many niche opportunities for biochar use are also possible, <strong>in</strong>clud<strong>in</strong>g soil amendment <strong>and</strong>compost use outside <strong>of</strong> agriculture such as urban gardens, lawns, parks, <strong>and</strong> ball fields. <strong>Biochar</strong>can be suitable as a precursor to activated carbon commonly utilized <strong>in</strong> <strong>in</strong>dustrial filtrationprocess (Azargohar <strong>and</strong> Dalai, 2006) like municipal wastewater treatment (e.g. Bansode et al.,2003, Ng et al., 2003) <strong>and</strong> other water <strong>and</strong> air filter<strong>in</strong>g systems (Kearns, 2008; Lima et al.,2008). <strong>Biochar</strong> can also be used as an energy source; as combustion fuel to power the pyrolysisprocess; as a gasifier feedstock (Boateng, 2007; Polagye et al., 2007); or for water heat<strong>in</strong>g <strong>and</strong>cook<strong>in</strong>g (IBI, 2009; Johannes, 2008).<strong>The</strong> extent <strong>of</strong> develop<strong>in</strong>g these markets, <strong>of</strong> course, dependson many factors associated with the cost <strong>of</strong> biochar production relative to exist<strong>in</strong>g alternatives, aswell as the relative effectiveness <strong>of</strong> biochar from pyrolysis for <strong>in</strong>tended uses. <strong>The</strong> question iswhether or not it would be more economically valuable to use biochar as a soil amendment ratherthan for energy production or other alternative uses. For <strong>in</strong>stance, it may be more economicallyattractive to burn it to generate energy (i.e., as a substitute for coal) if the energy content <strong>of</strong>biochar is high. However, the process loses the added benefits <strong>of</strong> apply<strong>in</strong>g biochar to soils, suchas ga<strong>in</strong>s <strong>in</strong> agricultural productivity due to soil quality improvement <strong>and</strong> payments for carbonsequestration.AcknowledgmentsWe thank the Wash<strong>in</strong>gton State Department <strong>of</strong> Ecology for fund<strong>in</strong>g the project, “Use <strong>of</strong> <strong>Biochar</strong>from the Pyrolysis <strong>of</strong> Waste Organic Material as a Soil Amendment”. We also thank Dr. HalColl<strong>in</strong>s for provid<strong>in</strong>g us the data on the carbon content <strong>of</strong> biochar, the soil scientists atWash<strong>in</strong>gton State University for additional references about soil fertility <strong>in</strong> eastern Wash<strong>in</strong>gton<strong>and</strong> Mark Fuchs for his valuable comments <strong>and</strong> suggestions.14
ReferencesAzargohar, R., Dalai, A. K., 2006. <strong>Biochar</strong> as a precursor <strong>of</strong> activated carbon. AppliedBiochemistry <strong>and</strong> Biotechnology 129–132, 762-773.Bansode, R., Losso, J., Marshall, W., Rao, R., Portier, R., 2003. Pecan shell-based granularactivated carbon for treatment <strong>of</strong> chemical oxygen dem<strong>and</strong> (COD) <strong>in</strong> municipal wastewater.Bioresource Technology 94, 129-135.Baum, E., Weitner, S., 2006. <strong>Biochar</strong> application on soils <strong>and</strong> cellulosic ethanol production.Clean Air Task Force, Boston, MA, U.S.A.Beegle, D.B., L<strong>in</strong>genfelter, D.D., 2005. Soil acidity <strong>and</strong> aglime. Agrifacts 3. College <strong>of</strong>Agricultural Sciences, Cooperative Extension, Pennsylvania State University.http://cropsoil.psu.edu/Extension/Facts/AgFact3.pdf.Blackwell, P., Riethmuller, G., Coll<strong>in</strong>s, M., 2009. <strong>Biochar</strong> application to the soil. In: J. Lehmann<strong>and</strong> S. Joseph (Eds.), <strong>Biochar</strong> for Environmental Management: Science <strong>and</strong> Technology.Earthscan Publications Ltd., United K<strong>in</strong>gdom, pp. 207-222.Blas<strong>in</strong>g, T.J., Broniak, C.T., Marl<strong>and</strong>, G., 2004. Estimates <strong>of</strong> monthly CO 2 emissions <strong>and</strong>associated 13 C/ 12 C values from fossil-fuel consumption <strong>in</strong> the U.S.A. In: Trends: ACompendium <strong>of</strong> Data on Global Change, <strong>Carbon</strong> Dioxide Information Analysis Center. OakRidge National Laboratory, U.S. Department <strong>of</strong> Energy, Oak Ridge, TN, U.S.A.Boateng, A. A., 2007. Characterization <strong>and</strong> thermal conversion <strong>of</strong> charcoal derived fromfluidized-bed fast pyrolysis oil production <strong>of</strong> switchgrass. Industrial & Eng<strong>in</strong>eer<strong>in</strong>gChemistry Research 46(26), 8857-8862.California Plant Health Association (CPHA). 2002. Western Fertilizer H<strong>and</strong>book, n<strong>in</strong>th ed.Interstate Publishers, Inc., Danville, IL., U.S.A.15
Chan, K.Y., Van Zwieten, L., Meszaros, I., Downie, A., Joseph, S., 2008. Us<strong>in</strong>g poultry litterbiochars as soil amendments. Australian Journal <strong>of</strong> Soil Research 46(5), 437–444.Chan, K.Y., Xu, Z., 2009. <strong>Biochar</strong>: nutrient properties <strong>and</strong> their enhancement. In: J. Lehmann<strong>and</strong> S. Joseph (Eds.). <strong>Biochar</strong> for Environmental Management: Science <strong>and</strong> Technology.Earthscan Publications Ltd., United K<strong>in</strong>gdom, pp. 67-81.Chicago Climate Exchange (CCX), 2008. December 2008 market summary. CCS MarketReport 5(12), 1-4.http://www.chicagoclimatex.com/docs/publications/CCX_carbonmkt_V5_i12_dec2008.pdf.Coll<strong>in</strong>s, H., 2008. Use <strong>of</strong> biochar from the pyrolysis <strong>of</strong> waste organic material as a soilamendment: laboratory <strong>and</strong> greenhouse analyses.” A quarterly progress report prepared forthe <strong>Biochar</strong> Project (December 2008).Dynamotive Energy Systems, 2007. Table 1: Comparison <strong>of</strong> fuel properties-wood basedpyrolysis fuel.”Energy Information Adm<strong>in</strong>istration (EIA), 2009. Coal news <strong>and</strong> market reports, average weeklycoal commodity spot prices, January to December 2008.”http://www.eia.doe.gov/cneaf/coal/page/coalnews/cnmarchive.html.European Climate Exchange (ECX), 2008. Certified emission reduction futures contracts —2008 historic data. http://www.ecx.eu/CER-Futures.Food <strong>and</strong> Agriculture Organization (FAO), Forest Resources Division, 2009. Afforestation <strong>and</strong>reforestation projects under the Clean Development Mechanism <strong>of</strong> the Kyoto Protocol. Factsheet. http://www.fao.org/forestry/media/8953/1/0/.16
Gaunt, J.L., Lehmann, J., 2008. Energy balance <strong>and</strong> emissions associated with biocharsequestration <strong>and</strong> pyrolysis bioenergy production. Environmental Science <strong>and</strong> Technology42(11), 4152–4158.Glaser, B., Lehmann, J., Zech, W., 2002. Ameliorat<strong>in</strong>g physical <strong>and</strong> chemical properties <strong>of</strong>highly weathered soils <strong>in</strong> the tropics with charcoal – a review. Biology <strong>and</strong> Fertility <strong>of</strong> Soil35, 219–230.Granatste<strong>in</strong>, D., Kruger, C.E., Coll<strong>in</strong>s, H., Gal<strong>in</strong>ato, S., Garcia-Perez, M., Yoder, J., 2009. Use <strong>of</strong>biochar from the pyrolysis <strong>of</strong> waste organic material as a soil amendment. F<strong>in</strong>al ProjectReport. Center for Susta<strong>in</strong><strong>in</strong>g Agriculture <strong>and</strong> Natural Resources, Wash<strong>in</strong>gton StateUniversity, Wenatchee, WA. 181 pp. http://www.ecy.wa.gov/biblio/0907062.html.International <strong>Biochar</strong> Initiative (IBI), 2009. <strong>Biochar</strong> kiln designs for small farms.http://www.biochar-<strong>in</strong>ternational.org/projects<strong>and</strong>programs/memberprojects.html.Johannes, H., 2008. Energy efficient stoves that burn biochar <strong>and</strong> biosmoke only <strong>and</strong> can savethe world's forests. http://www.hedon.<strong>in</strong>fo/BP20:<strong>Biochar</strong>Briquett<strong>in</strong>gAndBurn<strong>in</strong>g.Kearns, J., 2008. NGOs team up to <strong>of</strong>fer climate solutions, enhanced susta<strong>in</strong>able agriculture, <strong>and</strong>clean dr<strong>in</strong>k<strong>in</strong>g water.” http://globalclimatesolutions.org/2008/10/25/ngos-team-up-to-<strong>of</strong>ferclimate-solutions-enhanced-susta<strong>in</strong>able-agriculture-<strong>and</strong>-clean-dr<strong>in</strong>k<strong>in</strong>g-water/.Laird, D.A., 2008. <strong>The</strong> charcoal vision: A w<strong>in</strong>-w<strong>in</strong>-w<strong>in</strong> scenario for simultaneously produc<strong>in</strong>gbioenergy, permanently sequester<strong>in</strong>g carbon, while improv<strong>in</strong>g soil <strong>and</strong> water quality.Agronomy Journal 100(1), 178-181.Lehmann, J., Kern, D.C., Glaser, B., Woods, W.I. (eds.), 2004. Amazonian Dark Earths: Orig<strong>in</strong>,Properties, Management. Kluwer Academic Publishers, New York, 523 pp.17
Lehmann, J., Gaunt, J., Rondon, M., 2006. Bio-char sequestration <strong>in</strong> terrestrial ecosystems — areview. Mitigation <strong>and</strong> Adaptation Strategies for Global Change 11, 403-427.Lima, I.M., McAloon, A., Boateng, A.A., 2008. Activated carbon from broiler litter: processdescription <strong>and</strong> cost <strong>of</strong> production. Biomass <strong>and</strong> Bioenergy 32, 568-572.Mahler, R.L., 1986. Evaluation <strong>of</strong> soil pH manipulation on crop production <strong>in</strong> northern Idaho.Communications <strong>in</strong> Soil Science <strong>and</strong> Plant Analysis 17(9), 905-919.McCarl, B..A., C. Peacocke, R. Chrisman, C.-C. Kung, <strong>and</strong> R.D. S<strong>and</strong>s. 2009. <strong>Economic</strong>s <strong>of</strong>biochar production, utilisation <strong>and</strong> GHG <strong>of</strong>fsets. In: J. Lehmann <strong>and</strong> S. Joseph (Eds.).<strong>Biochar</strong> for Environmental Management: Science <strong>and</strong> Technology. Earthscan PublicationsLtd., United K<strong>in</strong>gdom, pp. 341-356.Ng, C., Marshall, W.E., Rao, R.M., Bansode, R.R., Losso, J.N., 2003. Activated carbon frompecan shells: process description <strong>and</strong> economic analysis. Industrial <strong>Crop</strong>s <strong>and</strong> Products 17,209–217.Pa<strong>in</strong>ter, K., Unpublished. 2008 <strong>Crop</strong> Rotation Budgets, Over 18" Precipitation Zone UnderConventional Tillage, Whitman County, Wash<strong>in</strong>gton.Polagye, B.L., Hodgson, K.T., Maltea, P.C., 2007. An economic analysis <strong>of</strong> bio-energy optionsus<strong>in</strong>g th<strong>in</strong>n<strong>in</strong>gs from overstocked forests. Biomass <strong>and</strong> Bioenergy, 31, 105-125.Prairie Gra<strong>in</strong>s Magaz<strong>in</strong>e, 2003. Gra<strong>in</strong> math weights, measures <strong>and</strong> conversion factors.http://www.smallgra<strong>in</strong>s.org/spr<strong>in</strong>gwh/June03/weights/weights.htm.Rondon, M. A., Lehmann, J., Ramírez, J., Hurtado, M., 2007. Biological nitrogen fixation bycommon beans (Phaseolus vulgaris L.) <strong>in</strong>creases with bio-char additions. Biology <strong>and</strong>Fertility <strong>of</strong> Soils 43(6), 699-708.18
Ste<strong>in</strong>er, C., Teixeira, W.G., Lehmann, J., Nehls, T., Vasconcelos de Macêdo, J.L., Blum,W.E.H., Zech, W., 2007. Long term effects <strong>of</strong> manure, charcoal <strong>and</strong> m<strong>in</strong>eral fertilization oncrop production <strong>and</strong> fertility on a highly weathered Central Amazonian upl<strong>and</strong> soil. PlantSoil 291, 275-290.Union Elevator <strong>and</strong> Warehouse Co., 2008. Cash Prices: FOB L<strong>in</strong>d — August 2008 price postedon July 15, 2008. http://www.unionelevator.com/.United Nations Framework Convention on Climate Change, Clean Development Mechanism(UNFCCC-CDM), 2009. Methodologies for afforestation <strong>and</strong> reforestation CDM projectactivities. http://cdm.unfccc.<strong>in</strong>t/methodologies/ARmethodologies/<strong>in</strong>dex.html.Van Zwieten, L., 2007. Research confirms biochar <strong>in</strong> soils boosts crop yields.http://biopact.com/2007/06/research-confirms-biochar-<strong>in</strong>-soils.html.West, T.O., McBride, A.C., 2005. <strong>The</strong> contribution <strong>of</strong> agricultural lime to carbon dioxideemissions <strong>in</strong> the United States: dissolution, transport <strong>and</strong> net emissions. AgricultureEcosystems <strong>and</strong> Environment 108, 145-154.Young, M.J., Johnson, J.E., Abrams, M.D., 1996. Vegetative <strong>and</strong> Edaphic Characteristics onRelic Charcoal Hearths <strong>in</strong> the Appalachian Mounta<strong>in</strong>s. Plant Ecology 125(1), 43-50.19
Table 1Summary <strong>of</strong> studies on biochar used as a soil amendment.Author(s) Location Soil type Type <strong>of</strong> biochar <strong>Biochar</strong>Kishimoto Japan Volcanic ash(1985) a,b<strong>and</strong> Sugiurasoil, loamapplication rateUnknown wood 0, 0.2, 2.0 <strong>and</strong> 6.1t/acre<strong>Crop</strong>Soybean<strong>Crop</strong> response: At 0.2 t/acre, <strong>in</strong>creased yield by 51%. At 2 t/acre <strong>and</strong> 6.1/acre, reduced yield by 37%<strong>and</strong> 71%, respectively. Reductions were attributed to micronutrient deficiency <strong>in</strong>duced by an<strong>in</strong>crease <strong>in</strong> pH.Mikan <strong>and</strong> UnitedAbrams States(1995) bYoung etal. (1996)(Pennsylvania)Forest area onrelic charcoalhearthsWood for charcoalproductionUnknown<strong>Crop</strong> response: Tree density <strong>and</strong> basal area were reduced by 40%.United Forest area on Wood for charcoal UnknownStates relic charcoal production(Appalachianhearthsmounta<strong>in</strong>s)Vegetation <strong>in</strong>hearth <strong>and</strong>non-hearthareascomparedafter 110 yearsTrees<strong>Crop</strong> response: Lower overstory tree cover <strong>and</strong> density on relic charcoal hearths than on adjacent,non-hearth areas. <strong>The</strong> richness <strong>and</strong> diversity <strong>of</strong> overstory <strong>and</strong> understory tree cover as well as groundvegetation were consistently lower on hearths.Glaser et al.(2002)Brazil XanthicFerralsolSecondary forestwood0, 27.2 <strong>and</strong> 54.7t/acreRice,Cowpea<strong>Crop</strong> response: At application rate <strong>of</strong> 27.2 t/acre, biomass <strong>in</strong>creased by: 20%, rice; 50%, cowpeacompared to control treatment where no biochar was applied. At application rate <strong>of</strong> 54.7 t/acre,biomass <strong>of</strong> cowpea <strong>in</strong>creased by 100%.Ste<strong>in</strong>er Brazil Xanthic Wood 4.5 t/acre Banana(2006) c Ferralsol<strong>Crop</strong> response: Reduced soil acidity <strong>and</strong> <strong>in</strong>creased K uptakeYamamoto et Indonesia Acid soil Bark 6.1 t/acre Maizeal. (2006) c<strong>Crop</strong> response: Higher yields with biochar <strong>and</strong> fertilizer, than fertilizer aloneSte<strong>in</strong>er et Brazil Xanthic Secondary forest 4.5 t/acre Rice,al. (2007)Ferralsol woodSorghum<strong>Crop</strong> response: Charcoal plus m<strong>in</strong>eral fertilizer improved yield by a factor <strong>of</strong> 1.5-2 <strong>and</strong> improvedstover by a factor <strong>of</strong> 1.3-1.4. Us<strong>in</strong>g charcoal plus compost <strong>and</strong>/or fertilizer, yields are consistentlygreater (i.e., 4 to 12 times greater) compared to us<strong>in</strong>g fertilizer alone.Sources: a Adopted from Glaser et al. (2002); b Adopted from Chan <strong>and</strong> Xu (2009); c Adopted fromBlackwell et al. (2009).20
Table 1 (cont<strong>in</strong>ued)Summary <strong>of</strong> studies on biochar used as a soil amendment.Author(s) Location Soil type Type <strong>of</strong> biochar <strong>Biochar</strong>VanZwieten(2007)AustraliaSemi-tropicalsoil<strong>Crop</strong>application rate4 t/acre Wheat,soybeans<strong>Crop</strong> response: Wheat: biomass tripled. Soybeans: biomass more than doubled. Percentage <strong>in</strong>crease<strong>in</strong> biomass is the same when nitrogen fertilizer is applied together with biochar. <strong>Biochar</strong> raised soilpH at about 1/3 the rate <strong>of</strong> lime.Van Zwieten et Australia Ferrosol Paper mill sludge 4 t/acre Wheatal. (2007) b<strong>Crop</strong> response: 30-40% <strong>in</strong>crease <strong>in</strong> wheat height <strong>in</strong> acidic soil but not <strong>in</strong> alkal<strong>in</strong>e soil. Responsewas attributed ma<strong>in</strong>ly to the lim<strong>in</strong>g value <strong>of</strong> biochar.Coll<strong>in</strong>s(2008)Wash<strong>in</strong>gton Qu<strong>in</strong>cy s<strong>and</strong>, Peanut hull (PH), 0, 5, 10 <strong>and</strong> 20 WheatHale silt loam fir bark (SB) t/acre<strong>Crop</strong> response: Qu<strong>in</strong>cy: Root-shoot ratio <strong>of</strong> wheat decreased <strong>in</strong> all application rates <strong>of</strong> biochar.Hale: Us<strong>in</strong>g PH, decl<strong>in</strong>e <strong>in</strong> root-shoot ratio <strong>of</strong> wheat at 10 t/acre <strong>of</strong> biochar compared to nil; nochange at 5 t/acre <strong>and</strong> 20 t/acre. Hale: Us<strong>in</strong>g SB, root-shoot ratio <strong>of</strong> wheat <strong>in</strong>creased <strong>in</strong> alltreatments. 0.5 to 1 unit <strong>in</strong>crease <strong>in</strong> soil pH due to biochar additionAustralia Ferrosol Poultry litter (PL),Chan et al. Australia Alfisol Poultry litter 0, 4, 10.1 <strong>and</strong> 20.2 Radish(2008)t/acre<strong>Crop</strong> response: With biochar, without N fertilizer: yield <strong>in</strong>creased from 42% at 4 t/acre <strong>of</strong> biochar to96% at 20.2 t/acre <strong>of</strong> biochar, relative to the yield from unamended control.VanMaize: 0.2-20.2 t/acre Maize,al. (2008) c waste(PM)<strong>and</strong> PM versus 1.2 t/acreZwieten etPaper millPL. Beans: 4 t/acre PL Faba beanslime<strong>Crop</strong> response: Maize: 51% yield <strong>in</strong>crease at 4 t/acre; <strong>and</strong> 109% yield <strong>in</strong>crease at 20.2 t/acrecompared to nil. Beans: Yields are highest with biochar plus fertilizer, compared to biochar alone.PL biochar outperformed lime amendment.Sources: a Adopted from Glaser et al. (2002); b Adopted from Chan <strong>and</strong> Xu (2009); c Adopted fromBlackwell et al. (2009)21
Table 2Selected characteristics <strong>of</strong> six biochars (slow pyrolysis at 500oC) used <strong>in</strong> the laboratory analyses.Source <strong>of</strong> biochar <strong>Biochar</strong> CharacteristicsC N S C:N C:S pH--------- % ---------Switchgrass 60.5 2.06 0.20 30 350 9.4Digested fiber 66.7 2.23 0.30 30 228 9.3Peanut hull 70.6 1.74 0.04 41 1203 9.6Bark (UGA) 74.5 0.34 0.03 220 2833 7.6S<strong>of</strong>twood bark 77.8 0.44 0.06 176 1482 8.4Wood Pellets 80.0 0.14 0.04 588 1855 7.4Activated Charcoal 87.3 0.47 0.80 186 114 9.1Source: Coll<strong>in</strong>s (2008).Note: Activated charcoal is <strong>in</strong>cluded as a st<strong>and</strong>ard analysis <strong>and</strong> comparison to biochars.22
Table 3Comparison <strong>of</strong> pr<strong>of</strong>its from w<strong>in</strong>ter wheat production a (US$ per acre), with <strong>and</strong> without biocharapplication.Scenario Revenue CO 2Offset<strong>Value</strong> bWithout biochar oragricultural lime applicationTotalCost cCost <strong>of</strong>Ag Lime dCost <strong>of</strong><strong>Biochar</strong> dPr<strong>of</strong>it e$438 — $415 — — $23With ag lime application $694 — $415 $133 — $146With biochar application, when <strong>of</strong>fset price is $1/MT CO 2 <strong>and</strong> the price <strong>of</strong> biochar (P B ) is…P B1 = $350.74/metric ton f $694 $90 $415 — $10,740 -$10,371P B2 = $114.05/metric ton g $694 $90 $415 — $3,492 -$3,123P B3 = $87/metric ton f $694 $90 $415 — $2,664 -$2,295With biochar application, when <strong>of</strong>fset price is $31/MT CO 2 <strong>and</strong> the price <strong>of</strong> biochar (P B ) is…P B1 = $350.74/metric ton f $694 $2,799 $415 — $10,740 -$7,662P B2 = $114.05/metric ton g $694 $2,799 $415 — $3,492 -$414P B3 = $87/metric ton f $694 $2,799 $415 — $2,664 $414Figures for the revenue, CO 2 <strong>of</strong>fset value, cost <strong>and</strong> pr<strong>of</strong>it are rounded to the nearest whole number.a <strong>The</strong> assumed base soil pH is 4.5. <strong>Biochar</strong> or agricultural lime application is <strong>in</strong>tended to raise the assumed soil pHto 6.b CO 2 Offset <strong>Value</strong> = 90.29 metric tons <strong>of</strong> CO 2 <strong>of</strong>fset per acre from avoided emissions <strong>of</strong> lime <strong>and</strong> biochar Csequestration (see Appendix) times the price <strong>of</strong> CO 2 <strong>of</strong>fset ($1 or $31 per MT CO 2 ).c From 2008 Enterprise Budget for Eastern Whitman County, Conventional Tillage (Pa<strong>in</strong>ter, unpub.). To illustratethe estimation <strong>of</strong> a farmer’s pr<strong>of</strong>its with <strong>and</strong> without ag lime or biochar application, we chose Eastern WhitmanCounty as example based on Mahler et al. (1985). <strong>The</strong> study found that the pH <strong>of</strong> soils <strong>in</strong> eastern Wash<strong>in</strong>gton hadsignificantly decl<strong>in</strong>ed. By 1980, more than 65 percent <strong>in</strong> Whitman County had a soil pH less than 6.d Excludes the cost <strong>of</strong> apply<strong>in</strong>g lime or biochar to agricultural l<strong>and</strong> (mach<strong>in</strong>ery <strong>and</strong> labor cost).e Pr<strong>of</strong>it = Revenue + CO 2 <strong>of</strong>fset value – Total Cost – Ag Lime Cost – <strong>Biochar</strong> Cost. All are <strong>in</strong> US$ per acre.fObta<strong>in</strong>ed from Granatste<strong>in</strong> et al. (2009)g Based on the energy content <strong>of</strong> a wood-based biochar.23
4,0002,0000Pr<strong>of</strong>it ($/acre)-2,000-4,000-6,00010408087114120160200240280320351$1/metric ton <strong>of</strong> CO2$31/metric ton <strong>of</strong> CO2-8,000-10,000-12,000Price <strong>of</strong> biochar ($/metric ton)Fig. 1. Pr<strong>of</strong>it given the low/high price <strong>of</strong> CO 2 <strong>of</strong>fset <strong>and</strong> different prices <strong>of</strong> biochar.24
AppendixAssumptions used to calculate the value <strong>of</strong> CO 2 <strong>of</strong>fset1. Case study: Eastern Whitman County, a high precipitation region (more than 18” per year)2. Type <strong>of</strong> soil: Silt loam. We use the base pH = 4.5 <strong>in</strong> Coll<strong>in</strong>s (2008) for Palouse silt loam. To <strong>in</strong>creasethe soil pH <strong>of</strong> silt loam by 1.5 units (i.e., from 4.5 to 6), the requirements are:o 2.85 short tons <strong>of</strong> lime per acre (or 2.59 metric tons/acre) * ; oro33.75 short tons <strong>of</strong> biochar per acre (or 30.62 metric tons/acre) .†Note the conversion 1 metric ton (MT) = 1.10231131 short tons.3. Emissions avoidance <strong>and</strong> carbon sequestration from us<strong>in</strong>g biochar as soil amendment:o Avoided emissions for not us<strong>in</strong>g lime = 0.22 MT CO 2 per metric ton <strong>of</strong> limestone ‡o<strong>Biochar</strong> C sequestration = 0.8 ton per metric ton <strong>of</strong> carbon or 2.93 MT CO 2 § per metric ton <strong>of</strong>biochar applied to the soil **4. Estimated carbon sequestration per acre (CO 2 <strong>of</strong>fset per acre) given application <strong>of</strong> biochar tocropl<strong>and</strong>:o Avoided emissions for not us<strong>in</strong>g lime =2.59 MT lime∗(0.22 MT CO 2 /metric ton <strong>of</strong> lime) ≈ 0.57 MT CO 2o <strong>Biochar</strong> C sequestration =30.62 metric ton <strong>of</strong> biochar∗(2.93 MT CO 2 /metric ton <strong>of</strong> biochar) ≈ 89.72 MT CO 2o Total value <strong>of</strong> CO 2 <strong>of</strong>fset per acre ≈ 90.29 MT CO 2* Source: California Plant Health Association (CPHA). 2002. Western Fertilizer H<strong>and</strong>book, 9th edition.Danville, Ill<strong>in</strong>ois: Interstate Publishers, Inc.† Source: H. Coll<strong>in</strong>s, unpublished data. Palouse silt loam soil analysis, biochar analyses.‡ Source: West, Tristram O. <strong>and</strong> Allen C. McBride. 2005. “<strong>The</strong> Contribution <strong>of</strong> Agricultural Lime to <strong>Carbon</strong>Dioxide Emissions <strong>in</strong> the United States: Dissolution, Transport <strong>and</strong> Net Emissions.” Agriculture Ecosystems <strong>and</strong>Environment, 108:145-154.§ To convert from carbon to carbon dioxide, multiply by 44/12 (~3.67) (Blas<strong>in</strong>g, T.J. et al., 2004. Estimates<strong>of</strong> Monthly CO 2 emissions <strong>and</strong> Associated 13C/12C <strong>Value</strong>s from Fossil Fuel Consumption <strong>in</strong> the U.S.A. Availableat: http://cdiac.ornl.gov/trends/emis_mon/emis_mon_co2.html.** Based on biochar content <strong>of</strong> p<strong>in</strong>e pellets. Source: Coll<strong>in</strong>s, Hal. 2008. “Use <strong>of</strong> <strong>Biochar</strong> from the Pyrolysis<strong>of</strong> Waste Organic Material as a Soil Amendment: Laboratory <strong>and</strong> Greenhouse Analyses.” Quarterly report preparedfor the <strong>Biochar</strong> Project (December 2008).25