Algorithms for the visualization and simulation of mobile ad hoc and ...
Algorithms for the visualization and simulation of mobile ad hoc and ...
Algorithms for the visualization and simulation of mobile ad hoc and ...

Create successful ePaper yourself
Turn your PDF publications into a flip-book with our unique Google optimized e-Paper software.
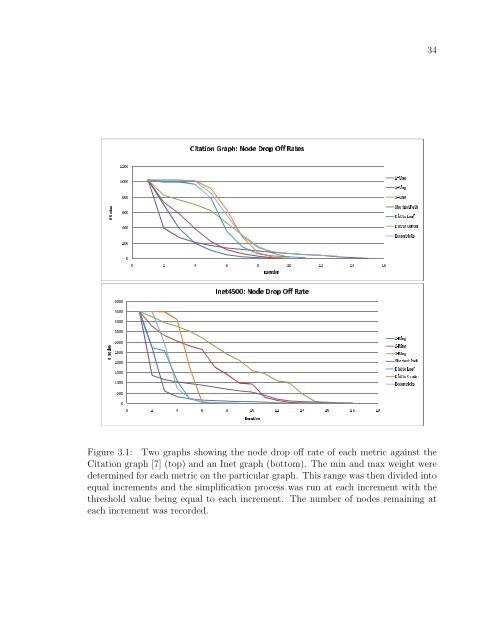
# Nodes200 600 1000 Citation 800 1200 Graph: Node Drop Off Rates 1-Ring 2-Ring Shortest Path 3-RingLeaf Dist to Center Eccentricity Iteration 16 14 12 10 8 6 4 2 0 400034Figure 3.1: Two graphs showing <strong>the</strong> node drop <strong>of</strong>f rate <strong>of</strong> each metric against <strong>the</strong>Citation graph [7] (top) <strong>and</strong> an Inet graph (bottom). The min <strong>and</strong> max weight weredetermined <strong>for</strong> each metric on <strong>the</strong> particular graph. This range was <strong>the</strong>n divided intoequal increments <strong>and</strong> <strong>the</strong> simplification process was run at each increment with <strong>the</strong>threshold value being equal to each increment. The number <strong>of</strong> nodes remaining ateach increment was recorded.1500 2500 3500 4500 3000 5000 4000 12 14 16 18 20 # Nodes Inet4500: Node Drop Off Rate 1-Ring 2-Ring 3-RingIteration Shortest PathLeaf Dist to Center Eccentricity 10 8 6 4 2 0 2000 10000