Algorithms for the visualization and simulation of mobile ad hoc and ...
Algorithms for the visualization and simulation of mobile ad hoc and ...
Algorithms for the visualization and simulation of mobile ad hoc and ...

Create successful ePaper yourself
Turn your PDF publications into a flip-book with our unique Google optimized e-Paper software.
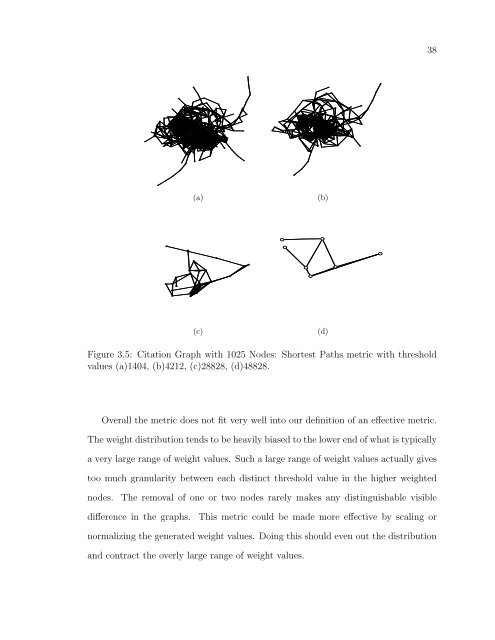
38(a)(b)(c)(d)Figure 3.5: Citation Graph with 1025 Nodes: Shortest Paths metric with thresholdvalues (a)1404, (b)4212, (c)28828, (d)48828.Overall <strong>the</strong> metric does not fit very well into our definition <strong>of</strong> an effective metric.The weight distribution tends to be heavily biased to <strong>the</strong> lower end <strong>of</strong> what is typicallya very large range <strong>of</strong> weight values. Such a large range <strong>of</strong> weight values actually givestoo much granularity between each distinct threshold value in <strong>the</strong> higher weightednodes.The removal <strong>of</strong> one or two nodes rarely makes any distinguishable visibledifference in <strong>the</strong> graphs.This metric could be m<strong>ad</strong>e more effective by scaling ornormalizing <strong>the</strong> generated weight values. Doing this should even out <strong>the</strong> distribution<strong>and</strong> contract <strong>the</strong> overly large range <strong>of</strong> weight values.