2003 DISTRICT REPORT CARD - the Ravenna School District
2003 DISTRICT REPORT CARD - the Ravenna School District
2003 DISTRICT REPORT CARD - the Ravenna School District

Create successful ePaper yourself
Turn your PDF publications into a flip-book with our unique Google optimized e-Paper software.
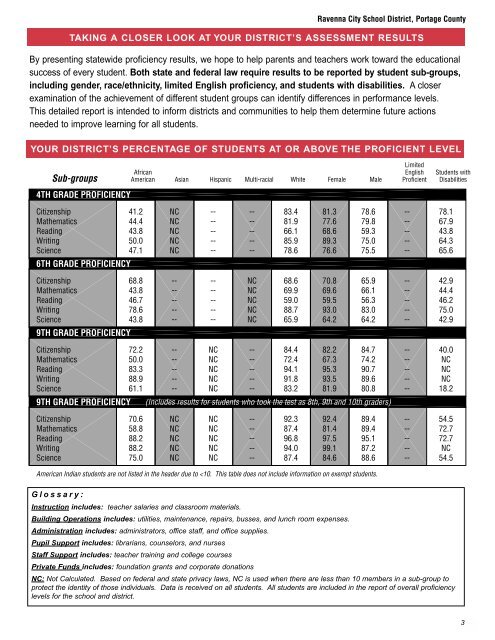
<strong>Ravenna</strong> City <strong>School</strong> <strong>District</strong>, Portage CountyTAKING A CLOSER LOOK AT YOUR <strong>DISTRICT</strong>’S ASSESSMENT RESULTSBy presenting statewide proficiency results, we hope to help parents and teachers work toward <strong>the</strong> educationalsuccess of every student. Both state and federal law require results to be reported by student sub-groups,including gender, race/ethnicity, limited English proficiency, and students with disabilities. A closerexamination of <strong>the</strong> achievement of different student groups can identify differences in performance levels.This detailed report is intended to inform districts and communities to help <strong>the</strong>m determine future actionsneeded to improve learning for all students.YOUR <strong>DISTRICT</strong>’S PERCENTAGE OF STUDENTS AT OR ABOVE THE PROFICIENT LEVELSub-groupsAfricanAmericanLimitedEnglishAsian Hispanic Multi-racial White Female Male ProficientStudents withDisabilities4TH GRADE PROFICIENCYCitizenship 41.2 NC -- -- 83.4 81.3 78.6 -- 78.1Ma<strong>the</strong>matics 44.4 NC -- -- 81.9 77.6 79.8 -- 67.9Reading 43.8 NC -- -- 66.1 68.6 59.3 -- 43.8Writing 50.0 NC -- -- 85.9 89.3 75.0 -- 64.3Science 47.1 NC -- -- 78.6 76.6 75.5 -- 65.66TH GRADE PROFICIENCYCitizenship 68.8 -- -- NC 68.6 70.8 65.9 -- 42.9Ma<strong>the</strong>matics 43.8 -- -- NC 69.9 69.6 66.1 -- 44.4Reading 46.7 -- -- NC 59.0 59.5 56.3 -- 46.2Writing 78.6 -- -- NC 88.7 93.0 83.0 -- 75.0Science 43.8 -- -- NC 65.9 64.2 64.2 -- 42.99TH GRADE PROFICIENCYCitizenship 72.2 -- NC -- 84.4 82.2 84.7 -- 40.0Ma<strong>the</strong>matics 50.0 -- NC -- 72.4 67.3 74.2 -- NCReading 83.3 -- NC -- 94.1 95.3 90.7 -- NCWriting 88.9 -- NC -- 91.8 93.5 89.6 -- NCScience 61.1 -- NC -- 83.2 81.9 80.8 -- 18.29TH GRADE PROFICIENCY (Includes results for students who took <strong>the</strong> test as 8th, 9th and 10th graders)Citizenship 70.6 NC NC -- 92.3 92.4 89.4 -- 54.5Ma<strong>the</strong>matics 58.8 NC NC -- 87.4 81.4 89.4 -- 72.7Reading 88.2 NC NC -- 96.8 97.5 95.1 -- 72.7Writing 88.2 NC NC -- 94.0 99.1 87.2 -- NCScience 75.0 NC NC -- 87.4 84.6 88.6 -- 54.5American Indian students are not listed in <strong>the</strong> header due to