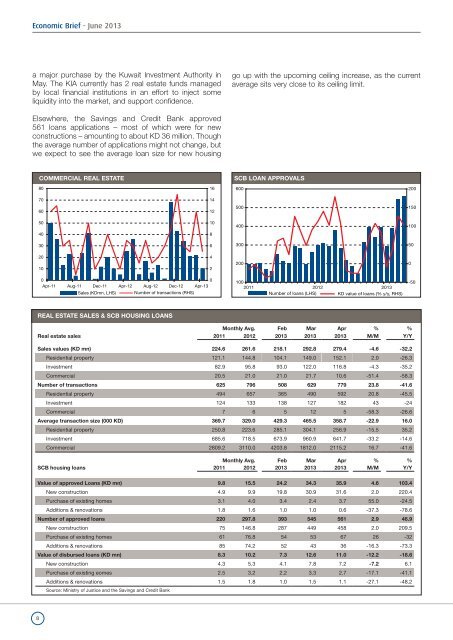
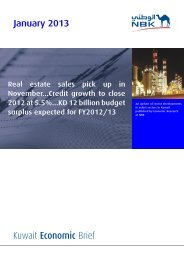
<strong>Economic</strong> <strong>Brief</strong> - June 2013a major purchase by the <strong>Kuwait</strong> Investment Authority inMay. The KIA currently has 2 real estate funds managedby local financial institutions in an effort to inject someliquidity into the market, and support confidence.go up with the upcoming ceiling increase, as the currentaverage sits very close to its ceiling limit.Elsewhere, the Savings and Credit <strong>Bank</strong> approved561 loans applications – most <strong>of</strong> which were for newconstructions – amounting to about KD 36 million. Thoughthe average number <strong>of</strong> applications might not change, butwe expect to see the average loan size for new housingCOMMERCIAL REAL ESTATESCB LOAN APPROVALS801660020070146012500150501040010040830630050201042200000Apr-11 Aug-11 Dec-11 Apr-12 Aug-12 Dec-12 Apr-13Sales (KDmn, LHS) Number <strong>of</strong> transactions (RHS)1002011 2012 2013Number <strong>of</strong> loans (LHS) KD value <strong>of</strong> loans (% y/y, RHS)-50REAL ESTATE SALES & SCB HOUSING LOANSMonthly Avg. Feb Mar Apr % %Real estate sales 2011 2012 2013 2013 2013 M/M Y/YSales values (KD mn) 224.6 261.6 218.1 292.8 279.4 -4.6 -32.2Residential property 121.1 144.8 104.1 149.0 152.1 2.0 -26.3Investment 82.9 95.8 93.0 122.0 116.8 -4.3 -35.2Commercial 20.5 21.0 21.0 21.7 10.6 -51.4 -58.3Number <strong>of</strong> transactions 625 796 508 629 779 23.8 -41.6Residential property 494 657 365 490 592 20.8 -45.5Investment 124 133 138 127 182 43 -24Commercial 7 6 5 12 5 -58.3 -26.6Average transaction size (000 KD) 369.7 329.0 429.3 465.5 358.7 -22.9 16.0Residential property 250.8 223.6 285.1 304.1 256.9 -15.5 35.2Investment 685.6 718.5 673.9 960.9 641.7 -33.2 -14.6Commercial 2809.2 3110.0 4203.8 1812.0 2115.2 16.7 -41.6Monthly Avg. Feb Mar Apr % %SCB housing loans 2011 2012 2013 2013 2013 M/M Y/YValue <strong>of</strong> approved Loans (KD mn) 9.8 15.5 24.2 34.3 35.9 4.6 103.4New construction 4.9 9.9 19.8 30.9 31.6 2.0 220.4Purchase <strong>of</strong> existing homes 3.1 4.0 3.4 2.4 3.7 55.0 -24.5Additions & renovations 1.8 1.6 1.0 1.0 0.6 -37.3 -78.6Number <strong>of</strong> approved loans 220 297.8 393 545 561 2.9 46.9New construction 75 146.8 287 449 458 2.0 209.5Purchase <strong>of</strong> existing homes 61 76.8 54 53 67 26 -32Additions & renovations 85 74.2 52 43 36 -16.3 -73.3Value <strong>of</strong> disbursed loans (KD mn) 8.3 10.2 7.3 12.6 11.0 -12.2 -18.6New construction 4.3 5.3 4.1 7.8 7.2 -7.2 6.1Purchase <strong>of</strong> existing eomes 2.5 3.2 2.2 3.3 2.7 -17.1 -41.1Additions & renovations 1.5 1.8 1.0 1.5 1.1 -27.1 -48.2Source: Ministry <strong>of</strong> Justice and the Savings and Credit <strong>Bank</strong>8
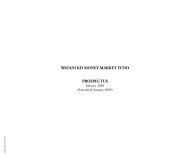
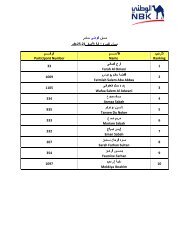
<strong>Kuwait</strong> Stock ExchangeSignificant gains recorded in May, on higher volumes2013 is turning out to be a very good year for the localmarket. After having registered some noticeable gains inthe first 4 months <strong>of</strong> the year, May was an exceptionallygood month for the <strong>Kuwait</strong> Stock Exchange (KSE). Theprice index closed at 8301, registering a monthly gain <strong>of</strong>11.7% despite the correction in the last two trading days<strong>of</strong> the month. Small cap stocks continue to be the maindriver behind the rally. However, the value-weighted index,a better representative <strong>of</strong> the performance <strong>of</strong> large caps,rose a smaller but still good 4.5%. The month <strong>of</strong> May alsosaw a significant boost in market liquidity and daily tradedvalue averaged KD 107 million, its highest level in 4 years.the best performer in May. Telecommunication was theonly sector noticeably <strong>of</strong>f on the month (-3.1%).Market capitalization stood at KD 30.7 billion at the close<strong>of</strong> the month, up around KD 1 billion since the end <strong>of</strong> Apriland KD 1.5 billion so far this year. However; market activitymight lose some steam as we near the summer/Ramadanslow season.REGIONAL MARKETS REBASED PERFORMANCE120110120110The relative calm between the <strong>National</strong> Assembly and thegovernment continues to fuel optimism regarding largeprojects in the development plan. That, coupled with agenerally good year so far for international markets, hasbeen the main catalyst for the now months-long rally.10090801009080On a sector level, while financial services and real estatecontinue to outperform, the consumer goods sector was70May-11 Sep-11 Jan-12 May-12 Sep-12 Jan-13 May-13S&P <strong>Kuwait</strong> S&P GCC S&P Pan Arab70KSE DAILY PERFORMANCEKSE REBASED PERFORMANCE180860014014016014084001301301208200120120million KD100806080007800index110100110100402076009090026 8 12 14 16 20May 2013Value <strong>of</strong> Traded Shares (left)22 26 28 30KSE Index (right)74008080May.12 Jul.12 Sep.12 Nov.12 Jan.13 Mar.13 May.13Value Weighted (LHS) Price Index (RHS)KSE PERFORMANCE BY SECTOR, MAY 2013Price- Market % Change Market Cap. % <strong>of</strong> Trading Activity Price toWeighted (IXP) Weighted (IXW) IXP IXW (million KD) Market (daily average) Earnings +31-May-13 31-May-13 m/m YTD m/m YTD 31-May-13 m/m mn shares mn KD 31-May-13KSE 8,301 476 11.7 39.9 4.5 14.0 30,720 100.0% 1,152.3 107.2 14Oil & Gas 1,234 513 -0.2 21.7 -0.4 21.7 297 1.0% 44.7 3.4 13Basic Materials 1,240 595 11.4 27.1 7.9 23.3 722 2.4% 2.1 0.6 ...Industrials 1,254 620 15.3 34.2 10.0 18.9 3,145 10.2% 163.8 13.5 13Consumer Goods 1,220 824 15.9 32.6 20.6 37.8 1,025 3.3% 17.3 2.2 18Health Care 1,122 527 5.6 ... 6.3 ... 209 0.7% 0.1 0.1 12Consumer Services 1,082 566 4.0 15.1 2.7 13.4 930 3.0% 4.6 0.8 15Telecommunications 968 510 5.3 8.3 -3.1 -0.9 4,217 13.7% 26.8 3.4 9Utilities ... ... ... ... ... ... ... ... ... ... ...<strong>Bank</strong>s 1,147 535 4.4 14.2 2.4 9.6 13,770 44.8% 77.8 17.3 14Insurance 1,219 561 21.2 33.3 8.6 12.5 348 1.1% 4.3 0.4 8Real Estate 1,599 692 12.3 60.8 7.2 27.9 2,789 9.1% 395.0 33.3 17Financial Services 1,245 622 14.3 49.9 12.7 33.0 3,192 10.4% 410.5 31.6 ...Invt. Instruments ... ... ... ... ... ... ... .... ... ... ...Technology 1,152 565 -1.2 38.0 2.1 46.9 78 0.3% 5.4 0.7 10Parallel 1,482 521 12.4 28.9 1.9 4.5 ... ... 13.6 1.1 ...Source: <strong>Kuwait</strong> Stock Exchange and Zawya.* PE is calculated using market cap as <strong>of</strong> month close and 12 months trailing earnings.9