Surface-dependent chemical equilibrium constants and ...
Surface-dependent chemical equilibrium constants and ...
Surface-dependent chemical equilibrium constants and ...

Create successful ePaper yourself
Turn your PDF publications into a flip-book with our unique Google optimized e-Paper software.
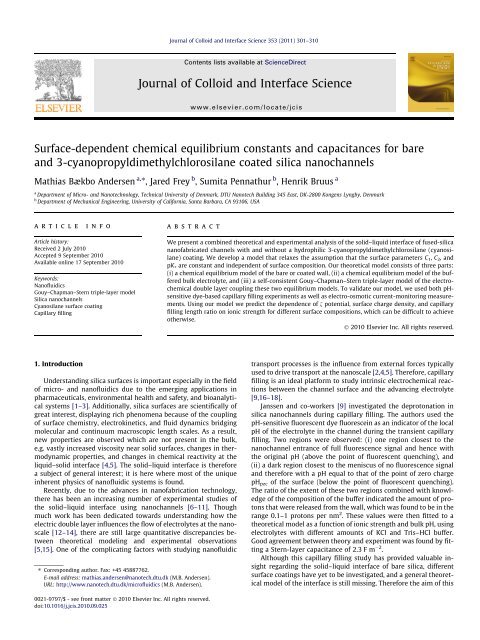
302 M.B. Andersen et al. / Journal of Colloid <strong>and</strong> Interface Science 353 (2011) 301–310surface pK a <strong>constants</strong> vary self-consistently with the <strong>chemical</strong>composition of the wall.2.1. Schematic description of the modelFig. 1. Sketch of the solid-electrolyte interface showing the atoms/ions as hardspheres of sizes proportional to their hydrated or covalent radii (see Supportinginformation Sec. S2). To the left are the five possible surface site complexes: (i)SiOH, (ii) SiOK, (iii) SiOH þ 2 , (iv) SiC 6H 12 NSi (cyanosilane), <strong>and</strong> (v) SiO . In betweenthe solid SiO 2 -wall <strong>and</strong> the charge neutral bulk there are three interfacial layerswith the following surface charges: r 0 , the layer containing the reactive surfacegroups; r b , the layer containing adsorbed K + <strong>and</strong> cyanosilanes; <strong>and</strong> r d , the diffusescreening layer. Also indicated on the figure is a graph of the electric potential /(red full curve) <strong>and</strong> the three interfacial potentials / 0 , / b , <strong>and</strong> / d . (For interpretationof the references to colour in this figure legend, the reader is referred to the webversion of this article.)work is to extend the current model to allow surface-relatedparameters, such as Stern-layer capacitance C s <strong>and</strong> the surface<strong>equilibrium</strong> pK a <strong>constants</strong> to vary with the composition of thesolid–liquid interface as sketched in Fig. 1. We quantify thesedependencies combining an extended version of current theoreticalmodeling <strong>and</strong> capillary filling experiments in bare <strong>and</strong> coatedsilica nanochannels.The paper is organized as follows: in Section 2 we present adescription of our solid–liquid interface model. Next, we introducethe equations that define the model. In Section 3 we list the <strong>chemical</strong>sused in our study <strong>and</strong> present the design, fabrication, <strong>and</strong>characterization of the silica nanochannels. In Section 4 we describethe experimental setup <strong>and</strong> the experiments performed tovalidate our model, as well as the determination of the parametersused as input in our model. In Section 5 we show the results of ourcombined experimental <strong>and</strong> theoretical investigation. Finally, inSections 6 <strong>and</strong> 7 we discuss our findings <strong>and</strong> summarize ourconclusions.2. Theoretical modelingThe basis of our theoretical model is the Gouy–Chapman–Sterntheory [19,9] combined with the more elaborate triple-layer model[20–23] of the solid–liquid interface. This complexity of modelingis necessary to simultaneously describe the observations for bare<strong>and</strong> cyanosilane-coated silica nanochannels. Our theoretical modelinvolves three elements: (i) <strong>chemical</strong> <strong>equilibrium</strong> of the bulk electrolytein terms of ionic concentrations <strong>and</strong> <strong>equilibrium</strong> pK a <strong>constants</strong>[24]; (ii) electro<strong>chemical</strong> <strong>equilibrium</strong> of the proton <strong>and</strong>metal adsorption at the surface in terms of electrostatics, concentrationof adsorption sites <strong>and</strong> ions, <strong>and</strong> <strong>equilibrium</strong> pK a <strong>constants</strong>[20,21,23]; <strong>and</strong> (iii) electro<strong>chemical</strong> coupling between bulk <strong>and</strong>surface in terms of the Poisson–Boltzmann equation. An importantpoint in our work is that we let the surface capacitances <strong>and</strong> theWe model the solid-electrolyte interface as consisting of threedifferent interfacial layers, as sketched in Fig. 1. All quantities havebeen averaged on planes parallel to the silica wall, which is assumedflat on the microscopic length scale. The parameters ofour model are listed in Table 1.The first interfacial layer (subscript 0) closest to the wall consistsof surface silanol sites being either neutral SiOH, deprotonatedSiO , or protonated SiOH þ 2, which together give rise to asurface charge density r 0 . The electric potential here is denoted / 0 .The second interfacial layer (subscript b) is comprised of adsorbedmetallic cations, K + in this particular study. These cationsproduce a surface charge density r b at the plane defined by theirmean position when adsorbed onto SiO . The electric potentialhere is denoted / b . Adsorption of anions is neglected because thebulk pH values studied in this work are always higher than pH pzc .The third interfacial layer (subscript d) is the diffuse layer ofmobile ions screening the surface charge densities r 0 <strong>and</strong> r b overa distance given by the Debye–Hückel screening length k D , whichin this work ranges from approximately 0.3–2 nm. When integratingthe charge density of the diffuse layer along the direction perpendicularto the interface, a resulting surface charge density r dTable 1Input <strong>and</strong> output parameters used in our model.Quantity Symbol UnitInput parameters, literatureViscosity g Pa s<strong>Surface</strong> tension c Nm 1Relative permittivity, electrolyte e r =78Ionic valenceszChemical familyXChemical family member (ion)X zValence minimum/maximumn X /p XEquilibrium <strong>constants</strong> for bulkpK X,zDiffusion <strong>constants</strong> D m 2 s 1Electrophoretic mobilities l m 2 s 1 V 1Total surface site density C tot nm 2pK : SiOH SiO þ H þ 0 pKpK K : SiO þ K þ b SiOK pK KInput parameters, measuredChannel dimensions h,w,L mContact anglehTemperature T KFluorescent, dark zone-length L fl , L d mMeniscus position L fl + L d mApplied potential difference DV VConductivity r el Sm 1pH of bulkpH bInput parameters, fittingInner-layer Stern capacitance C 1 Fm 2Outer-layer Stern capacitance C 2 Fm 2pK + : SiOH þ 2 SiOH þ Hþ 0pK +Output variables, bulkBulk concentrationsMolarity c X,z MNumber density n X,z m 3Ionic strength I MDebye–Hückel screening length k D mTitration concentration of H + B s MOutput variables, surfacepH of point of zero chargepH pzcElectric potentials / 0 , / b , / d V<strong>Surface</strong> charge densities r 0 , r b , r d Cm 2<strong>Surface</strong> site densities C SiO , C SiOH m 2C SiOHþ , C K m 22
M.B. Andersen et al. / Journal of Colloid <strong>and</strong> Interface Science 353 (2011) 301–310 303<strong>and</strong> corresponding potential drop / d are obtained. The electricalpotential is defined to be zero outside the diffuse part of the doublelayer.2.2. Bulk electrolyte chemistryThe <strong>equilibrium</strong> composition of the electrolyte is calculatedusing the scheme presented by Persat <strong>and</strong> co-workers [24]. Thisscheme builds on mass conservation, electroneutrality, <strong>and</strong> <strong>chemical</strong><strong>equilibrium</strong> theory, <strong>and</strong> it unifies the entire system of equationsfor a given buffer in a systematic way that facilitatesefficient numerical implementation. In our implementation of thescheme, X denotes a family of <strong>chemical</strong> species, with X z being aparticular member having valence charge z. Denoting the minimum<strong>and</strong> maximum valences within a family by n X <strong>and</strong> p X , respectively,the <strong>chemical</strong> <strong>equilibrium</strong> reactions for the family X areX p X X p X 1 þ H þ ; pK X;pX 1; ð1aÞX p X 1 X p X 2 þ H þ ; pK X;pX 2; ð1bÞ...X nXþ1 X n Xþ H þ ; pK X;nX ; ð1cÞwhere each pK X,z is an <strong>equilibrium</strong> constant. For instance, for phosphoricacid the family is X 0 ¼ H 3 PO 4 ; X 1 ¼ H 2 PO 1 4 ; X 2 ¼ HPO 2 4 ,<strong>and</strong> X 3 ¼ PO 3 4with p X = 0 <strong>and</strong> n X = 3. In terms of ionic concentrationsin the bulk, each pK X,z can be expressed as c X;z c HpK X;z ¼ log 10 ; ð2Þc X;zþ1 c refwhere c X,z is the concentration of species X in valence state z, c H isthe concentration of protons, <strong>and</strong> c ref = 1 M is a referenceconcentration.Mass conservation within each family implies thatc X ¼ Xp Xz¼n Xc X;z ;where c X equals the total analytical concentration, <strong>and</strong> electroneutralityrequiresXXX p Xz¼n Xzc X;z ¼ 0:Note that this expression is only valid outside the diffuse layer. Finally,the important auto-dissociation reaction of water isH 2 O OH þ H þ ; pK w ¼ 14; ð5Þ<strong>and</strong> bases are formally modeled as deprotonation reactions, e.g. thebase XOH is assigned the reaction [24]X þ þ 1 2 H 2;g X þ H þ ;with the pK a assigned to be 14 to ensure that the <strong>equilibrium</strong> stateis complete dissociation. The addition of a salt is modeled as theaddition of the equivalent amounts of corresponding acid <strong>and</strong> base.For example, the salt KH 2 PO 4 is modeled as the addition of the baseKOH <strong>and</strong> the acid H 3 PO 4 . The actual <strong>chemical</strong>s used in our experiments(see Section 3) are modeled as: (i) phosphoric acid, (ii) dihydrogenfluorescein, (iii) potassium hydroxide, <strong>and</strong> (iv) sodiumhydroxide, as listed in Table 2.From Eqs. (2)–(4) an equation for the concentration of protonsc H can be derived <strong>and</strong> solved through numerical iteration usingthe Matlab script developed in the group of Santiago [24]. Consequently,knowing the pH value a priori, the ionic concentrationsc X,z can be calculated directly. This enables us to find the bulkð3Þð4Þð6ÞTable 2List of <strong>chemical</strong> families X used in this work, including formulae, valences z,<strong>equilibrium</strong> <strong>constants</strong> pK X,z , diffusion <strong>constants</strong> D X,z , <strong>and</strong> electrophoretic mobilitiesl X,z . For z > 0 <strong>and</strong> z < 0 the pK X,z value pertains to the reaction z z 1 <strong>and</strong> z z +1,respectively.X Formula zapK X,z D b X;z (10 9 m 2 /s) l b X;z (10 9 T 1 )Phosphoricacid H 3 PO 4 01 2.15 0.959 37.32 7.21 0.759 59.13 12.33 0.824 96.2Fluoresein C 20 H 12 O 5 1 2.22 c 0.57 d 22.0 d01 4.34 c 0.64 e 25.0 e2 6.68 c 0.502 e 39.5 ePotassiumhydroxide KOH 1 14.0 1.96 76.20Sodiumhydroxide NaOH 1 14.0 1.33 51.90Water H 2 O 0 9.311 f 362.4 f1 14.0 5.273 f 205.2 fSilanol SiOH 1 1.9 g01 6.8 gIon pair SiOK 01 0.06 gaFor acids pK a values are at infinite dilution <strong>and</strong> at 25 °C from Ref. [24] unlessotherwise stated.b D X,z values <strong>and</strong> l X,z values at infinite dilution at 25°C from Ref. [25] unlessotherwise stated.c pK a values at infinite dilution <strong>and</strong> at 25 °C from Ref. [26].d Estimate.el X,z values from Ref. [24] with D X,z values calculated from these usingD X,z = l X,z k B T/(ze).fHere z = 0 represents H + <strong>and</strong> z = 1 represents OH .g For bare silica: SiOH [27,28] <strong>and</strong> SiOK [23].concentration of protons B s required for the titration from the initialpH in the bulk pH b to pH pzc asB s ¼ X XX p z c pzcX;zz¼n Xc b X;z: ð7ÞThis quantity is necessary for relating the experimentally observedcapillary filling length ratios to the model.Finally, the bulk electrolyte is characterized by the ionicstrength I <strong>and</strong> the electrical conductivity r el ,I ¼ 1 2XXr el ¼ e X XX p Xz¼n Xz 2 c X;z ;X p Xz¼n Xzl X;zn X;z ;ð8aÞð8bÞwhere n X,z =10 3 Lm 3 N A c X,z is the bulk ion number concentration(m 3 ), N A being the Avogadro constant. Parameter values used inour model are listed in Table 2.2.3. <strong>Surface</strong> chemistryThe equations for the surface chemistry involve surface reactions,surface sites, site densities, <strong>and</strong> surface <strong>equilibrium</strong> <strong>constants</strong>.Here we summarize the well established surface <strong>chemical</strong><strong>equilibrium</strong> model involving singly coordinated surface silanolsites [29,30,20,21]SiOH þ 2 SiOH þ Hþ 0 ; pK þ; ð9aÞSiOH SiO þ H þ 0; pK ; ð9bÞwhere SiOH þ 2, SiOH, <strong>and</strong> SiO are the protonated, neutral, <strong>and</strong>deprotonated surface hydroxyl groups, H þ 0is a proton in solution
304 M.B. Andersen et al. / Journal of Colloid <strong>and</strong> Interface Science 353 (2011) 301–310at the 0-plane, <strong>and</strong> pK ± the <strong>equilibrium</strong> <strong>constants</strong>, which for baresilica are pK + = 1.9 [27] <strong>and</strong> pK = 6.8 ± 0.2 [28]. The adsorptionof cations onto negative surface hydroxyl groups can be describedby a similar <strong>equilibrium</strong> reaction [30,20,21]SiO þ K þ b SiOK; pK K; ð10Þwhere K þ bis the cation in solution at the b-plane <strong>and</strong> wherepK K = 0.06 ± 0.30 [23]. Note that SiOK is an ion pair, giving riseto one negative charge (SiO ) in the 0-plane <strong>and</strong> one positive charge(K + ) in the b-plane. The point of zero charge pH pzc used for the evaluationof B s in Eq. (7) is then given aspH pzc ¼ 1 2 ðpK þ þ pK Þ:ð11ÞThe appearance of pK + in this relation implies, together with Eq. (7),that we must keep Eq. (9a), a reaction which under normal conditionscan be neglected [31]. The <strong>equilibrium</strong> equations for Eqs.(9a), (9b) <strong>and</strong> (10) are!C SiOH c H;0pK þ ¼ log 10 ; ð12ÞC SiOHþc ref2 C SiO c H;0pK ¼ log 10 ; ð13ÞC SiOH c ref C K c refpK K ¼ log 10 ; ð14ÞC SiO c K;bwhere C SiOH ; C SiOHþ , <strong>and</strong> C SiO are the site densities of the neutral,2positive, <strong>and</strong> negative surface silanol groups, respectively. C K isthe site density of ion pairs of a negative surface site <strong>and</strong> a cation,<strong>and</strong> c H,0 <strong>and</strong> c K,b are the concentrations of protons <strong>and</strong> cations atthe 0- <strong>and</strong> b-plane, respectively. The total available density of sitesis constant, <strong>and</strong> for silica surfaces reported to be C tot = 4.6 10 18m 2 [32]. In our model C tot isC tot ¼ C SiOH þ C SiOþ C SiOHþ þ C K :2Silane coating is modeled by decreasing C tot , see Section 5.2.4. Electrical equations <strong>and</strong> bulk/surface couplingð13ÞThe bulk <strong>and</strong> surface are coupled through equations involvingelectrical potentials, ionic concentrations, surface charge densities,<strong>and</strong> surface capacitances. For the two inner layers the equationsrelating surface charge densities to site densities arer 0 ¼ eðC SiOHþ C SiO C K Þ; ð14aÞ2r b ¼ eC K ;ð14bÞwhereas the surface charge density r d of the diffuse layer is linkedto / d through Grahame’s equation [33]r d ¼" X p #1ze/ dkn X;z e B T1z¼n Xsgnð/ d Þ 2e r e 0 k B T X X2: ð15ÞDue to electroneutrality the surface charge densities are related bythe constraintr 0 þ r b þ r d ¼ 0:ð16ÞAssuming charge-in<strong>dependent</strong> dielectric permittivities <strong>and</strong> no freecharges in between the surface layers, the electric displacementfield between the surface planes can be found using Gauss’s law.Integrating this from the 0- to the b-plane <strong>and</strong> from the b- to thed-plane yields,/ b / 0 ¼ r 0;C 1/ d / b ¼ r d;C 2ð17aÞð17bÞwhere C 1 is the inner <strong>and</strong> C 2 the outer layer capacitance (F m 2 ),which are important surface <strong>dependent</strong> parameters in our model.These capacitances are coupled in series <strong>and</strong> relate to the Sternlayercapacitance C s as 1/C s =1/C 1 +1/C 2 .Using the dilute assumption to neglect higher order effects, theelectro<strong>chemical</strong> potential consists of a purely entropic <strong>and</strong> a purelyelectric term, leading to Boltzmann distributed concentrations. Theproton (cation) concentration c H,0 (c K,b ) at the 0-plane (b-plane)<strong>and</strong> in the bulk c H (c K ) are thus related by e/c H;0 ¼ c H exp 0; ð18aÞc K;b ¼ c K expk B Te/ b: ð18bÞk B TFor use in the subsequent numerical fitting we combine Eqs. (12)–(18) to obtainC K ¼C tot þ r de1 þ c H;0c K;b10 pK þ 2 c refc H;0C SiOH ¼ C tot þ r de1 þ 2 c refC SiOHþ ¼ C SiO2C K ; ð19aÞ10 pK K; ð19bÞpKc H;010r de :ð19cÞEqs. (1)–(19) define our model, which can be characterized as a triplelayer version of the Gouy–Chapman–Stern model. A list summarizingthe input <strong>and</strong> output parameters of the model is given inTable 1.3. Materials <strong>and</strong> methods3.1. ChemicalsThe ionic solutions used in our experiments were potassiumphosphate (KH 2 PO 4 ) based solutions with pK a = 7.21 (Fisher ScientificP285-500). Buffer concentrations of 10, 30, 50, 100, <strong>and</strong>383 mM were prepared by mixing KH 2 PO 4 powder with deionized(DI) water <strong>and</strong> titrated to the desired pH value using 1 M KOH. Thefluorescent analytes used in our experiments were 0.01 mM pHsensitivesodium fluorescein (Riedel-de Haen) <strong>and</strong> 0.01 mM pHinsensitiveAlexa Fluor 488 (Invitrogen). Prior to use, bulk pH<strong>and</strong> conductivities were measured (Oakto, Inc) <strong>and</strong> all solutionswere filtered using 0.2 lm PTFE syringe filters (Nalgene). Solutionswere stored at 4 °C covered by aluminum foil to prevent contamination<strong>and</strong> photo bleaching. Directly prior to experiments, bufferswere heated to ambient room temperature <strong>and</strong> re-mixed with avortexer (Dencille Scientific Inc.). These precautions ensured thatboth the fluorescent dye maintained constant emission properties<strong>and</strong> the solutions were well preserved.3.2. Design <strong>and</strong> fabrication of silica nanochannelsThe design of the nanochannels followed that of Tas et al. [17]<strong>and</strong> Persson et al. [34]. Nanochannels were fabricated usingfused-silica wafers at the UCSB nanofabrication facility with conventionalMEMS processing techniques [14] based on mask designsets from DTU Nanotech [34]. The design of the channels consistedof pairwise parallel inlet/outlet microwells, each 2 mm 5mmrounded with 5-mm-diameter caps <strong>and</strong> etched to a depth of1.6 lm. The pairs of reservoir wells were connected by 12 parallelnanochannels of length L = 5 cm, with etched ruler markings inincrements of 100 lm. Widths w varied from 5 to 40 lm, withdepths h on different chips of either 115, 145, or 195 nm (within± 3 nm). Fig. 2b shows the inlet of a nanochannel during capillaryfilling (see Supporting information Sec. S1).
M.B. Andersen et al. / Journal of Colloid <strong>and</strong> Interface Science 353 (2011) 301–310 305(a)(b)(d)The devices to be coated were dried on a hotplate at 150 °C for30 min, after which they were filled using capillary forces with asolution of 0.1 M cyanosilane in 0.2 lm filtered acetonitrile (FisherScientific). The filled nanochannels were then EO-flushed with thecyanosilane solution for approximately 30 min. The whole devicewas then incubated in cyanosilane solution overnight (12 h) toallow the silane groups to attached themselves to the channelwalls (see Supporting information Sec. S4). After this surface modificationwas completed, the devices were rinsed with copiousamounts of filtered ethanol, EO-flushed with pure acetonitrile for1 h, <strong>and</strong> EO-flushed with DI water for approximately 30 min untilthe electrical current stabilized. The coated channels were storedwet in filtered ethanol to preserve the coating <strong>and</strong> prevent degradation[37].3.4. <strong>Surface</strong> characterization(c)Fig. 2. (a) Block diagram showing the experimental setup (detailed in Section 4.1)comprising of sample, optics, mercury lamp, <strong>and</strong> EMCCD camera. (b) Image at thebeginning of the capillary filling of the 30 mM KH 2 PO 4 buffer seeded with 0.01 mMfluorescein into three of the twelve parallel nanochannels. Four regions can be seen:(i) inlet well with fluorescent buffer, (ii) fluorescent buffer in nanochannel region oflength L fl , (iii) dark buffer in nanochannel region of length L d , (iv) black air-filledpart of the nanochannel. (c) A schematic side view of one of the nanochannels ofheight h from panel (b) defining the lengths L fl <strong>and</strong> L d as well as the correspondingpH conditions; pH b in the fluorescent regions (i) <strong>and</strong> (ii), <strong>and</strong> pH pzc in the dark pointof zero charge region (iii). (d) Experimental capillary filling data for a barenanochannel showing the meniscus position L fl + L d (points <strong>and</strong> dashed line) <strong>and</strong> L fl(points <strong>and</strong> full line) versus the square root of time t (see Section 4.3). The first datapoint (black square) corresponds to the image in panel (b).3.3. <strong>Surface</strong> coating <strong>and</strong> cleaningTo change the surface properties <strong>and</strong> characteristics of the silicananochannels, we chose to coat the channel after fabrication with aliquid-phase silane. 3-Cyanopropyldimethylchlorosilane (cyanosilane,Gelest Inc.) was chosen because it has been shown to forma fully wettable, slightly hydrophilic, stable lipid monolayer onglass [35], <strong>and</strong> was straightforward to coat after bonding withoutchanging any of the channel dimensions or introducing any variabilityin the channel fabrication process. The coating process isknown to replace 25% of negative charge sites with a neutral cyanosilanegroup [36] (see Fig. 1).Immediately after fabrication <strong>and</strong> dicing, all devices were precleanedusing 0.2 lm-filtered DI water driven through the nanochannelsby electro-osmosis (EO). Platinum wires, inserted intothe inlet/outlet microwells <strong>and</strong> fixed by scotch tape, served asEO-electrodes. The EO-flushing was powered by an electric fieldof 5000 V/m delivered by a source meter (Keithley 2410, samplingfrequency of 100/min), <strong>and</strong> the associated electric current wasmonitored using a high impedance electrometer (Keithley 6517,sampling frequency of 400/min) controlled using custom LabVIEWsoftware <strong>and</strong> analyzed with Matlab.The initial DI-water EO-flushing ran for 60 min, while monitoringthat the current remained stable at the range of 1 pA, after ashort transient period of 1–2 min. The EO-flushing was continuedusing 0.1 M KOH for 15 min, <strong>and</strong> finally proceeded by a second60 min EO-flushing with DI water. At this point, the deviceswere either stored in DI water or treated with the cyanosilanecoating.The roughness of both uncoated <strong>and</strong> coated channel walls werecharacterized using st<strong>and</strong>ard AFM techniques <strong>and</strong> found to beapproximately 0.3 nm <strong>and</strong> 0.7 nm, respectively (see Supportinginformation Sec. S1). Contact angle measurements were experimentallyfound by depositing 10 lL of DI water onto each surface,<strong>and</strong> imaging the water droplets at the contact interface (see Supportinginformation Sec. S1). The contact angle of the uncoated<strong>and</strong> coated surfaces was found to be 32° <strong>and</strong> 75°, respectively, ingood agreement with previously reported values [38,39]. An interferometer(Wyko NT1100) was used to image the microwell <strong>and</strong>entrance to the nanochannels (see Supporting information Sec.S1). Further characterization of the surfaces was performed usingthe current monitoring method, described in more detail in Section4.2.4. Experimental setup <strong>and</strong> procedure4.1. Optical <strong>and</strong> electrical setupRecordings of the propagating buffer in our filling experimentswere performed using an inverted epifluorescent microscope(Olympus IX70) <strong>and</strong> automated stage (Prior Proscan II) controlledvia custom LabVIEW software (LabVIEW V8.6). Images were capturedusing a back illuminated EMCCD camera (Andor iXon +) witha 200 ms exposure time using a 10 objective (Olympus UPlanFL10 2, NA = 0.3) with a 0.5 demagnifying lens (U-TV0.5xC-3) asseen in Fig. 2a. A stationary halogen lamp was used to illuminatethe fluid front, whereas an aligned <strong>and</strong> focused mercury arc lamp(Olympus U-RFL-T) filtered with a 488 nm excitation <strong>and</strong> 532 nmemission FITC filter cube (Chroma Technology 31001FITC/RSGFP/Fluo 3/DiO Acradine Orange(+DNA)) was used to illuminate thefluorescent front. Electric fields for channel cleaning <strong>and</strong> buffercharacterization were generated across the nanofluidic channelsby a Keithley multimeter (Model 2410), <strong>and</strong> currents were recordedin series with a Keithley electrometer (Model 6517) connectedto platinum wire electrodes placed within each fluidreservoir of the device. A schematic of this electrical setup is shownin the inset of Fig. 3a (see Supporting information Sec. S1).4.2. Current monitoringBoth the conductivity <strong>and</strong> the f potential were measured bycurrent monitoring techniques following Ref. [40]. One reservoirwas initially filled with an electrolyte of concentration 0.9 c * ,where c * was a predefined target concentration. A voltage dropwas applied between the inlet <strong>and</strong> outlet well to drive an EO flow.After about 15 min the current was stabilized, indicating completefilling in the nanochannel by the 0.9 c * electrolyte. Then all
306 M.B. Andersen et al. / Journal of Colloid <strong>and</strong> Interface Science 353 (2011) 301–310(a)Table 3Calculated ionic strength I from Eq. (8a), measured f potential for bare <strong>and</strong> coatedchannels, <strong>and</strong> measured electrical conductivity r measeldivided by I. From the fit in Fig. 4we find r measel=I ¼ 9:1 Sm 1 M 1 in the limit I ? 0, while using Eq. (8b) in the samelimit gives r calcel=I ¼ 9:36 S m 1 M 1 , deviating less than 3%.I (M) 0.024 0.055 0.103 0.186 0.823f bare (mV) 47 48 32 31 12f coat (mV) 29 24 21 16 7r measel =I ((S/m)/M) 7.083 7.909 5.728 5.000 5.033(b)We also characterized the electrical properties of the system bymeasuring the conductivity r el versus ionic strength I, see Table 3.This was done using both a conductivity meter <strong>and</strong> simultaneouscurrent <strong>and</strong> voltage measurements. The Kohlrausch plot in Fig. 4of r el /I versus I shows good agreement (3%) between the measuredconductivity extrapolated to zero ionic strength <strong>and</strong> the theoreticaldilute limit.4.3. Capillary filling experiments(c)Fig. 3. (a) Raw data showing electrical current I el versus time t in an EO-flowmeasurement. Initial buffer concentration is 9 mM. At t = 80 s the buffer in the inletwell is replaced by a 10 mM buffer. At t = 340 s the 10 mM solution has filled thechannel completely. The f potential is determined by Eq. (20) with Dt = 340 80 s.Inset shows schematic of the experimental setup including the sourcemeter(Keithley 2410) <strong>and</strong> the electrometer (Keithley 6517), see Section 4.2. (b) Lin-logplot of measured f potential for bare (blue empty circles) <strong>and</strong> coated (red filledsquares) as function of ionic strength I. Curves are theoretical predictions of thediffuse layer potential / d for bare (blue dashed) <strong>and</strong> coated (red full) channels forcase 1, Table 5, where C 2 = 0.2 F m 2 . (c) As panel (b) except that the theoreticalpredictions are for case 2, Table 5, where the values of C 2 are 0.8 F m 2 <strong>and</strong> 0.15 Fm 2 for bare <strong>and</strong> coated channels, respectively. Note the improved agreementbetween theory <strong>and</strong> experiment going from case 1 to case 2. (For interpretation ofthe references to colour in this figure legend, the reader is referred to the webversion of this article.)In our experiments, we filled both bare <strong>and</strong> cyanosilane-coatedsilica nanochannels with KH 2 PO 4 buffers of concentrations in therange 10–383 mM mixed with a 0.01 mM tracer dye, either pHsensitivefluorescein or pH-insensitive Alexa Fluor 488 (see Section3.1). During filling, the advancing electrolyte meniscus (L fl + L d ) <strong>and</strong>the fluorescence front (L fl ) were recorded optically as shown inFig. 2 using the equipment described in Section 4.1. A list of theperformed experiments is given in Table 4, <strong>and</strong> the exact procedureis detailed below.A given nanochannel was removed from its wet storage <strong>and</strong>optically examined for defects <strong>and</strong> clogs. Next we flushed the channelusing EO-flow for 30 min until the current stabilized to around1 pA, which is a typical indication that the channel is not contaminated.All the liquid was evaporated from the channel by placingthe chip on a hotplate at 300 °C for 30 min before it was placedon the automated microscope stage where it was aligned <strong>and</strong>focused relative to the EMCCD camera. We then pipetted the buffersolution into the inlet microwell <strong>and</strong> recorded videos of the propagationof the meniscus using the experimental setup described inSection 4.1. To capture the entire filling process, which lasts lessthan 5 min, the automated stage was centered to five differentpositions <strong>and</strong> the filling fronts were recorded as they passed thefield of view. An experimental video is provided in the Supportinginformation. Fig. 2d shows a typical experimental data setelectrolyte was removed from the inlet well <strong>and</strong> replaced withelectrolyte of concentration c * . The current was monitored overtime, with typical results shown in Fig. 3a. Measurements wereperformed for every concentration c * used in the capillary fillingexperiments (10, 30, 50, 100, <strong>and</strong> 383 mM) at two different electricfield strengths (6 kV/m <strong>and</strong> 12 kV/m). Voltage <strong>and</strong> current weresupplied <strong>and</strong> monitored using the equipment described in Section3.3. For determination of the f potential, the filling speed L/Dt is setequal to the Helmholtz–Smoluchowski velocity (ef/g)DV/L [41],gL2f ¼eDVDt :ð20ÞTable 3, Fig. 3b <strong>and</strong> c shows measured f potential for both bare <strong>and</strong>coated channels of length L at all concentrations used in this study.Also shown are theoretically fitted curves for / d described inSection 5.Fig. 4. Kohlrauschp ffiffiplot: the measured electrical conductivity r el divided by ionicstrength I versus I . The highest ionic strength data point clearly deviates from theKohlrausch law <strong>and</strong> has thus been excluded from the fit. Extrapolation of the fit toI = 0 deviates only 3% from the theoretically predicted value at infinite dilution(black circle), see Eq. (8b).
M.B. Andersen et al. / Journal of Colloid <strong>and</strong> Interface Science 353 (2011) 301–310 307Table 4List of the 43 capillary filling experiments, specifying the phosphate buffer concentrationc buf in mM, the pH of the buffer, type of the 0.01 mM dye (F: fluorescein ofcharge 2, A: Alexa Fluor of charge 0), type of surface (B: bare, C: cyanosilane coated),<strong>and</strong> channel height h.# c buf pH Dye Surf h (nm)1–3 10 7.2 F B 145, 145, 1454–6 30 7.1 F B 124, 124, 1157–12 50 7.3 F B 142, 142, 145, 145, 142, 14213–19 100 7.2 F B 145, 145, 145, 145, 142, 142, 14220–23 383 7.2 F B 115, 115, 115, 11524–26 10 7.2 F C 142, 142, 14527–32 30 7.1 F C 124, 124, 115, 124, 124, 11533–35 50 7.3 F C 142, 142, 14236–38 100 7.2 F C 195, 115, 11539 383 7.2 F C 11540 10 7.2 A B 14241 100 7.2 A B 14242 10 7.2 A C 11543 100 7.2 A C 115demonstrating that both the fluoresent signal <strong>and</strong> the meniscusfollows the Washburn relation Eq. (21). Once the channel was completelyfilled, we EO-flushed the channel with DI water until thecurrent decreased to a stable level of about 1 pA. The channelwas then stored wet.4.4. Extraction of parameters by capillary fillingThe filling dynamics of cylindrical capillaries was first describedby Washburn [42] <strong>and</strong> later applied to rectangular nanochannels oflow height-to-width aspect ratio by others [17,34]. For the lattersystems, relevant to this study, the time-<strong>dependent</strong> positionL(t)=L fl + L d of the electrolyte meniscus issffiffiffiffiffiffiffiffiffiffiffiffiffiffiffiffiffiffiffiffiffich cos hLðtÞ ¼L fl þ L d ¼t; ð21Þ3gwhere c is the electrolyte/air surface tension, h the contact angle, hthe height of the nanochannel, <strong>and</strong> g the viscosity of the electrolyte.As the electrolyte containing the tracer dye fluorescein fills thenanochannel there is a region in the front of the liquid columnwithout fluorescent signal, as shown in Fig. 2. Fluorescein is apH-sensitive dye <strong>and</strong> therefore one might speculate that thequenching is due to a change in pH in this zone stemming fromdeprotonation of the silica surface silanol sites as described inRef. [9]. This assumption is further corroborated by the fact thatnone of our control experiments containing pH-insensitive AlexaFluor dye showed a region without fluorescent signal (data notshown). To evaluate the surface properties using the observed darkzone we assume that: (i) the pH is constant within each of the tworegions in the liquid column, (ii) the pH in the dark region equalsthe value pH pzc of the point of zero charge, <strong>and</strong> (iii) the pH in thefluorescent region is that of the bulk pH b . With these assumptionsone can estimate the amount of protons N adsHnecessary to bring theþvolume of buffer in the dark region from pH b to pH pzc . This amountmust equal the volume whL d of the dark region multiplied by theconcentration of protons B s necessary to titrate from pH b to pH pzcN adsH þ ¼ whL dB s ; ð22Þwhere B s is calculated using the theory described in Section 2.2.Note that ionic concentrations may not be constant across the nanochanneldue to the influence of the electrical double layer, but forour high concentration systems the change in ionic concentrationover the entire volume of the channel does not change by more than5% from the bulk.The release of protons from the channel walls can be estimatedusing the assumption that all the wall deprotonation occurs at theinterface between the dark <strong>and</strong> fluorescent regions. It then followsthat by multiplying the amount per area ðC HþÞ of protons releasedby the channel wall, by the surface area in the fluorescent region ofthe channel, the amount of protons released into the dark region isN relH þ ¼ 2ðw þ hÞL flC Hþ: ð23ÞEquating N adsH þ <strong>and</strong> NrelH þ yields C þH in terms of the experimentallymeasured lengths of the fluorescent <strong>and</strong> dark zonesh LC dHþ ¼ B s :2ð1 þ h=wÞ L flð24ÞAssuming that all the sites on the channel wall prior to contact withthe electrolyte are SiOH, the amount of deprotonation per area is givenby the surface charge density of the innermost layer asC Hþ ¼ r 0 =e; e being the elementary charge. Combining this withEq. (24) we obtain the following relation between the experimentallyobserved length ratio <strong>and</strong> the theoretically calculated surfacecharge density,L dL fl¼2ð1 þ h=wÞr 0 :eB s h4.5. Numerical fitting procedureð25ÞWe use the experimentally observed length ratios L d /L fl to fit C 1<strong>and</strong> pK + . Below we outline the fitting procedure implemented inMatlab (see Supporting information Sec. S3) [43]. The number ofin<strong>dependent</strong> variables is reduced to two <strong>and</strong> in the actual computationthe equations are non-dimensionalized to obtain highernumerical accuracy.1. Calculate the electrolyte ionic concentrations c X,z <strong>and</strong> the ionicstrength I for the observed L d /L fl -ratio for each of the five experimentalconditions {c buf } i =1,...,5 of Table 4 using the bulk theoryin Section 2.2.2. Use the output from the bulk theory as input for the surfacechemistry <strong>and</strong> bulk/surface coupling equations from Sections2.3 <strong>and</strong> 2.4 as outlined below. Repeat until convergence.(a) Estimate <strong>and</strong> update the fitting parameters C 1 <strong>and</strong> pK + .(b) Update pH pzc using Eq. (11).(c) Update {B s } i =1,...,5 from Eq. (7).(d) For each L d /L fl -ratio give initial guess for / 0 <strong>and</strong> / d <strong>and</strong> solvethe surface equation system:i. r d from Eq. (15).ii. / b from Eq. (17b).iii. c H,0 <strong>and</strong> c K,b from Eqs. (18).iv. C K from Eq. (19a).v. r b <strong>and</strong> C SiOH from Eqs. (14b) <strong>and</strong> (19b).vi. r 0 <strong>and</strong> C SiO from Eqs. (16) <strong>and</strong> (13).vii. C SiOHþ from Eq. (19c).2viii. Check if Eqs. (12) <strong>and</strong> (17a) are converged <strong>and</strong> update / 0<strong>and</strong> / d accordingly.(e) Output obtained upon convergence.(f) Use Eq. (25) to update the calculated length ratios {L d /L fl } i =1,...,5 . Compare these calculated length ratios againstthose measured. If not converged go back to 2.3. Analyze parameters <strong>and</strong> produce goodness-of-fit values R 2 ,plots etc.5. ResultsFig. 5 shows length ratio L d /L fl as function of ionic strength Imeasured (symbols) <strong>and</strong> fitted theoretically (curves) for baresurfaces (blue, open symbols <strong>and</strong> dashed curve) <strong>and</strong> for coated
308 M.B. Andersen et al. / Journal of Colloid <strong>and</strong> Interface Science 353 (2011) 301–310(a)(b)Fig. 5. Plot of the experimentally measured (symbols) <strong>and</strong> theoretically fitted(curves) length ratio L d /L fl as function of ionic strength I for the bare surfaces (blue,open symbols <strong>and</strong> dashed curve) <strong>and</strong> coated surfaces (red, filled symbols <strong>and</strong> fullcurve) with parameters corresponding to case 2 as given in Table 5. (Forinterpretation of the references to colour in this figure legend, the reader isreferred to the web version of this article.)surfaces (red, filled symbols <strong>and</strong> full curve). Here, the parameterskept constant are pK = 6.8 [28] <strong>and</strong> pK K = 0.06 [23]. For thecoated channels we assume that 25% of the surface sites have acyanosilane molecule attached [36], which reduces the surface sitedensity C tot from the bare value of 4.6 nm 2 to 3.45 nm 2 . In theliterature the value of C 2 is often taken to be C 2 = 0.2 F m 2 [23](denoted case 1). This value of C 2 did not explain the observedtrends for different surfaces, <strong>and</strong> in fact, no other single fixed valuecould do so. We therefore allow C 2 to be surface <strong>dependent</strong>. Optimizationled to the values C bare2¼ 0:8 Fm 2 <strong>and</strong> C coated2¼0:15 F m 2 which we denote case 2 in the following discussion.Parameters that are fitted are C 1 <strong>and</strong> pK + , <strong>and</strong> a list of parametervalues for cases 1 <strong>and</strong> 2 are summarized in Table 5.In both cases pK ,pK K , <strong>and</strong> C tot are parameters taken from literature[28,23,32]. In case 1, we fix the outer capacitance C 2 forboth the bare <strong>and</strong> coated surfaces to the value 0.2 F m 2 oftenquoted in literature [20,22,44,23]. Choosing this value of constantC 2 led to fitted <strong>and</strong> calculated parameters with a decent R 2 value(see Table 5) but showed poor agreement with f potential experimentaldata. In fact, Fig. 3b shows theoretical trends which are exactlyopposite of measured data, where the coated channels areestimated theoretically to have higher f potential values than thebare, a trend that is not observed experimentally. In case 2 we remedythis discrepancy by optimizing C 2 to not only match the L d /L flexperimental values in Fig. 5, but also the f potential values inFig. 3c. Here, we note the improved match between the calculated/ d <strong>and</strong> measured f potential for both bare <strong>and</strong> coated data. Figs. 6<strong>and</strong> 7 show potentials <strong>and</strong> surface charge densities for both cases.However, given the better fit of case 2 the remainder of ourdiscussion is focused on this case.Fig. 6. Case 1: calculated potentials / <strong>and</strong> surface charge densities r plotted versusionic strength I for bare channels (open symbols <strong>and</strong> dashed curves) <strong>and</strong> coatedchannels (filled symbols <strong>and</strong> full curves). Each point represents the average overchannel heights (see Table 4) while curves are for fixed h = 135 nm. In this case 1C 2 = 0.2 F m 2 , while other parameters are given in Table 5. (a) Calculated / 0 (bluecircles), / b (red triangles), <strong>and</strong> / d (green squares). The arrows indicate shifting ofcurves going from bare to coated channels. (b) Calculated r 0 (blue circles), r b (redtriangles), <strong>and</strong> r d (green squares). The inset is a zoom on the diffuse layer surfacecharge density r d . (For interpretation of the references to colour in this figurelegend, the reader is referred to the web version of this article.)(a)(b)Table 5Two cases of setting the outer Stern capacitance C 2 . Case 1: using the literature value0.20 F m 2 for both bare (B) <strong>and</strong> coated (C) surfaces. Case 2: changing C 2 to obtainmatch between calculated / d <strong>and</strong> measured f, see panel (b) <strong>and</strong> (c) in Fig. 3. Alsoshown are fitted <strong>and</strong> calculated parameters from Fig. 5, while other set parametersare pK = 6.8, pK K = 0.06, <strong>and</strong> C tot = 4.6 nm 2 (bare) <strong>and</strong> C tot = 3.45 nm 2 (coated).Case Set C 2 (F/m 2 ) Fitted CalculatedC 1 (F/m 2 ) pK + R 2 C s (F/m 2 ) pH pzc1 B 0.20 0.69 1.03 0.81 0.16 2.91 C 0.20 15.47 0.54 0.40 0.20 3.12 B 0.80 0.77 1.61 0.80 0.39 2.62 C 0.15 13.47 0.29 0.40 0.15 3.3Fig. 7. Case 2: same as in Fig. 6 except that the parameters are: C 2 = 0.80 F m 2(bare) <strong>and</strong> C 2 = 0.15 F m 2 (coated) as listed in Table 5.Fig. 7a shows the surface potential / 0 , the metal layer potential/ b , <strong>and</strong> the diffuse layer potential / d for the bare <strong>and</strong> coated channelsversus ionic strength as sketched in Fig. 1. As expected, the
M.B. Andersen et al. / Journal of Colloid <strong>and</strong> Interface Science 353 (2011) 301–310 309values of the potentials increase from the surface layer to the metallayer to the diffuse layer. Next, we note that the metal potential / bis much lower for coated channels than for bare channels, whilethe surface potential / 0 <strong>and</strong> the diffuse potential / d remain almostthe same. In all cases, we note that the metal <strong>and</strong> diffuse potentialsincrease with ionic strength whereas the surface potential for thebare channel decreases slightly.For cases 1 <strong>and</strong> 2, respectively, Figs. 6 <strong>and</strong> 7b show the surfacecharge densities at the surface, metal <strong>and</strong> diffuse layer. Here, wenote that the charge density at the surface decreases with ionicstrength, whereas the charge density at the metal layer increaseswith ionic strength, both more pronounced for the coated surfacethan for the bare.By comparing Figs. 6 <strong>and</strong> 7 we note that changes in C 2 primarilyaffect the diffuse layer potential / d <strong>and</strong> charge density r d . Differentvalues of C 2 for the bare <strong>and</strong> coated surfaces will therefore not affectmuch the final outcome of the fitting procedure in terms of theother variables such as the surface charge density r 0 . This is thereason that the R 2 is essentially the same for both cases as seenin Table 5. These observations speak in favor of using the valuesof C 2 in case 2 in Table 5.6. DiscussionThere is a clear trend of the capillary filling length ratio L d /L fldecreasing with increasing ionic strength. We can explain thisthrough Eq. (25), where we describe the length ratio as a functionof the surface charge density r 0 <strong>and</strong> the proton concentration B sneeded to lower the pH of the buffer front to pH pzc . Since thelength ratio decreases we conclude that B s increases faster thanr 0 decreases. B s is mainly influenced by the pH pzc =(pK + +pK )/2<strong>and</strong> thus by pK + .To achieve the most reliable fit with the data, we investigatedthe influence of C 1 , C 2 ,pK K ,pK + ,pK , <strong>and</strong> C tot by varying eachparameter individually around some chosen reference value (seeSupporting information Sec. S5). Here we summarize the observedsensitivity of each parameter. First, changing C 1 raises <strong>and</strong> lowersthe values of L d /L fl without significantly affecting the shape of thecurve. Given the fact that the bare <strong>and</strong> coated experimental datacurves follow the same shape, this strongly suggests that C 1changes with surface type. Next we notice that C 2 ,pK K ,pK , <strong>and</strong>C tot have a negligible effect on the L d /L fl curve, which indicates thatthese parameters are most likely constant <strong>and</strong> can be determinedfrom literature values. However, as mentioned in the previous section,we notice that varying C 2 has a strong influence on the f potential,which is consistent with the assumption that it only affects/ d <strong>and</strong> r d . Finally, we note that varying pK + has a strong influenceon the value of L d /L fl at low concentrations but very little effect athigh concentrations. Indeed, this is what we observe in our experimentaldata <strong>and</strong> therefore this suggests that pK + must be variedwith surface composition. Furthermore, because pK + couples intoB s through pH pzc it should have an influence on L d /L fl . In conclusion,C 1 <strong>and</strong> pK + are our obvious choices for parameters to be fit.The literature value of pK + = 1.9 [27] for the bare silica surfaceis close to the value of 1.61 theoretically determined for the barechannel when using the case 2 capacitance value of C 2 = 0.80 Fm 2 . For case 1 (C 2 = 0.20 F m 2 ) the model calculates a higher value(pK + = 1.03) which lends further support for case 2. For thecoated channels pK + = 0.54 (case 1) <strong>and</strong> pK + = 0.29 (case 2). Giventhe strong evidence for case 2 parameters we believe thatpK + = 0.29 should be the value used in the future for cyanosilane-coatedsilica surfaces. However, we emphasize that this valueis contingent upon the experimental conditions used in our study.For example, when comparing values of C 1 with Wang et al. [23]we find slightly different values which most likely can be attributedto the fact that we used different electrolytes.Examining the trends seen in Fig. 7 we note that the surface potential/ 0 varies less than 10% over the range of ionic strength usedin this study, which validates a constant surface potential model inboth bare <strong>and</strong> coated channels given our experimental conditions.Next, we note that the metal potential / b <strong>and</strong> diffuse layer potential/ d significantly increase with increasing ionic strength, whichis consistent with trends reported in literature [23]. Consistentwith case 2, we hypothesize that the amount of metal ions thatcan adsorb onto the surface is highly <strong>dependent</strong> on the compositionof the surface. Moreover, because C bare1 0:7 Fm 2 is muchlower than C coated1 14 F m 2 this hypothesis is further justifiedsince / barebis much higher than / coatedb.Finally, the surface charge density r 0 of the coated channels decreasesmore rapidly than that of the bare channels also due to thefact that C 1 is much higher for the coated channels. This again indicatesthat more metal ions can adsorb to the surface withoutchanging the potential. Because r b = (r 0 + r d ), r b increases withincreasing ionic strength faster in the coated channels than in thebare channels. We note that r d is relatively constant with ionicstrength <strong>and</strong> surface coating providing justification to use theGrahame Eq. (15) to solve for diffuse layer potentials [30]. Usingour optimized values of C 2 , Fig. 3c shows that r d for the bare channelis higher than the coated channel, matching experimentaltrends (data not shown). We note that r d is lower than the60 mC m 2 quoted in literature for fused silica nanochannels [45]but similar to the 25 mC m 2 quoted for amorphous silica nanochannels[46]. Stein et al. [45] used the neutral CH 3 head groupdoctodecyltrichlorosilane as surface coating <strong>and</strong> found a decreasein the surface charge density, consistent with our curves in the insetin Fig. 7b. However, in both Refs. [45,46] aqueous KCl was usedas the electrolyte in contrast to our KH 2 PO 4 , <strong>and</strong> as discussed inRefs. [47,48] the different co-ions may lead to different actual valuesof r d .We can also use our model to examine the surface site densitiesC i . Fig. 8 shows C i for bare (open symbols <strong>and</strong> dashed curves) <strong>and</strong>coated (filled symbols <strong>and</strong> full curves) channels using case 2parameters. The amount of adsorbed cations (K + ) is significantfor the coated channels especially at high ionic strengths whencompared to the bare channels. This is consistent with the resultof C 1 being much higher for the coated channels than for the barechannel. Furthermore, a sensitivity analysis of the effect of C totshows that changing the amount of sites available at the wall doesnot change the results shown in Fig. 7 (see Supporting informationSec. S5). Therefore, our results will be relatively accurate despiteFig. 8. The surface site densities C i for bare channels (open symbols <strong>and</strong> dashedcurves) <strong>and</strong> coated channels (filled symbols <strong>and</strong> full curves) for case 2. The foursurface site densities are C SiOH (blue circles), C SiO (purple diamonds), C SiOHþ (green2triangles), <strong>and</strong> C SiOK (red squares). The insets are magnifications of the low-densitysites C SiO <strong>and</strong> C SiOHþ . (For interpretation of the references to colour in this figure2legend, the reader is referred to the web version of this article.)
310 M.B. Andersen et al. / Journal of Colloid <strong>and</strong> Interface Science 353 (2011) 301–310the experimental uncertainty of C tot after coating withcyanosilane.Throughout our experiments, we have assumed that the flouresceinquenches exactly at pH pzc . This is a reasonable assumptionas flourescein is known to quench at pH values below 5 [49,50],<strong>and</strong> our model predicts pH pzc < 5 in all cases (see Table 5 <strong>and</strong> Supportinginformation Sec. S6).To date, it has been difficult or almost impossible to use a modelto predict experimental data mainly due to difficulties in modelingthe Stern layer [15]. Here, we show that by just changing C 1 , C 2 , <strong>and</strong>pK + while using literature values for all other surface parameters,we can find f potential values that almost exactly match experimentallydetermined values for both bare <strong>and</strong> cyanosilane-coatedsilica nanochannels. We believe our model will be important topredict experimentally observed phenomena, for example, geologicalstudies have shown that silica is known to dissolve in the presenceof an electrolyte [51]. This dissolution process, althoughnegligible in microfluidic systems, may become important at thenanoscale. Therefore, having a model which can predict the changeof channel size with the measured experimental values may proveto be of utility to the field. We are currently pursuing such uses ofthe model.7. ConclusionIn this work, we presented a combined theoretical <strong>and</strong> experimentalanalysis of the solid–liquid interface of fused-silica nanofabricatedchannels with <strong>and</strong> without hydrophilic 3-Cyanopropyldimethlychlorosilane coating. Our theoretical modelcouples <strong>chemical</strong> <strong>equilibrium</strong> theory of both the surface <strong>and</strong> thebulk buffer with a self-consistent extended Gouy–Chapman–Sternmodel of the electro<strong>chemical</strong> triple layer. We use the model tooptimize the surface parameters given both experimental capillaryfilling data <strong>and</strong> electro-osmotic current-monitoring data, which allowsfor analysis of surface parameters both with <strong>and</strong> without theinfluence of applied external fields. Our model shows that theimportant fitting parameters are the capacitance C 1 between thesilica layer <strong>and</strong> the metal ion layer, as well as the pK + constant. Furthermore,we find that changing the capacitance C 2 between themetal ion layer <strong>and</strong> the diffuse layer with surface composition resultsin more accurate fits of experimentally determined f potentialvalues. This model is of value to predict experimentallyobserved phenomena in nanofluidic systems.AcknowledgmentsK.G.H. Janssen is grateful acknowledged for helpful <strong>and</strong> clarifyingdiscussions <strong>and</strong> for sharing data from Ref.[9]. We thank M.B.L.Mikkelsen <strong>and</strong> T. Wynne for help with mask design <strong>and</strong> fabrication.Appendix A. Supplementary materialSupplementary data associated with this article can be found, inthe online version, at doi:10.1016/j.jcis.2010.09.025.References[2] R. Schoch, J. Han, P. Renaud, Rev. Mod. Phys. 80 (2008) 839.[3] W. Sparreboom, A. van den Berg, J.C.T. Eijkel, Nat. Nanotechnol. 4 (2009) 713.[4] L. Bocquet, E. Charlaix, Chem. Soc. Rev. 39 (2010) 1073.[5] M. Napoli, J.C.T. Eijkel, S. Pennathur, Lab Chip 10 (2010) 957.[6] P.M. Biesheuvel, W.B.S. de Lint, J. Colloid Interface Sci. 241 (2001) 422.[7] W.B.S. de Lint, P.M. Biesheuvel, H. Verweij, J. Colloid Interface Sci. 251 (2002)131.[8] N.R. Tas, J.W. Berenschot, P. Mela, H.V. Jansen, M. Elwenspoek, A. van den Berg,Nano Lett. 2 (2002) 1031.[9] K.G.H. Janssen, H.T. Hoang, J. Floris, J. de Vries, N.R. Tas, J.C.T. Eijkel, T.Hankemeier, Anal. Chem. 80 (2008) 8095.[10] H.T. Hoang, I.M. Segers-Nolten, J.W. Berenschot, M.J. de Boer, N.R. Tas, J.Haneveld, M.C. Elwenspoek, J. Micromech. Microeng. 19 (2009) 065017.[11] R.B.H. Veenhuis, E.J. van der Wouden, J.W. van Nieuwkasteele, A. van den Berg,J.C.T. Eijkel, Lab Chip (2009).[12] C.L. Rice, R. Whitehead, J. Phys. Chem. 69 (1965) 4017.[13] S. Pennathur, J.G. Santiago, Anal. Chem. 77 (2005) 6772.[14] S. Pennathur, J.G. Santiago, Anal. Chem. 77 (2005) 6782.[15] M.Z. Bazant, M.S. Kilic, B.D. Storey, A. Ajdari, Adv. Colloid Interface Sci. 152(2009) 48.[16] N.R. Tas, P. Mela, T. Kramer, J.W. Berenschot, A. van den Berg, Nano Lett. 3(2003) 1537.[17] N.R. Tas, J. Haneveld, H.V. Jansen, M. Elwenspoek, A. van den Berg, Appl. Phys.Lett. 85 (2004) 3274.[18] L.H. Thamdrup, F. Persson, H. Bruus, A. Kristensen, H. Flyvbjerg, Appl. Phys.Lett. 91 (2007) 163505.[19] S.H. Behrens, D.G. Grier, J. Chem. Phys. 115 (2001) 6716.[20] J.A. Davis, R.O. James, J.O. Leckie, J. Colloid Interface Sci. 63 (1978) 480.[21] J.A. Davis, J.O. Leckie, J. Colloid Interface Sci. 67 (1978) 90.[22] R. Charmas, W. Piasecki, W. Rudzinski, Langmuir 11 (1995) 3199.[23] M. Wang, A. Revil, J. Colloid Interface Sci. 343 (2010) 381.[24] A. Persat, M.E. Suss, J.G. Santiago, Lab Chip 9 (2009) 2454.[25] D.R. Lide, CRC H<strong>and</strong>book of Chemistry <strong>and</strong> Physics, 90th ed., CRC Press/Taylor<strong>and</strong> Francis, Boca Raton, FL, 2010, (Internet Version 2010).[26] S.A. Smith, W.A. Pretorius, Water SA 28 (2002) 395.[27] T. Hiemstra, W.V. Riemsdijk, G. Bolt, J. Colloid Interface Sci. 133 (1989) 91.[28] P. Schindler, H.R. Kamber, Helv. Chim. Acta 51 (1968) 1781.[29] S. Levine, A.L. Smith, Discuss. Faraday Soc. 52 (1971) 290.[30] D.E. Yates, S. Levine, T.W. Healy, J. Chem. Soc., Faraday Trans. 1 (70) (1974)1807.[31] P.M. Biesheuvel, J. Colloid Interface Sci. 275 (2004) 514.[32] C.G. Armistead, A.J. Tyler, F.H. Hambleton, S.A. Mitchell, J.A. Hockey, J. Phys.Chem. 73 (1969) 3947.[33] D.C. Grahame, Chem. Rev. 41 (1947) 441.[34] F. Persson, L.H. Thamdrup, M.B. Mikkelsen, S.E. Jaarlgard, P. Skafte-Pedersen, H.Bruus, A. Kristensen, Nanotechnology 18 (2007) 245301.[35] R.J. White, E.N. Ervin, T. Yang, X. Chen, S. Daniel, P.S. Cremer, H.S. White, J. Am.Chem. Soc. 129 (2007) 11766.[36] S.J. Oh, S.J. Cho, C.O. Kim, J.W. Park, Langmuir 18 (2002) 1764.[37] T. Driehorst, P. O’Neill, D.K. Fygenson, S. Pennathur, in: Proceedings of theThirteenth International Conference on Miniaturized Systems on MiniaturizedChemical <strong>and</strong> BioChemical Analysis Systems (uTAS2009), Jeju, Korea, 1st–5thNovember, 2009.[38] S. Falipou, J.M. Chovelon, C. Martelet, J. Margonari, D. Cathignol, Sens.Actuators, A 74 (1999) 81.[39] S. Falipou, J. Chovelon, C. Martelet, J. Margonari, D. Cathignol, BioconjugateChem. 10 (1999) 346.[40] A. Sze, D. Erickson, L. Ren, D. Li, J. Colloid Interface Sci. 261 (2003) 402.[41] R.F. Probstein, Physico<strong>chemical</strong> Hydrodynamics: an Introduction, Wiley-Interscience, 1994.[42] E.W. Washburn, Phys. Rev. 17 (1921) 273.[43] The full code can be downloaded at , 2010.[44] J. Lützenkirchen, Environ. Sci. Technol. 32 (1998) 3149.[45] D. Stein, M. Kruithof, C. Dekker, Phys. Rev. Lett. 93 (2004).[46] R.B. Schoch, P. Renaud, Appl. Phys. Lett. 86 (2005) 253111.[47] Y. Gushikem, J. Moreira, J. Colloid Interface Sci. 107 (1985) 70.[48] L.T. Kubota, J.C. Moreira, Y. Gushikem, Analyst 114 (1989) 1385.[49] M.M. Martin, L. Lindqvist, J. Lumin. 10 (1975) 381.[50] H. Diehl, R. Markuszewski, Talanta 32 (1985) 159.[51] G.W. Greene, K. Kristiansen, E.E. Meyer, J.R. Boles, J.N. Israelachvili, Geochim.Cosmochim. Acta 73 (2009) 2862.[1] T.M. Squires, S.R. Quake, Rev. Mod. Phys. 77 (2005) 977.