10 S. Kazi et al. / Intelligence xxx (2012) xxx–xxxTable 3Summary of results on cognitive and hypercognitive measures.The effect of age The effect of nationality The age×nationality interactionAnalyses Main and interaction effects ofprocessesF df p η 2 F df p η 2 F df p η 2 F df p η 214.409 3, 289 0.0001 0.13 108.025 3, 291 0.0001 0.53 9.960 1, 291 0.0001 0.10 5.852 9, 873 0.0001 0.06The 4 cognitive domains (quantitative, spatial, analogical,and deductive thought)The cognitive domains×age 4.810 9, 873 0.0001 0.05The 2 types of self-awareness (of the similarity vs. of59.786 3, 290 0.0001 0.38 23.165 1, 290 0.0001 0.07difficulty)x 2 types of comparison (within vs. across SSS)The type of self-awareness 114.998 1, 290 0.0001 0.28The type of comparison 122.627 1, 290 0.0001 0.29The ype of self-awareness×type of comparison 43.232 1, 290 0.0001 0.13The type of self-awareness×age 3.725 3, 290 0.05 0.03Thetypeofself-awareness×nationality 15.892 1, 290 0.0001 0.05Note: Only significant results are presented.CFI=.89, SRMR=.14, RMSEA=.05, 90% confidence intervalfor RMSEA=.037–.053), indicating that the two ethnic groupsdiffered in the strength of some relations.Based on the Langrange multiplier test for releasing constraints,the constraints that did not hold were released. Thesewere as follows: (a) the relation of the analogical performancemeasurestotheircorrespondingfirst-orderfactor(Induction);(b) the relation of the first-order factor standing for Deduction tothe second-order factor standing for Inference; (c) the firstorderfactor standing for Self-awareness of similarity whencomparing tasks addressing Different Cognitive Processes tothe second-order factor standing for Consciousness. This is thefirst of the two models shown in Fig. 6, wheretherelationsconstrained to be equal between groups are printed in bold.After removing the above mentioned constraints, (χ 2 (330)=436.65, p=.001, the fit of the model was better than theone which did not include any constraints, (χ 2 (343)=398.936,p=.02, CFI=.967, SRMR=.025, RMSEA=.025, 90% confidenceinterval for RMSEA=.011–.035, Δχ 2 (13)=37,71, pb.001).This model was retested after partialing out the effect ofage and speed of processing. Technically, to partial out theseeffects, each of the 20 measures was regressed on age and themean of speed of performance tasks, in addition to the factoreach measure was related to. Validating the stability of thearchitecture of cognitive processes is theoretically and practicallyimportant. From the point of view of theory, the effects ofdevelopment on cognitive architecture are still debated. Specifically,cognitive developmental theory would predict that, withincreasing age, cognitive processes tend to get organized inmore inclusive structures (Piaget, 1970). Differential theorieswould predict, based on Spearman's law of diminishing returns,that they would tend to differentiate in more specific abilities(Jensen, 1998; Spearman, 1927). Therefore, this manipulationwas a strict test of the factorial structure proposed here becauseit could show if the structures and relations assumed wouldsurvive the removal of two powerful factors of developmental(i.e., age) and functional (i.e., speed) cohesion of cognitiveprocesses. Practically, it was important for the comparison ofthe two ethnic groups to show, based on the second prediction,that the mental architecture is developmentally and functionallystable in both groups. The fit of this model when partialingout age and speed was very good, (χ 2 (351)=452.81, p=.000,CFI=.96, SRMR=.02, RMSEA=.02, 90% confidence intervalfor RMSEA=.022–.039). This is the second model shown inFig. 6. Interestingly, the effect of age on all measures, in bothethnic groups (mean regression coefficient of the 20 measureson age was .46 and .41 for the Greek and the Chinese children,respectively), was much stronger than the corresponding effectof processing efficiency (mean regression coefficient of the 20measures on processing efficiency was .12 and .09 for the Greekand the Chinese children, respectively).4.3. Strength of relations between processesThe third prediction is concerned with possible differencesbetween the two ethnic groups in the strength ofrelations between processes. To test this prediction, a seriesof structural models were tested which examined the directrelations between the various constructs as represented bythe second-order factors (see Fig. 7). Attention is drawn tothe fact that in these models the problem solving and thePlease cite this article as: Kazi, S., et al., Mind–culture <strong>interactions</strong>: <strong>How</strong> <strong>writing</strong> <strong>molds</strong> mental fluidity in early development,Intelligence (2012), http://dx.doi.org/10.1016/j.intell.2012.07.001
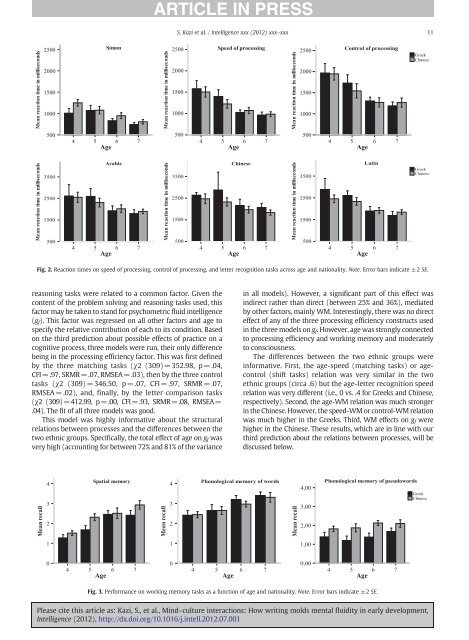
S. Kazi et al. / Intelligence xxx (2012) xxx–xxx11Fig. 2. Reaction times on speed of processing, control of processing, and letter recognition tasks across age and nationality. Note. Error bars indicate ±2 SΕ.reasoning tasks were related to a common factor. Given thecontent of the problem solving and reasoning tasks used, thisfactor may be taken to stand for psychometric fluid intelligence(g f ). This factor was regressed on all other factors and age tospecify the relative contribution of each to its condition. Basedon the third prediction about possible effects of practice on acognitive process, three models were run, their only differencebeing in the processing efficiency factor. This was first definedby the three matching tasks (χ2 (309)=352.98, p=.04,CFI=.97, SRMR=.07, RMSEA=.03), then by the three controltasks (χ2 (309) =346.50, p =.07, CFI=.97, SRMR =.07,RMSEA =.02), and, finally, by the letter comparison tasks(χ2 (309)=412.99, p=.00, CFI=.93, SRMR=.08, RMSEA=.04). The fit of all three models was good.This model was highly informative about the structuralrelations between processes and the differences between thetwo ethnic groups. Specifically, the total effect of age on g f wasvery high (accounting for between 72% and 81% of the variancein all models). <strong>How</strong>ever, a significant part of this effect wasindirect rather than direct (between 25% and 36%), mediatedby other factors, mainly WM. Interestingly, there was no directeffect of any of the three processing efficiency constructs usedin the three models on g f .<strong>How</strong>ever,agewasstronglyconnectedto processing efficiency and working memory and moderatelyto consciousness.The differences between the two ethnic groups wereinformative. First, the age-speed (matching tasks) or agecontrol(shift tasks) relation was very similar in the twoethnic groups (circa .6) but the age-letter recognition speedrelation was very different (i.e., 0 vs. .4 for Greeks and Chinese,respectively). Second, the age-WM relation was much strongerin the Chinese. <strong>How</strong>ever, the speed-WM or control-WM relationwas much higher in the Greeks. Third, WM effects on g f werehigher in the Chinese. These results, which are in line with ourthird prediction about the relations between processes, will bediscussed below.Fig. 3. Performance on working memory tasks as a function of age and nationality. Note. Error bars indicate ±2 SΕ.Please cite this article as: Kazi, S., et al., Mind–culture <strong>interactions</strong>: <strong>How</strong> <strong>writing</strong> <strong>molds</strong> mental fluidity in early development,Intelligence (2012), http://dx.doi.org/10.1016/j.intell.2012.07.001