ANNUAL REPORT 2001 - Anglo Platinum
ANNUAL REPORT 2001 - Anglo Platinum
ANNUAL REPORT 2001 - Anglo Platinum
- No tags were found...

Create successful ePaper yourself
Turn your PDF publications into a flip-book with our unique Google optimized e-Paper software.
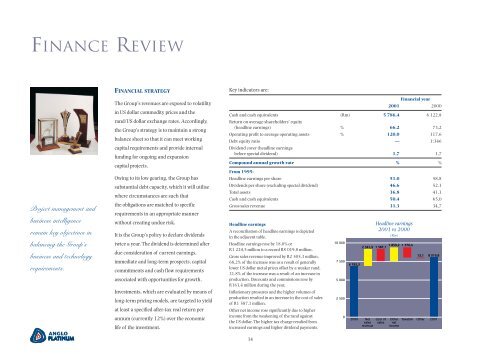
FINANCE REVIEWProject management andbusiness intelligenceremain key objectives inbalancing the Group’sbusiness and technologyrequirements.FINANCIAL STRATEGYThe Group’s revenues are exposed to volatilityin US dollar commodity prices and therand/US dollar exchange rates. Accordingly,the Group’s strategy is to maintain a strongbalance sheet so that it can meet workingcapital requirements and provide internalfunding for ongoing and expansioncapital projects.Owing to its low gearing, the Group hassubstantial debt capacity, which it will utilisewhere circumstances are such thatthe obligations are matched to specificrequirements in an appropriate mannerwithout creating undue risk.It is the Group’s policy to declare dividendstwice a year. The dividend is determined afterdue consideration of current earnings,immediate and long-term prospects, capitalcommitments and cash flow requirementsassociated with opportunities for growth.Investments, which are evaluated by means oflong-term pricing models, are targeted to yieldat least a specified after-tax real return perannum (currently 12%) over the economiclife of the investment.Key indicators are:34Financial year<strong>2001</strong> 2000Cash and cash equivalents (Rm) 5 786,4 6 122,8Return on average shareholders’ equity(headline earnings) % 66,2 73,2Operating profit to average operating assets % 120,0 117,6Debt equity ratio — 1:346Dividend cover (headline earningsbefore special dividend) 1,7 1,7Compound annual growth rate % %From 1995:Headline earnings per share 51,0 58,8Dividends per share (excluding special dividend) 46,6 52,1Total assets 36,8 41,1Cash and cash equivalents 50,4 65,0Gross sales revenue 31,3 34,7Headline earningsA reconciliation of headline earnings is depictedin the adjacent table.Headline earnings rose by 18,0% orR1 224,5 million to a record R8 019,8 million.Gross sales revenue improved by R2 505,3 million.68,2% of the increase was as a result of generallylower US dollar metal prices offset by a weaker rand.31.8% of the increase was a result of an increase inproduction. Discounts and commissions rose byR163,4 million during the year.Inflationary pressures and the higher volumes ofproduction resulted in an increase in the cost of salesof R1 587,1 million.Other net income rose significantly due to higherincome from the weakening of the rand againstthe US dollar. The higher tax charge resulted fromincreased earnings and higher dividend payments.10 0007 5005 0002 50006 795,32000NetsalesrevenueHeadline earnings<strong>2001</strong> vs 2000(Rm)1 859,2 1 376,42 341,9 1 587,1Cost ofsalesOthernetincomeTaxation13,1Other8 019,8<strong>2001</strong>


![[PDF] Mogalakwena Mine - Anglo Platinum](https://img.yumpu.com/43065142/1/184x260/pdf-mogalakwena-mine-anglo-platinum.jpg?quality=85)