Effects of photorespiration, the cytochrome pathway, and the ...
Effects of photorespiration, the cytochrome pathway, and the ...
Effects of photorespiration, the cytochrome pathway, and the ...
- No tags were found...
You also want an ePaper? Increase the reach of your titles
YUMPU automatically turns print PDFs into web optimized ePapers that Google loves.
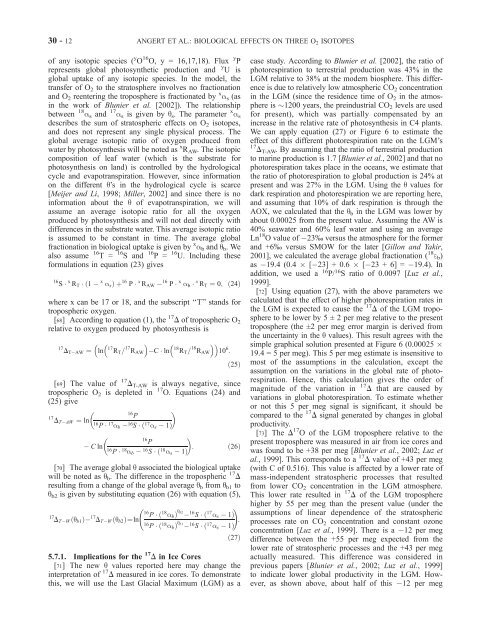
30 - 12 ANGERT ET AL.: BIOLOGICAL EFFECTS ON THREE O 2 ISOTOPES<strong>of</strong> any isotopic species ( y O 16 O, y = 16,17,18). Flux y Prepresents global photosyn<strong>the</strong>tic production <strong>and</strong> y U isglobal uptake <strong>of</strong> any isotopic species. In <strong>the</strong> model, <strong>the</strong>transfer <strong>of</strong> O 2 to <strong>the</strong> stratosphere involves no fractionation<strong>and</strong> O 2 reentering <strong>the</strong> troposphere is fractionated by x a s (asin <strong>the</strong> work <strong>of</strong> Blunier et al. [2002]). The relationshipbetween 18 a s <strong>and</strong> 17 a s is given by q s . The parameter x a sdescribes <strong>the</strong> sum <strong>of</strong> stratospheric effects on O 2 isotopes,<strong>and</strong> does not represent any single physical process. Theglobal average isotopic ratio <strong>of</strong> oxygen produced fromwater by photosyn<strong>the</strong>sis will be noted as x R AW . The isotopiccomposition <strong>of</strong> leaf water (which is <strong>the</strong> substrate forphotosyn<strong>the</strong>sis on l<strong>and</strong>) is controlled by <strong>the</strong> hydrologicalcycle <strong>and</strong> evapotranspiration. However, since informationon <strong>the</strong> different q’s in <strong>the</strong> hydrological cycle is scarce[Meijer <strong>and</strong> Li, 1998; Miller, 2002] <strong>and</strong> since <strong>the</strong>re is noinformation about <strong>the</strong> q <strong>of</strong> evapotranspiration, we willassume an average isotopic ratio for all <strong>the</strong> oxygenproduced by photosyn<strong>the</strong>sis <strong>and</strong> will not deal directly withdifferences in <strong>the</strong> substrate water. This average isotopic ratiois assumed to be constant in time. The average globalfractionation in biological uptake is given by x a b <strong>and</strong> q b .Wealso assume 16 T = 16 S <strong>and</strong> 16 P = 16 U. Including <strong>the</strong>seformulations in equation (23) gives16 S x R T ð1Þþ 16 P x R 16 AW P x a b x R T ¼ 0; ð24Þx a swhere x can be 17 or 18, <strong>and</strong> <strong>the</strong> subscript ‘‘T’’ st<strong>and</strong>s fortropospheric oxygen.[68] According to equation (1), <strong>the</strong> 17 D <strong>of</strong> tropospheric O 2relative to oxygen produced by photosyn<strong>the</strong>sis is 17 D T AW ¼ ln 17 R T = 17 R AWC ln 18 R T = 18 R AW 10 6 :ð25Þ[69] The value <strong>of</strong> 17 D T-AW is always negative, sincetropospheric O 2 is depleted in 17 O. Equations (24) <strong>and</strong>(25) give17 D T AW ¼ ln16 P16P 17 a16 b S ð17 a s 1Þ16 PC ln16P 18 : ð26Þa16 b S ð18 a s 1Þ[70] The average global q associated <strong>the</strong> biological uptakewill be noted as q b . The difference in <strong>the</strong> tropospheric 17 Dresulting from a change <strong>of</strong> <strong>the</strong> global average q b from q b1 toq b2 is given by substituting equation (26) with equation (5),17 D T W ðq b1 Þ17 D T W ðq b2 Þ¼ln!16 P ð 18 a b Þ qb2 16 S ð17 a s 1Þ:16P ð18 a b Þ qb1 16 S ð17 a s 1Þð27Þ5.7.1. Implications for <strong>the</strong> 17 D in Ice Cores[71] The new q values reported here may change <strong>the</strong>interpretation <strong>of</strong> 17 D measured in ice cores. To demonstratethis, we will use <strong>the</strong> Last Glacial Maximum (LGM) as acase study. According to Blunier et al. [2002], <strong>the</strong> ratio <strong>of</strong><strong>photorespiration</strong> to terrestrial production was 43% in <strong>the</strong>LGM relative to 38% at <strong>the</strong> modern biosphere. This differenceis due to relatively low atmospheric CO 2 concentrationin <strong>the</strong> LGM (since <strong>the</strong> residence time <strong>of</strong> O 2 in <strong>the</strong> atmosphereis 1200 years, <strong>the</strong> preindustrial CO 2 levels are usedfor present), which was partially compensated by anincrease in <strong>the</strong> relative rate <strong>of</strong> photosyn<strong>the</strong>sis in C4 plants.We can apply equation (27) or Figure 6 to estimate <strong>the</strong>effect <strong>of</strong> this different <strong>photorespiration</strong> rate on <strong>the</strong> LGM’s17 D T-AW . By assuming that <strong>the</strong> ratio <strong>of</strong> terrestrial productionto marine production is 1.7 [Blunier et al., 2002] <strong>and</strong> that no<strong>photorespiration</strong> takes place in <strong>the</strong> oceans, we estimate that<strong>the</strong> ratio <strong>of</strong> <strong>photorespiration</strong> to global production is 24% atpresent <strong>and</strong> was 27% in <strong>the</strong> LGM. Using <strong>the</strong> q values fordark respiration <strong>and</strong> <strong>photorespiration</strong> we are reporting here,<strong>and</strong> assuming that 10% <strong>of</strong> dark respiration is through <strong>the</strong>AOX, we calculated that <strong>the</strong> q b in <strong>the</strong> LGM was lower byabout 0.00025 from <strong>the</strong> present value. Assuming <strong>the</strong> AW is40% seawater <strong>and</strong> 60% leaf water <strong>and</strong> using an averageLn 18 O value <strong>of</strong> 23% versus <strong>the</strong> atmosphere for <strong>the</strong> former<strong>and</strong> +6% versus SMOW for <strong>the</strong> later [Gillon <strong>and</strong> Yakir,2001], we calculated <strong>the</strong> average global fractionation ( 18 e b )as 19.4 (0.4 [ 23] + 0.6 [ 23 + 6] = 19.4). Inaddition, we used a 16 P/ 16 S ratio <strong>of</strong> 0.0097 [Luz et al.,1999].[72] Using equation (27), with <strong>the</strong> above parameters wecalculated that <strong>the</strong> effect <strong>of</strong> higher <strong>photorespiration</strong> rates in<strong>the</strong> LGM is expected to cause <strong>the</strong> 17 D <strong>of</strong> <strong>the</strong> LGM troposphereto be lower by 5 ± 2 per meg relative to <strong>the</strong> presenttroposphere (<strong>the</strong> ±2 per meg error margin is derived from<strong>the</strong> uncertainty in <strong>the</strong> q values). This result agrees with <strong>the</strong>simple graphical solution presented at Figure 6 (0.00025 19.4 = 5 per meg). This 5 per meg estimate is insensitive tomost <strong>of</strong> <strong>the</strong> assumptions in <strong>the</strong> calculation, except <strong>the</strong>assumption on <strong>the</strong> variations in <strong>the</strong> global rate <strong>of</strong> <strong>photorespiration</strong>.Hence, this calculation gives <strong>the</strong> order <strong>of</strong>magnitude <strong>of</strong> <strong>the</strong> variation in 17 D that are caused byvariations in global <strong>photorespiration</strong>. To estimate whe<strong>the</strong>ror not this 5 per meg signal is significant, it should becompared to <strong>the</strong> 17 D signal generated by changes in globalproductivity.[73] The D 17 O <strong>of</strong> <strong>the</strong> LGM troposphere relative to <strong>the</strong>present troposphere was measured in air from ice cores <strong>and</strong>was found to be +38 per meg [Blunier et al., 2002; Luz etal., 1999]. This corresponds to a 17 D value <strong>of</strong> +43 per meg(with C <strong>of</strong> 0.516). This value is affected by a lower rate <strong>of</strong>mass-independent stratospheric processes that resultedfrom lower CO 2 concentration in <strong>the</strong> LGM atmosphere.This lower rate resulted in 17 D <strong>of</strong> <strong>the</strong> LGM tropospherehigher by 55 per meg than <strong>the</strong> present value (under <strong>the</strong>assumptions <strong>of</strong> linear dependence <strong>of</strong> <strong>the</strong> stratosphericprocesses rate on CO 2 concentration <strong>and</strong> constant ozoneconcentration [Luz et al., 1999]. There is a 12 per megdifference between <strong>the</strong> +55 per meg expected from <strong>the</strong>lower rate <strong>of</strong> stratospheric processes <strong>and</strong> <strong>the</strong> +43 per megactually measured. This difference was considered inprevious papers [Blunier et al., 2002; Luz et al., 1999]to indicate lower global productivity in <strong>the</strong> LGM. However,as shown above, about half <strong>of</strong> this 12 per meg


