Effects of photorespiration, the cytochrome pathway, and the ...
Effects of photorespiration, the cytochrome pathway, and the ...
Effects of photorespiration, the cytochrome pathway, and the ...
- No tags were found...

You also want an ePaper? Increase the reach of your titles
YUMPU automatically turns print PDFs into web optimized ePapers that Google loves.
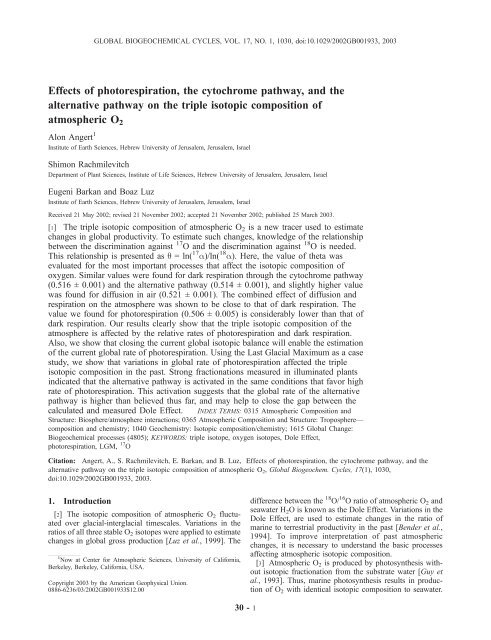
GLOBAL BIOGEOCHEMICAL CYCLES, VOL. 17, NO. 1, 1030, doi:10.1029/2002GB001933, 2003<strong>Effects</strong> <strong>of</strong> <strong>photorespiration</strong>, <strong>the</strong> <strong>cytochrome</strong> <strong>pathway</strong>, <strong>and</strong> <strong>the</strong>alternative <strong>pathway</strong> on <strong>the</strong> triple isotopic composition <strong>of</strong>atmospheric O 2Alon Angert 1Institute <strong>of</strong> Earth Sciences, Hebrew University <strong>of</strong> Jerusalem, Jerusalem, IsraelShimon RachmilevitchDepartment <strong>of</strong> Plant Sciences, Institute <strong>of</strong> Life Sciences, Hebrew University <strong>of</strong> Jerusalem, Jerusalem, IsraelEugeni Barkan <strong>and</strong> Boaz LuzInstitute <strong>of</strong> Earth Sciences, Hebrew University <strong>of</strong> Jerusalem, Jerusalem, IsraelReceived 21 May 2002; revised 21 November 2002; accepted 21 November 2002; published 25 March 2003.[1] The triple isotopic composition <strong>of</strong> atmospheric O 2 is a new tracer used to estimatechanges in global productivity. To estimate such changes, knowledge <strong>of</strong> <strong>the</strong> relationshipbetween <strong>the</strong> discrimination against 17 O <strong>and</strong> <strong>the</strong> discrimination against 18 O is needed.This relationship is presented as q =ln( 17 a)/ln( 18 a). Here, <strong>the</strong> value <strong>of</strong> <strong>the</strong>ta wasevaluated for <strong>the</strong> most important processes that affect <strong>the</strong> isotopic composition <strong>of</strong>oxygen. Similar values were found for dark respiration through <strong>the</strong> <strong>cytochrome</strong> <strong>pathway</strong>(0.516 ± 0.001) <strong>and</strong> <strong>the</strong> alternative <strong>pathway</strong> (0.514 ± 0.001), <strong>and</strong> slightly higher valuewas found for diffusion in air (0.521 ± 0.001). The combined effect <strong>of</strong> diffusion <strong>and</strong>respiration on <strong>the</strong> atmosphere was shown to be close to that <strong>of</strong> dark respiration. Thevalue we found for <strong>photorespiration</strong> (0.506 ± 0.005) is considerably lower than that <strong>of</strong>dark respiration. Our results clearly show that <strong>the</strong> triple isotopic composition <strong>of</strong> <strong>the</strong>atmosphere is affected by <strong>the</strong> relative rates <strong>of</strong> <strong>photorespiration</strong> <strong>and</strong> dark respiration.Also, we show that closing <strong>the</strong> current global isotopic balance will enable <strong>the</strong> estimation<strong>of</strong> <strong>the</strong> current global rate <strong>of</strong> <strong>photorespiration</strong>. Using <strong>the</strong> Last Glacial Maximum as a casestudy, we show that variations in global rate <strong>of</strong> <strong>photorespiration</strong> affected <strong>the</strong> tripleisotopic composition in <strong>the</strong> past. Strong fractionations measured in illuminated plantsindicated that <strong>the</strong> alternative <strong>pathway</strong> is activated in <strong>the</strong> same conditions that favor highrate <strong>of</strong> <strong>photorespiration</strong>. This activation suggests that <strong>the</strong> global rate <strong>of</strong> <strong>the</strong> alternative<strong>pathway</strong> is higher than believed thus far, <strong>and</strong> may help to close <strong>the</strong> gap between <strong>the</strong>calculated <strong>and</strong> measured Dole Effect. INDEX TERMS: 0315 Atmospheric Composition <strong>and</strong>Structure: Biosphere/atmosphere interactions; 0365 Atmospheric Composition <strong>and</strong> Structure: Troposphere—composition <strong>and</strong> chemistry; 1040 Geochemistry: Isotopic composition/chemistry; 1615 Global Change:Biogeochemical processes (4805); KEYWORDS: triple isotope, oxygen isotopes, Dole Effect,<strong>photorespiration</strong>, LGM, 17 OCitation: Angert, A., S. Rachmilevitch, E. Barkan, <strong>and</strong> B. Luz, <strong>Effects</strong> <strong>of</strong> <strong>photorespiration</strong>, <strong>the</strong> <strong>cytochrome</strong> <strong>pathway</strong>, <strong>and</strong> <strong>the</strong>alternative <strong>pathway</strong> on <strong>the</strong> triple isotopic composition <strong>of</strong> atmospheric O 2 , Global Biogeochem. Cycles, 17(1), 1030,doi:10.1029/2002GB001933, 2003.1. Introduction[2] The isotopic composition <strong>of</strong> atmospheric O 2 fluctuatedover glacial-interglacial timescales. Variations in <strong>the</strong>ratios <strong>of</strong> all three stable O 2 isotopes were applied to estimatechanges in global gross production [Luz et al., 1999]. The1 Now at Center for Atmospheric Sciences, University <strong>of</strong> California,Berkeley, Berkeley, California, USA.Copyright 2003 by <strong>the</strong> American Geophysical Union.0886-6236/03/2002GB001933$12.00difference between <strong>the</strong> 18 O/ 16 O ratio <strong>of</strong> atmospheric O 2 <strong>and</strong>seawater H 2 O is known as <strong>the</strong> Dole Effect. Variations in <strong>the</strong>Dole Effect, are used to estimate changes in <strong>the</strong> ratio <strong>of</strong>marine to terrestrial productivity in <strong>the</strong> past [Bender et al.,1994]. To improve interpretation <strong>of</strong> past atmosphericchanges, it is necessary to underst<strong>and</strong> <strong>the</strong> basic processesaffecting atmospheric isotopic composition.[3] Atmospheric O 2 is produced by photosyn<strong>the</strong>sis withoutisotopic fractionation from <strong>the</strong> substrate water [Guy etal., 1993]. Thus, marine photosyn<strong>the</strong>sis results in production<strong>of</strong> O 2 with identical isotopic composition to seawater.30 - 1
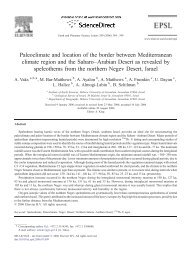
30 - 2 ANGERT ET AL.: BIOLOGICAL EFFECTS ON THREE O 2 ISOTOPESThe substrate water in leaves is enriched in 17 O <strong>and</strong> 18 Othrough evapotranspiration [Dongmann, 1974]. As a result,terrestrial photosyn<strong>the</strong>sis produces O 2 that, on average, isenriched in <strong>the</strong>se heavy isotopes. In both marine <strong>and</strong>terrestrial systems, <strong>the</strong> major cause <strong>of</strong> <strong>the</strong> heavy isotopeenrichment is preferential removal <strong>of</strong> 16 O (over 17 O <strong>and</strong>18 O) by biological uptake mechanisms [Lane <strong>and</strong> Dole,1956]. This preferential removal is mass-dependent <strong>and</strong> <strong>the</strong>relative increase in 17 O/ 16 O is about half (0.52) <strong>of</strong> <strong>the</strong>relative increase in 18 O/ 16 O (Figure 1). In addition toevapotranspiration <strong>and</strong> biological uptake, atmospheric O 2is also affected by photochemical reactions in <strong>the</strong> stratosphere[Luz et al., 1999]. These reactions preferentiallytransfer 17 O <strong>and</strong> 18 O from O 2 to CO 2 in a mass-independentway. Hence, in <strong>the</strong>se reactions <strong>the</strong> ratio <strong>of</strong> <strong>the</strong> increase in17 O/ 16 O over 18 O/ 16 O in CO 2 is equal to 1 or larger[Lämmerzahl et al., 2002; Thiemens, 1999]. As a result,O 2 becomes mass-independently depleted in <strong>the</strong> heavyisotopes [Bender et al., 1994]. At <strong>the</strong> surface <strong>of</strong> <strong>the</strong> Earth,<strong>the</strong> 17 O depletion <strong>of</strong> atmospheric O 2 is removed byexchange through photosyn<strong>the</strong>sis <strong>and</strong> uptake. Therefore,<strong>the</strong> net result is depletion in 17 O <strong>of</strong> atmospheric O 2 incomparison to O 2 affected by biological uptake alone(Figure 1). The magnitude <strong>of</strong> this depletion depends on<strong>the</strong> ratio <strong>of</strong> production <strong>of</strong> 17 O depleted O 2 in <strong>the</strong> stratosphere,<strong>and</strong> its destruction by biological cycling. Thus, pastvariations in <strong>the</strong> 17 O depletion can be used to infer changesin global biological productivity.[4] In order to apply this approach, it is necessary that <strong>the</strong>relationship between 17 O/ 16 O <strong>and</strong> 18 O/ 16 O to be known withgreat accuracy. However, <strong>the</strong> triple isotope relationships indifferent physical-chemical mass-dependent processes,varies slightly about 0.52 [Luz <strong>and</strong> Barkan, 2000; Matsuhisaet al., 1978; Young et al., 2002]. If this is also <strong>the</strong> casefor O 2 consumption by different biological mechanisms,<strong>the</strong>n a change in <strong>the</strong> ratio <strong>of</strong> uptake by <strong>the</strong> different <strong>pathway</strong>swill result in variations in <strong>the</strong> magnitude <strong>of</strong> <strong>the</strong> 17 Odepletion. As a consequence, past variations in this parameterwill be misinterpreted.[5] In interpretations <strong>of</strong> variations in <strong>the</strong> Dole Effect it isusually assumed that <strong>the</strong> major driving force is changes in<strong>the</strong> terrestrial to marine production rate (terrestrial producedO 2 is heavier than marine produced, because <strong>of</strong> <strong>the</strong> enrichment<strong>of</strong> leaf water in evapotranspiration). An impliedassumption is that <strong>the</strong> enrichment due to biological uptakeremains constant. In <strong>the</strong> present paper, we explore <strong>the</strong>possibility that time variations in Dole Effect were alsoaffected by changes in <strong>the</strong> relative rates <strong>of</strong> O 2 uptake bydifferent biological mechanisms, that have different fractionationsassociated with <strong>the</strong>m. Consumption (or uptake) <strong>of</strong>O 2 in plants occurs via four mechanisms: ordinary respirationthrough <strong>the</strong> <strong>cytochrome</strong> oxidase <strong>pathway</strong> (COX), respirationby <strong>the</strong> alternative oxidase <strong>pathway</strong> (AOX), Mehlerreaction, <strong>and</strong> <strong>photorespiration</strong>. The first two processes takeplace in light as well as in dark conditions, while <strong>the</strong> lattertwo occur only under illumination. In addition, O 2 diffusionin air precedes biological uptake in some cases. The discriminationagainst 18 O associated with <strong>the</strong> AOX (28%)isstronger than <strong>the</strong> discrimination associated with o<strong>the</strong>r mechanisms(COX 18%, Mehler 15%, <strong>photorespiration</strong> Figure 1. Schematic plot (not to scale) <strong>of</strong> 17 O <strong>and</strong> 18 Orelative to 16 O variations. Oxygen is produced by photosyn<strong>the</strong>sis<strong>and</strong> it is fractionated by biological uptake in amass-dependent way, <strong>and</strong> by stratospheric photochemistryin a mass-independent way. The balance between <strong>the</strong>se twotypes <strong>of</strong> fractionation control <strong>the</strong> triple isotopic composition<strong>of</strong> atmospheric O 2 .22%). Hence, an increase in <strong>the</strong> proportion <strong>of</strong> O 2 uptake byAOX will significantly intensify <strong>the</strong> Dole Effect.[6] To improve <strong>the</strong> interpretation <strong>of</strong> past variations in <strong>the</strong>triple O 2 isotopes <strong>and</strong> <strong>the</strong> Dole Effect, we have investigated<strong>the</strong> effects <strong>of</strong> biological mechanisms in controlled laboratoryexperiments. In one set <strong>of</strong> experiments, we studiedtriple isotope variations due to uptake alone by COX <strong>and</strong>AOX, <strong>and</strong> due to removal by diffusion. In a second set <strong>of</strong>experiments, conducted in an airtight terrarium, we analyzed<strong>the</strong> combined effects <strong>of</strong> production <strong>and</strong> consumptionby both dark <strong>and</strong> light reactions in steady state betweenphotosyn<strong>the</strong>sis <strong>and</strong> uptake.2. Triple Isotope Systematics2.1. Terminology[7] Atmospheric O 2 is depleted in 17 O due to stratosphericreactions. Hence, O 2 that is produced by photosyn<strong>the</strong>siswill have 17 O excess with respect to atmospheric O 2 .This 17 O excess was formulated in previous papers [Luz <strong>and</strong>Barkan, 2000; Luz et al., 1999] as D 17 O=d 17 O 0.521 d 18 O. However, this definition is somewhat problematicsince it contains a linear approximation to <strong>the</strong> mass-dependentfractionation, <strong>and</strong> because <strong>the</strong> parameter 0.521 (thatrepresents mass-dependent processes) depends on <strong>the</strong>choice <strong>of</strong> reference material. Here, we follow <strong>the</strong> suggestion<strong>of</strong> Miller [2002] for a new definition <strong>of</strong> <strong>the</strong> 17 O excess thatis free <strong>of</strong> <strong>the</strong>se problems:17 R18 R17 D ln C ln : ð1Þ17R18 ref R ref
ANGERT ET AL.: BIOLOGICAL EFFECTS ON THREE O 2 ISOTOPES 30 - 3[8] The new definition <strong>of</strong> <strong>the</strong> 17 O excess will be noted as17 D to distinguish it from <strong>the</strong> old definition (D 17 O). 17 Rst<strong>and</strong>s for <strong>the</strong> isotope ratio 17 O 16 O/ 16 O 2 , 18 R st<strong>and</strong>s for <strong>the</strong>isotope ratio 18 O 16 O/ 16 O 2 , <strong>and</strong> <strong>the</strong> subscript ‘‘ref’’ st<strong>and</strong>s for<strong>the</strong> reference. It should be noted that 17 D is a calculatedvalue that depends both on <strong>the</strong> st<strong>and</strong>ard used <strong>and</strong> on <strong>the</strong>value <strong>of</strong> <strong>the</strong> parameter C. This parameter represents <strong>the</strong>triple isotope relationships in mass-dependent processes.However, as was mentioned in <strong>the</strong> introduction, <strong>the</strong>serelationships vary slightly about 0.52 for different processes.As a result, The chosen C value can only correspond to <strong>the</strong>relationship associated with one <strong>of</strong> <strong>the</strong> processes, preferably<strong>the</strong> main one. In this study we choose to use a value <strong>of</strong> C =0.516, which corresponds to ordinary dark respiration(COX), <strong>the</strong> most wide spread global O 2 uptake mechanism.[9] In <strong>the</strong> old definition <strong>of</strong> <strong>the</strong> 17 Oexcess(D 17 O) <strong>the</strong>variations in <strong>the</strong> isotopic composition were described on ad 17 O versus d 18 O plot. To describe <strong>the</strong> variation in <strong>the</strong> isotopiccomposition according to <strong>the</strong> new definition, two new termsthat will be used for <strong>the</strong> axes <strong>of</strong> such plot are suggested,Ln 17 O lnLn 18 O ln17 R17R ref18 R18R ref¼ ln d 17 O þ 1Þ¼ ln d 18 O þ 1Þ:[10] Ano<strong>the</strong>r advantage <strong>of</strong> 17 D,Ln 17 O <strong>and</strong> Ln 18 O is that<strong>the</strong>y are dimensionless. Hence, <strong>the</strong> value <strong>of</strong> a sample versus<strong>the</strong> reference exactly equals to <strong>the</strong> value <strong>of</strong> <strong>the</strong> referenceversus <strong>the</strong> sample with <strong>the</strong> opposite sign (this is not true forD 17 O, d 17 O <strong>and</strong> d 18 O). For convenience, Ln 17 O <strong>and</strong> Ln 18 Oare expressed as permil (%) <strong>and</strong> 17 D as per meg deviationsfrom <strong>the</strong> st<strong>and</strong>ard.[11] The slope <strong>of</strong> a line passing between two points (A<strong>and</strong> B) on a Ln 17 O versus Ln 18 O plot, will be defined as l,as in previous work [e.g., Miller, 2002], ln 17 R A = 17 R Bl : ð4Þln 18 R A = 18 R B[12] Following Mook [2000], <strong>the</strong> relationship between <strong>the</strong>discrimination against17 O <strong>and</strong> 18 O (relative to 16 O) ispresented asq ln ð17 aÞlnð 18 aÞ ; ð5Þwhere 17 a <strong>and</strong> 18 a are <strong>the</strong> fractionation factors x R p / x R s . Thesubscripts ‘‘p’’ <strong>and</strong> ‘‘s’’ st<strong>and</strong> for ‘‘product’’ <strong>and</strong> ‘‘substrate,’’respectively (x can be 17 or 18).[13] Blunier et al. [2002] used an additional relationshipbetween <strong>the</strong> discriminations,g ð2Þð3Þ17 a 118a 1 ¼ 17 e18e ; ð6Þwhere x e is x a 1.[14] The terms q <strong>and</strong> g describe <strong>the</strong> inherent relationshipbetween <strong>the</strong> discriminations, but cannot be measureddirectly. What can be measured is <strong>the</strong> slope (l) that iscontrolled by <strong>the</strong>se relationships <strong>and</strong> <strong>the</strong> processes thattake place in <strong>the</strong> system. In <strong>the</strong> special case <strong>of</strong> a systemat steady state, in which production equals uptake, <strong>the</strong>slope (l) is equal to q (see section 2.2). In <strong>the</strong> specialcase <strong>of</strong> a system where only uptake takes place, <strong>the</strong> slope(l) is equal to g (see section 2.3). Hence, by conductingexperiments in such systems, q or g could be calculatedfrom <strong>the</strong> measured l. In o<strong>the</strong>r systems (for example, inones where mixing takes place) <strong>the</strong> slope can be differentfrom both q <strong>and</strong> g. The difference between <strong>the</strong> value <strong>of</strong> q<strong>and</strong> g is small (0.003), but since <strong>the</strong> 17 O excessvariations in O 2 are minute such a difference cannot beneglected.[15] This paper deals with <strong>the</strong> effect <strong>of</strong> <strong>the</strong> biosphere on<strong>the</strong> triple isotopic composition <strong>of</strong> <strong>the</strong> atmosphere. Since <strong>the</strong>biosphere-atmosphere system is close to production-uptakesteady state, we chose to use q to report <strong>the</strong> relationshipbetween discriminations.2.2. Production-Uptake Steady State[16] In this study, we used a terrarium similar to that <strong>of</strong>Luz et al. [1999] to estimate <strong>the</strong> q value associated with<strong>photorespiration</strong>. To underst<strong>and</strong> how <strong>the</strong> q value <strong>of</strong> aprocess can be evaluated from such experiment, we willdiscuss <strong>the</strong> triple isotope systematics <strong>of</strong> a closed system inbiological production-uptake steady state. Such a systemcan also be used as a model for <strong>the</strong> Earth atmosphere <strong>and</strong>biosphere without <strong>the</strong> effects <strong>of</strong> stratospheric photochemistry<strong>and</strong> <strong>the</strong> hydrological cycle.[17] The starting point for such a system is oxygen that isproduced by photosyn<strong>the</strong>sis in photosystem 2 from water(noted as ‘‘W’’) without isotopic fractionation. Uptake byrespiration causes enrichment in <strong>the</strong> heavy isotopes. Since<strong>the</strong> fractionation in biological uptake is mass dependent, <strong>the</strong>enrichment in 17 O will be about half <strong>of</strong> <strong>the</strong> enrichment in18 O. In steady state, depending on <strong>the</strong> value <strong>of</strong> q, <strong>the</strong> systemwill reach ei<strong>the</strong>r <strong>the</strong> point that is marked as ‘‘BSS1’’(Biological Steady State 1) or ‘‘BSS2’’ in Figure 2. TheLn 18 O value <strong>of</strong> <strong>the</strong> O 2 in steady state relative to <strong>the</strong>substrate water is illustrated by <strong>the</strong> horizontal distancebetween ‘‘BSS1’’ (or ‘‘BSS2’’) <strong>and</strong> ‘‘W,’’ <strong>and</strong> is <strong>the</strong>system’s equivalent <strong>of</strong> <strong>the</strong> ‘‘Dole Effect.’’[18] A system in production-uptake steady state can beanalyzed graphically as in Figure 2, or, more rigorously, bya model that deals with <strong>the</strong> fluxes <strong>of</strong> <strong>the</strong> three isotopicspecies. Such a one-box model <strong>of</strong> production-uptake steadystate can be formulated as follows:y P ¼ y U;where y P is production rate <strong>of</strong> y O 16 O (y can be 16, 17 or18), <strong>and</strong> y U is uptake rate <strong>of</strong> y O 16 O.[19] Equation (7) can be rewritten as follows:ð7Þ16 P x R W ¼ 16 U x R BSS x a; ð8Þwhere x can be 17 or 18, <strong>the</strong> subscript ‘‘W’’ st<strong>and</strong>s foroxygen produced by photosyn<strong>the</strong>sis, <strong>and</strong> ‘‘BSS’’ st<strong>and</strong>s for<strong>the</strong> system air in biological steady state.
30 - 4 ANGERT ET AL.: BIOLOGICAL EFFECTS ON THREE O 2 ISOTOPES[23] According to equation (1), <strong>the</strong> 17 D <strong>of</strong> <strong>the</strong> photosyn<strong>the</strong>ticallyproduced oxygen is17 R W17 R W17 D W ¼ ln C ln : ð11Þ17R17 ref R ref[24] Subtracting equation (11) from equation (10), <strong>and</strong>using equation (5) yields17 D 17 BSS D W ¼ ln18 a C q: ð12ÞFigure 2. Schematic plot (not to scale) <strong>of</strong> Ln 17 O versusLn 18 O for a closed system in production-uptake steadystate. Point ‘‘W’’ represents oxygen that is produced byphotosyn<strong>the</strong>sis in photosystem 2 from water, <strong>and</strong> ‘‘BSS1’’<strong>and</strong> ‘‘BSS2’’ represent biological steady states. The slope <strong>of</strong><strong>the</strong> line that connects ‘‘BSS1’’ <strong>and</strong> ‘‘W’’ is equal to q 1 <strong>and</strong><strong>the</strong> slope <strong>of</strong> <strong>the</strong> line connecting ‘‘BSS2’’ <strong>and</strong> ‘‘W’’ is equalto q 2 (q =ln( 17 a)/ln( 18 a)). When q <strong>of</strong> <strong>the</strong> system equals q 1<strong>the</strong> system reaches <strong>the</strong> steady state condition indicated by‘‘BSS1’’ with an 17 O excess <strong>of</strong> 17 D BSS1 . Since C equals toq 1 , 17 D BSS1 equals to <strong>the</strong> 17 D W . When q <strong>of</strong> <strong>the</strong> system equalsq 2 <strong>the</strong> system reaches steady state indicated by ‘‘BSS2’’with 17 O excess <strong>of</strong> 17 D BSS2 that is lower than 17 D BSS1 . Thehorizontal distance between ‘‘BSS’’ <strong>and</strong> ‘‘W’’ is <strong>the</strong>system’s equivalent <strong>of</strong> <strong>the</strong> global Dole Effect (in Ln 18 Oterms). The difference between 17 D BSS1 <strong>and</strong> 17 D BSS2 isgiven by <strong>the</strong> system’s ‘‘Dole Effect’’ times <strong>the</strong> differencebetween q 1 <strong>and</strong> q 2 .[20] Rearranging equation (8) <strong>and</strong> substituting it intoequation (4) givesl BSS ¼ ln ð17 aÞln 18 ¼ q: ð9Þð aÞ [21] Hence, <strong>the</strong> slope <strong>of</strong> <strong>the</strong> line connecting <strong>the</strong> O 2 <strong>of</strong> abiological system in production-uptake steady state, <strong>and</strong> <strong>the</strong>O 2 produced from <strong>the</strong> substrate water, is equal to <strong>the</strong> value<strong>of</strong> q. However, as we will show in section 2.3 below, <strong>the</strong>value <strong>of</strong> l is not always equal to <strong>the</strong> value <strong>of</strong> q.[22] The 17 D in production-uptake steady state can befound by substituting equations (7) <strong>and</strong> (8) into equation (1),[25] When q equals C, <strong>the</strong> 17 D value <strong>of</strong> <strong>the</strong> air in steadystate equals to that <strong>of</strong> <strong>the</strong> oxygen that is produced from <strong>the</strong>substrate water. However, if q is different from C, <strong>the</strong>n17 D BSS is controlled both by q <strong>and</strong> 18 a.[26] Currently, <strong>the</strong> value <strong>of</strong> 17 D W cannot be measureddirectly with sufficient accuracy. However, this value canbe estimated by conducting a terrarium experiment inwhich <strong>the</strong> q value <strong>of</strong> <strong>the</strong> uptake process is known (thisknown q will be noted as q 1 ). In such an experiment, <strong>the</strong>value <strong>of</strong> 17 D in steady state ( 17 D BSS1 ) will be identical tothat <strong>of</strong> 17 D W , if we choose C = q 1 . By conducting anadditional experiment in which <strong>the</strong> q value <strong>of</strong> <strong>the</strong> uptakeprocess is unknown (this unknown q will be noted as q 2 ),we can calculate <strong>the</strong> value <strong>of</strong> q 2 from <strong>the</strong> 17 O excess insteady state <strong>of</strong> this experiment ( 17 D BSS2 ), by rearrangingequation (12),ð17 D 17 BSS 2 D W Þq 2 ¼ q 1ln 18 : ð13Þð aÞ[27] The value <strong>of</strong> ln( 18 a) for <strong>the</strong> system can be found byrearranging equation (8),ln 18 a ¼ ln 18 R BSS = 18 R W : ð14Þ[28] The right-h<strong>and</strong> side <strong>of</strong> equation (14) is <strong>the</strong> Ln 18 Ovalue <strong>of</strong> ‘‘BSS’’ versus ‘‘W,’’ which is equivalent to <strong>the</strong>terrarium Dole Effect in Ln 18 O terms (<strong>the</strong> value <strong>of</strong> <strong>the</strong> DoleEffect in d 18 O terms is greater by 0.3% if SMOW is <strong>the</strong>reference <strong>and</strong> lower by 0.3% if atmospheric O 2 is <strong>the</strong>reference). Hence, <strong>the</strong> calculation <strong>of</strong> q 2 from equation (13)is identical to <strong>the</strong> solution presented graphically in Figure 2.[29] To estimate q values by <strong>the</strong> method describe above,<strong>the</strong> q value <strong>of</strong> at least one process (q 1 ) must be knownindependently. This value can be found by conductingexperiments in systems in which <strong>the</strong>re is O 2 uptake butno production.2.3. O 2 Removal Only[30] In our dark respiration <strong>and</strong> binary diffusion experiments,O 2 is only removed from <strong>the</strong> system. The change inisotopic composition in such experiments follows <strong>the</strong>Raleigh distillation equation,1717 R W = 17 a18 R W = 18 aD BSS ¼ ln C ln : ð10Þ17R18 ref R refx e ¼ ln x R= x R 0; ð15Þln f
ANGERT ET AL.: BIOLOGICAL EFFECTS ON THREE O 2 ISOTOPES 30 - 5where x R 0 is <strong>the</strong> initial isotope ratio x O 16 O/ 16 O 2 <strong>and</strong> f is <strong>the</strong>remaining 16 O 2 fraction. Substituting equation (15) intoequation (4) yieldsl R ¼17 e¼ g; ð16Þ18ewhere <strong>the</strong> subscript R st<strong>and</strong>s for Raleigh distillation.Equation (16) shows that in a system where <strong>the</strong>re is onlyuptake <strong>of</strong> oxygen, <strong>the</strong> value <strong>of</strong> l is different from <strong>the</strong>value <strong>of</strong> q. The value <strong>of</strong> q in ‘‘removal only’’ experimentscan be calculated by substituting equation (16) intoequation (5),q ¼ ln ð 1 þ l R 18 eÞlnð1 þ 18 eÞ : ð17Þ[31] The range <strong>of</strong> 18 e in biological uptake is 15 to32% <strong>and</strong> <strong>the</strong> value <strong>of</strong> q in mass-dependent fractionationis about 0.5. Hence, l R will be larger by 0.002–0.004 than qin most systems. For O 2 samples close in composition to <strong>the</strong>st<strong>and</strong>ard O 2 , using slightly different C values will notsignificantly affect <strong>the</strong> calculated 17 D. However, for <strong>the</strong>purpose <strong>of</strong> <strong>the</strong> present study where comparisons betweensteady state O 2 <strong>and</strong> its substrate water are necessary, a smalldifference in parameter C becomes significant. To illustrate<strong>the</strong> importance this point, consider a water sample havingLn 18 O= 23% <strong>and</strong> Ln 17 O= 11.7% with respect to airO 2 . Using equation (1) <strong>and</strong> C = 0.52, 17 D <strong>of</strong> this sample iscalculated as 260 per meg. Similar calculation with C =0.524 yields 17 D <strong>of</strong> 352 per meg.3. Experimental Methods3.1. Dark Respiration Experiments[32] Axenic cultures <strong>of</strong> Lemna gibba, a small waterplant, were grown in a nutrient solution. Illumination frommixed fluorescent/inc<strong>and</strong>escent lamps was at an intensity<strong>of</strong> 200 ± 20 mE m 2 s 1 photosyn<strong>the</strong>tic photon flux (PPF),at <strong>the</strong> level <strong>of</strong> <strong>the</strong> fronds, for 12 h d 1 . Air temperaturewas 24°C <strong>and</strong> 19 ± 0.5°C in <strong>the</strong> light <strong>and</strong> dark periods,respectively.[33] The seeds <strong>of</strong> Orobanche aegyptica, an obligatoryroot parasite, were placed in empty tea bags <strong>and</strong> suspendedfor sterilization in 1% solution <strong>of</strong> NaOCl for 5 min. Theseeds were <strong>the</strong>n rinsed thoroughly for 20 min in steriledistilled H 2 O. After <strong>the</strong> rinse, <strong>the</strong> seeds were activated by 3days imbibition in 5 ml <strong>of</strong> H 2 O in 9-cm-diameter Petridishes with one layer <strong>of</strong> Whatman paper, to which a mixture<strong>of</strong> antibiotics was added. The mixture contained 50 mg each<strong>of</strong> streptomycin <strong>and</strong> penicillin G <strong>and</strong> 25 mg <strong>of</strong> chloramphenicol,in order to prevent <strong>the</strong> development <strong>of</strong> bacterialinfections during <strong>the</strong> imbibition period.[34] To determine <strong>the</strong> q value associated with <strong>the</strong> COX,we inhibited <strong>the</strong> AOX in <strong>the</strong> plant samples with 2 mMSalicylhydroxamic acid (SHAM). To determine <strong>the</strong> valueassociated with <strong>the</strong> AOX, we inhibited <strong>the</strong> COX with 1mM NaCN. The inhibitors were added to a closedaerated chamber containing <strong>the</strong> plant samples <strong>and</strong> waterfor at least 90 min before measurements were made.Additional control experiments without inhibitors wereconducted with Lemna <strong>and</strong> natural soil (<strong>the</strong> resulting qvalue was expected to lie between that <strong>of</strong> <strong>the</strong> AOX <strong>and</strong><strong>the</strong> COX).[35] For <strong>the</strong> incubation, about 1 g <strong>of</strong> plant sample wasinserted into 6 cm 3 blood collection tubes (Vacutainers 1 )that were closed with rubber septa. The tubes wereimmersed in water during incubation in order to preventair leaks. After an incubation period <strong>of</strong> 1 to 10 hours, <strong>the</strong> airin <strong>the</strong> tubes was sampled, via a needle, directly to <strong>the</strong>vacuum preparation line. In o<strong>the</strong>r experiments, plant sampleswere incubated in water <strong>and</strong> <strong>the</strong> changes in <strong>the</strong>dissolved oxygen were monitored. At <strong>the</strong> end <strong>of</strong> <strong>the</strong>seexperiments, 120 cm 3 water were sampled in 250 cm 3pre-evacuated flasks closed with a Lowers Happert 1 valve.Sampling <strong>and</strong> extraction <strong>of</strong> <strong>the</strong> dissolved gases were doneaccording to Luz et al. [2002].3.2. Terrarium Experiments[36] We used an airtight terrarium as described by Luz etal. [1999]. The terrarium contained Philodendron plants,soil <strong>and</strong> natural water from Lake Kinneret, Israel (d 18 O=0.5% versus SMOW). It was illuminated by a fluorescentlamp (100 mE m 2 s 1 ) for 24 h d 1 ,10hd 1 ,4hd 1<strong>and</strong> 2 h d 1 in different stages <strong>of</strong> <strong>the</strong> experiment. Differentlight conditions were used to manipulate <strong>the</strong> CO 2concentration in <strong>the</strong> terrarium, which, in turn, affects <strong>the</strong>relative rate <strong>of</strong> <strong>photorespiration</strong> [Badger, 1985]. Theterrarium was also covered <strong>and</strong> darkened for dark incubations.The CO 2 concentration in <strong>the</strong> terrarium air wasdetermined by sampling 6 cm 3 air in pre-evacuated bloodcollection tubes (Vacutainers 1 ), <strong>and</strong> measuring <strong>the</strong> airsample with an infrared gas analyzer (LI-COR-6252 1 )by a method similar to Davidson <strong>and</strong> Trumbore [1995].The relative accuracy for CO 2 concentration measurementwas ±5%.3.3. O 2 -N 2 Diffusion Experiments[37] In <strong>the</strong> diffusion <strong>of</strong> O 2 in N 2 experiments, a 4-cm 3flask was filled with pure oxygen. The neck <strong>of</strong> <strong>the</strong> flask wasfilled with a diffusive medium (plastic sponge) that preventedadvective mixing, <strong>and</strong> <strong>the</strong> oxygen that diffused out<strong>of</strong> <strong>the</strong> tube was immediately removed by a flow <strong>of</strong> N 2 . After1–2 hours, <strong>the</strong> O 2 concentration in <strong>the</strong> flasks was considerablylowered <strong>and</strong> <strong>the</strong> flasks were closed <strong>and</strong> transferredfor isotopic analysis.3.4. Sample Preparation <strong>and</strong> Mass Spectrometry[38] Sampling, sample preparation, <strong>and</strong> mass spectrometrywere according to Angert <strong>and</strong> Luz [2001], Luz et al.[2002], <strong>and</strong> Luz <strong>and</strong> Barkan [2000]. The preparation <strong>of</strong> <strong>the</strong>sample included cryogenic removal <strong>of</strong> water vapor <strong>and</strong> CO 2,<strong>and</strong> chromatographic separation <strong>of</strong> N 2 , which is needed foraccurate 17 D measurements. The samples were frozen at4°K into stainless steel tubes <strong>and</strong> transferred for analysisin a Finnigan Delta-Plus mass-spectrometer. Correctionswere applied in order to account for <strong>the</strong> sensitivity <strong>of</strong>ionization efficiencies <strong>of</strong> <strong>the</strong> three isotopic species tovariations in <strong>the</strong> O 2 /Ar ratio. The analytical error (absolutedifference from <strong>the</strong> average) for d 18 O, dO 2 /Ar, <strong>and</strong> D 17 Owas 0.02%, 0.5% <strong>and</strong> 5 per meg, respectively. All values
30 - 6 ANGERT ET AL.: BIOLOGICAL EFFECTS ON THREE O 2 ISOTOPESThere was no significant difference between <strong>the</strong> l R valuesin <strong>the</strong> incubations <strong>of</strong> Lemna gibba <strong>and</strong> Orobanche aegyptica,nor between different experiments with <strong>the</strong> sameplants. The l R value determined for incubation withoutinhibitors <strong>of</strong> Lemna was 0.517 ± 0.001, <strong>and</strong> a value <strong>of</strong> 0.517± 0.002 was found for <strong>the</strong> natural soil. In <strong>the</strong> two diffusionexperiments we found l R value <strong>of</strong> 0.5228 ± 0.0002, with nosignificant difference between <strong>the</strong> experiments.[40] The 17 D, dO 2 /Ar, Ln 18 O <strong>and</strong> [CO 2 ] <strong>of</strong> <strong>the</strong> terrariumair in <strong>the</strong> course <strong>of</strong> <strong>the</strong> experiment are presented in Table 2<strong>and</strong> shown in Figure 4. In days 1–58, in which <strong>the</strong>re was a24-hour illumination per day, <strong>the</strong> CO 2 concentrations in <strong>the</strong>terrarium were about 150 ppm. In days 127–178, when <strong>the</strong>illumination was <strong>of</strong> 10 h d 1 ,CO 2 concentration decreasedfrom 4500 ppm in <strong>the</strong> beginning <strong>of</strong> <strong>the</strong> light period to 150ppm, after about 3 hours. In days 184–235 <strong>and</strong> 330–365, inwhich <strong>the</strong>re were 2–4 hours illumination, <strong>the</strong> CO 2 concentrationwere 10,000–40,000 ppm, <strong>and</strong> in days 249–252, inwhich <strong>the</strong>re were 4 hours <strong>of</strong> illumination, CO 2 decreased toabout 150 ppm after 2–3 hours <strong>of</strong> illumination. The isotopicdiscrimination ( 18 e) that was calculated from <strong>the</strong> darkperiods (days 183–184 <strong>and</strong> 283–285) is 16.7%.Figure 3. Relative changes in <strong>the</strong> triple isotopic composition<strong>of</strong> O 2 (plotted as Ln 17 O versus Ln 18 O in per mils) asresult <strong>of</strong> (a) uptake through <strong>the</strong> COX, (b) uptake through <strong>the</strong>AOX, <strong>and</strong> (c) removal by diffusion into N 2 . The slope <strong>of</strong> <strong>the</strong>fitted regression line is l, <strong>and</strong> <strong>the</strong> reported precisionaccuracy is st<strong>and</strong>ard error. The values <strong>of</strong> q are calculatedaccording to equation (17).are reported with respect to <strong>the</strong> atmospheric O 2 (HLAst<strong>and</strong>ard).4. Results[39] The results <strong>of</strong> <strong>the</strong> dark incubation <strong>and</strong> <strong>the</strong> diffusion<strong>of</strong> O 2 in N 2 experiments, are illustrated in Figure 3, <strong>and</strong>summarized in Table 1. The isotopic discrimination ( 18 e)was calculated by equation (15) from <strong>the</strong> results <strong>of</strong> <strong>the</strong> darkincubation experiments. As expected, higher fractionationfor each plant species was measured when <strong>the</strong> plants wereinhibited with NaCN, <strong>and</strong> lower fractionation when <strong>the</strong>plants were inhibited with SHAM. Considerably loweruptake rates were measured when <strong>the</strong> plant was inhibitedwith NaCN (data not shown). The value <strong>of</strong> l R in <strong>the</strong>seexperiments was determined from <strong>the</strong> Ln 17 O versus Ln 18 Oaccording to equation (4). The l R values that were found are0.518 ± 0.001 for <strong>the</strong> COX, 0.5179 ± 0.0003 for <strong>the</strong> AOX.5. Discussion5.1. Dark Incubation Experiments <strong>and</strong> Diffusion inLiquid Phase[41] The value <strong>of</strong> q was calculated from <strong>the</strong> measured l Rvalues by equation (17). The fractionations ( 17 e <strong>and</strong> 18 e)arestrongly controlled by <strong>the</strong> effects <strong>of</strong> slow diffusion to <strong>the</strong>consumption site [Angert <strong>and</strong> Luz, 2001; Guy et al., 1989].However, <strong>the</strong> value <strong>of</strong> l R in our experiments can be shownto be independent <strong>of</strong> such effects. The overall fractionation<strong>of</strong> a system in which <strong>the</strong> oxygen supply is limited bydiffusion is given byx e ¼ x e diff þ ð x e x con e diff ÞC i =C a ; ð18Þtaken from Farquhar et al. [1982], where x e is <strong>the</strong> overallfractionation, x e con is <strong>the</strong> fractionation in consumption, x e diffTable 1. Summary <strong>of</strong> Dark Incubation Experiments <strong>and</strong> DiffusionExperiments a Inhibitor n l SE e SEOrobanche aegyptica SHAM 3 0.517 0.003 14.5 0.9Orobanche aegyptica SHAM 4 0.520 0.006 14.2 0.7Lemna gibba SHAM 7 0.518 0.003 20.7 0.1Lemna gibba SHAM 7 0.518 0.002 19.6 0.2Lemna (in water) SHAM 8 0.518 0.001 14.1 0.4COX 29 0.518 0.001Orobanche aegyptica NaCN 4 0.516 0.002 18.5 0.9Orobanche aegyptica NaCN 5 0.517 0.002 21.5 1.4Lemna gibba NaCN 6 0.5181 0.0003 27.9 0.1Lemna gibba NaCN 6 0.518 0.001 27.1 0.2AOX 21 0.5179 0.0003Lemna gibba - 4 0.517 0.001 20.1 0.3Soil - 4 0.517 0.002 16.6 0.3Diffusion in N 2 - 6 0.5226 0.0004 14.9 0.1Diffusion in N 2 - 6 0.5231 0.0003 - -Diffusion in N 2 12 0.5228 0.0002a Abbreviations: n, number <strong>of</strong> data points; SE, st<strong>and</strong>ard error.
ANGERT ET AL.: BIOLOGICAL EFFECTS ON THREE O 2 ISOTOPES 30 - 7Table 2. Summary <strong>of</strong> <strong>the</strong> Terrarium ExperimentDayDO 2 /ArVersus Atm, aD 18 Oversus Atm, aLn 18 Oversus Water b17 Dversus Atm, aLight, CO 2 ,hd 1 ppmCO 2 ,
30 - 8 ANGERT ET AL.: BIOLOGICAL EFFECTS ON THREE O 2 ISOTOPESwill be an intermediate value between <strong>the</strong> q <strong>of</strong> COX <strong>and</strong> that<strong>of</strong> diffusion. Such a situation occurs in soils in general (<strong>and</strong>also <strong>the</strong> soil in our terrarium experiments), in whichfractionation <strong>of</strong> entering O 2 by diffusion in air has beenshown to have strong effects [Angert et al., 2001]. Since soilrespiration is an important component <strong>of</strong> <strong>the</strong> oxygen cycle,such an effect should be considered in any attempt toestimate <strong>the</strong> terrarium or global q.[46] The effective fractionation <strong>of</strong> a system in which <strong>the</strong>oxygen supply is limited by diffusion is given by equation(18). We can estimate <strong>the</strong> effective q for different C i /C aratios by calculating <strong>the</strong> 17 e <strong>and</strong> 18 e using this equation.Oxygen concentration in soils vary widely with soil depth,soil type, soil moisture, <strong>and</strong> rate <strong>of</strong> respiration in <strong>the</strong> soil.However, most <strong>of</strong> <strong>the</strong> soil respiration takes place at <strong>the</strong> top<strong>of</strong> <strong>the</strong> soil pr<strong>of</strong>ile. Hence, it will be justified to assume that<strong>the</strong> C i /C a ratio for weighted average soil respiration is notsmaller than 0.9. This value corresponds to about 20,000ppm <strong>of</strong> CO 2 , which is in <strong>the</strong> upper range <strong>of</strong> <strong>the</strong> concentrationsin soils. Even for this high value, <strong>the</strong> effective q is0.5164, only 0.0004 larger than that <strong>of</strong> COX <strong>and</strong> within <strong>the</strong>margin <strong>of</strong> error <strong>of</strong> its assessment. This effect might becompensated if some <strong>of</strong> <strong>the</strong> consumption in soil respirationis through <strong>the</strong> AOX, in which q is lower than in <strong>the</strong> COX.Thus, <strong>the</strong> effect <strong>of</strong> diffusion on <strong>the</strong> effective q in soils isvery small. Confirmation for that comes from <strong>the</strong> l value(0.517 ± 0.001) that was measured in natural soil, in whichdiffusion limitation was indicated by relatively weak fractionation( 18 e = 16%). In summary, effects <strong>of</strong> diffusion inair through soil pr<strong>of</strong>iles can be neglected in <strong>the</strong> discussion<strong>of</strong> <strong>the</strong> global triple isotope balance as well as <strong>the</strong> isotopicbalance in <strong>the</strong> terrarium. Additional diffusion limitations insoils occur in liquid phase, but, as shown in <strong>the</strong> previoussection, <strong>the</strong> effect on <strong>the</strong> triple isotopic composition isnegligible.Figure 4. Summary <strong>of</strong> <strong>the</strong> terrarium experiment results.Shown in <strong>the</strong> markers are <strong>the</strong> variations in (a) 17 D versus <strong>the</strong>atmosphere in per megs (with C = 0.516), (b) Ln 18 O in permils versus <strong>the</strong> terrarium water, <strong>and</strong> (c) dO 2 /Ar in per milsversus <strong>the</strong> atmosphere. The solid line shows <strong>the</strong> hours perday in which <strong>photorespiration</strong> was engaged due to low CO 2concentration (5000 ppm) throughout <strong>the</strong> day <strong>and</strong> <strong>the</strong> average17 D was 215 ± 14 per meg. In <strong>the</strong> second interval (‘‘Low’’),
ANGERT ET AL.: BIOLOGICAL EFFECTS ON THREE O 2 ISOTOPES 30 - 9<strong>the</strong> terrarium was illuminated for 24 h d 1 ,CO 2 concentrationwas low (150 ppm), <strong>and</strong> <strong>the</strong> average 17 D was 93 ±6 per meg. In <strong>the</strong> third interval (‘‘Variable’’), <strong>the</strong> terrariumwas illuminated for 10 h d 1 <strong>and</strong> <strong>the</strong> CO 2 concentrationchanged with <strong>the</strong> illumination. The plant was exposed toCO 2 levels below 500 ppm, while illuminated, for about 7hours per day. The average 17 D in this interval was 145 ± 6per meg. Similar dependence <strong>of</strong> <strong>the</strong> D 17 O values inillumination can be seen in <strong>the</strong> terrarium experiments <strong>of</strong>Luz et al. [1999]. Although <strong>the</strong>re is no CO 2 concentrationdata for <strong>the</strong>se experiments, <strong>the</strong> relationship between illumination<strong>and</strong> CO 2 were probably similar to <strong>the</strong> relationships in<strong>the</strong> current experiment.[49] The different D 17 O values in steady state indicatechanges in <strong>the</strong> average q <strong>of</strong> <strong>the</strong> terrarium (Figure 2).These changes indicate variations in <strong>the</strong> relative rates <strong>of</strong>different processes in <strong>the</strong> terrarium, each with its characteristicq. The difference between <strong>the</strong> q <strong>of</strong> COX <strong>and</strong> AOXwe report here is only 0.002. Thus, even if <strong>the</strong> entireuptake in <strong>the</strong> terrarium was shifted from COX to AOX,which is not very likely, it will only cause a lowering <strong>of</strong>17 D <strong>of</strong> about 50 per meg (according to equation (12)).Therefore, <strong>the</strong> change <strong>of</strong> 122 per meg in 17 D betweenintervals ‘‘High’’ <strong>and</strong> ‘‘Low’’ cannot be explained bychanges in <strong>the</strong> ratio between COX <strong>and</strong> AOX. It can beexplained by an increase in <strong>the</strong> importance <strong>of</strong> a process(or processes) in which q is considerably smaller than indark respiration. Because lowering <strong>of</strong> q occurs when CO 2concentration is low, <strong>photorespiration</strong> is a likely mechanism.Ano<strong>the</strong>r process that might be activated in <strong>the</strong> lightis <strong>the</strong> Mehler reaction. Whe<strong>the</strong>r or not this is an importantmechanism is debatable, but preliminary experiments inour laboratory indicate that <strong>the</strong> q value in Mehler reactionis relatively high (Y. Helman, unpublished results, 2002),<strong>and</strong> hence this reaction could not be responsible for <strong>the</strong>lowering <strong>of</strong> <strong>the</strong> terrarium q in <strong>the</strong> light. In addition, in arecent review, Badger et al. [2000] argue that O 2 uptakeby Mehler reaction is <strong>of</strong> small importance in higherplants.[50] When CO 2 concentration in <strong>the</strong> terrarium was highthroughout <strong>the</strong> day (interval ‘‘High’’), <strong>photorespiration</strong> wasinhibited <strong>and</strong> <strong>the</strong> average q was controlled by COX <strong>and</strong>AOX alone. Since <strong>the</strong> q values <strong>of</strong> COX <strong>and</strong> AOX are close(0.516 <strong>and</strong> 0.514, respectively), <strong>and</strong> usually most <strong>of</strong> <strong>the</strong>respiration takes place through <strong>the</strong> COX, we assume that <strong>the</strong>average q in interval ‘‘High’’ (‘‘q 1 ’’) was 0.516. Since q 1 isequal to C, <strong>the</strong> 17 D W <strong>of</strong> <strong>the</strong> terrarium water is equal to17 D BSS in interval ‘‘High’’ (see equation (12)), 215 per megon average. In interval ‘‘Variable,’’ <strong>the</strong> CO 2 concentrationwas low enough to allow <strong>photorespiration</strong> in part <strong>of</strong> <strong>the</strong> day<strong>and</strong> D 17 O dropped from 215 to 145 per meg, <strong>and</strong> it wentdown even fur<strong>the</strong>r to 93 per meg, in interval ‘‘Low,’’ whenlow CO 2 concentration <strong>and</strong> illumination were present for 24hours per day (Figure 5).[51] By using <strong>the</strong> value <strong>of</strong> 215 for 17 D W <strong>and</strong> 18 e <strong>of</strong> 24%(see section 5.5) in equation (13), we calculated an averageq for interval ‘‘Low’’ (‘‘q 2 ’’) <strong>of</strong> 0.511. This value <strong>of</strong> q 2represents a weighted average for both dark respiration <strong>and</strong><strong>photorespiration</strong>. This clearly indicates that <strong>the</strong> q value <strong>of</strong><strong>photorespiration</strong> must be significantly less than 0.516. AFigure 5. Analysis <strong>of</strong> <strong>the</strong> terrarium experiments (not toscale). In interval ‘‘High,’’ <strong>photorespiration</strong> was inhibited asa result <strong>of</strong> high CO 2 concentrations <strong>and</strong> <strong>the</strong> relationshipbetween <strong>the</strong> fractionations was controlled by dark respiration(q 1 = 0.516). In Interval ‘‘Low,’’ both dark respiration<strong>and</strong> <strong>photorespiration</strong> (PR) were engaged (q 2 = 0.511). Toaccount for such an effect, <strong>the</strong> q <strong>of</strong> <strong>photorespiration</strong> must belower than 0.511, <strong>and</strong> it can be calculated from <strong>the</strong> relativerates <strong>of</strong> dark respiration <strong>and</strong> <strong>photorespiration</strong> as 0.506.quantitative estimate <strong>of</strong> <strong>the</strong> q value for <strong>photorespiration</strong> willbe derived in section 5.6.5.4. Deviations From Steady State[52] While <strong>the</strong> 17 D <strong>of</strong> <strong>the</strong> terrarium air was in steady statein intervals ‘‘Low,’’ ‘‘Variable’’ <strong>and</strong> ‘‘High,’’ <strong>the</strong> dO 2 /Arvalues were constant only through interval ‘‘Low.’’ Inintervals ‘‘Variable’’ <strong>and</strong> ‘‘High,’’ <strong>the</strong> O 2 concentrationincreased with time, indicating a net production in <strong>the</strong>terrarium. To study <strong>the</strong> effect <strong>of</strong> this net production on <strong>the</strong>17 D, we used a simple numerical model. This model dealswith <strong>the</strong> fluxes <strong>of</strong> production <strong>and</strong> uptake <strong>of</strong> <strong>the</strong> differentisotopic species without <strong>the</strong> steady state assumption. Thetemporal concentration <strong>of</strong> isotopic species is given byequation (19) where Dt st<strong>and</strong>s for time interval.x O 16 Ot þDt ¼ x O 16 Ot þ Dt 16 P x R W16 U x R t x a : ð19Þ[53] As expected, running <strong>the</strong> model with 16 U =16 P <strong>and</strong> q =C gave identical result to <strong>the</strong> analytical model (equation(12)); hence, when <strong>the</strong> value <strong>of</strong> 17 D reached a plateau(equivalent to 17 D BSS in <strong>the</strong> analytical model), it was equalto that <strong>of</strong> 17 D W . However, running <strong>the</strong> model with production( 16 P) that is higher <strong>the</strong>n uptake ( 16 U) resulted in 17 Dvalues in a plateau slightly higher <strong>the</strong>n 17 D W . For example,running <strong>the</strong> model with 16 U/ 16 P ratio <strong>of</strong> 0.5 <strong>and</strong> 17 D W <strong>of</strong>211 per meg resulted in 17 D in a plateau <strong>of</strong> 221 per meg. Toestimate uptake in interval ‘‘High,’’ we assumed that it wasidentical to <strong>the</strong> uptake rate in <strong>the</strong> dark periods (<strong>the</strong> oxygendepletion rate). This assumption is probably true since <strong>the</strong>high CO 2 levels in interval ‘‘High’’ inhibited <strong>photorespiration</strong>.From this uptake rate <strong>and</strong> <strong>the</strong> observed net production(rate <strong>of</strong> increase in O 2 concentration), we found <strong>the</strong> ratio <strong>of</strong>uptake to production was 0.9 for interval ‘‘High.’’ Using
30 - 10 ANGERT ET AL.: BIOLOGICAL EFFECTS ON THREE O 2 ISOTOPESthis value in <strong>the</strong> numerical model, we found that thisdeviation from steady state will cause an increase <strong>of</strong> 4per meg in <strong>the</strong> value <strong>of</strong> 17 D, when it reached a plateau.Thus, 17 D W is 211 per meg instead <strong>of</strong> <strong>the</strong> 215 per megcalculated based on <strong>the</strong> steady state assumption. Thiscorrection for 17 D W is small with respect to o<strong>the</strong>r uncertainties<strong>and</strong> does not significantly change <strong>the</strong> value calculatedfor q 2 (0.511).[54] Ano<strong>the</strong>r nonsteady state effect results from <strong>the</strong> diurnalillumination cycle in <strong>the</strong> terrarium. Photosyn<strong>the</strong>sis tookplace in <strong>the</strong> few hours <strong>of</strong> illumination, while <strong>the</strong> uptakethrough dark respiration continued all day, <strong>and</strong> as a result<strong>the</strong> O 2 concentration fluctuated. By modeling this conditionin <strong>the</strong> numerical model, we found that it will cause <strong>the</strong> 17 Dvalue to fluctuate around <strong>the</strong> value 17 D BSS . The amplitude<strong>of</strong> <strong>the</strong> fluctuations in 17 D depends on <strong>the</strong> amplitude <strong>of</strong> <strong>the</strong>fluctuations in O 2 concentration. For interval ‘‘High,’’ wecan calculate from <strong>the</strong> dark periods that dark respirationconsumed about 9% <strong>of</strong> <strong>the</strong> O 2 reservoir <strong>of</strong> <strong>the</strong> terrarium perday. Using this value <strong>and</strong> <strong>the</strong> value <strong>of</strong> 0.9 for uptake toproduction ratio, <strong>the</strong> calculated magnitude <strong>of</strong> <strong>the</strong> 17 Dfluctuations resulting from <strong>the</strong> light-dark cycle is ±2 permeg. Again, this value is considerably smaller than <strong>the</strong>analytical uncertainty, <strong>and</strong> <strong>the</strong>refore this effect can be alsoneglected.5.5. Dependence <strong>of</strong> 18 E on Illumination <strong>and</strong> [CO 2 ]:Implication for <strong>the</strong> Dole Effect[55] The weighted-average 18 e <strong>of</strong> all <strong>the</strong> processes in <strong>the</strong>terrarium can be estimated from <strong>the</strong> terrarium equivalent <strong>of</strong><strong>the</strong> global Dole Effect (equation (14)), which is <strong>the</strong> value <strong>of</strong>Ln 18 O <strong>of</strong> ‘‘BSS’’ versus ‘‘W.’’ The Ln 18 O values <strong>of</strong> <strong>the</strong>terrarium air versus <strong>the</strong> value <strong>of</strong> <strong>the</strong> substrate water arepresented in Figure 4b. In <strong>the</strong> three intervals in which <strong>the</strong>17 D <strong>of</strong> <strong>the</strong> terrarium was constant, <strong>the</strong> Ln 18 O was almostconstant.[56] In interval ‘‘High,’’ <strong>the</strong> fractionation (e) in <strong>the</strong>terrarium according to equation (14) is 18.4 ± 1.8%, ininterval ‘‘Low’’ 23.9 ± 0.5%, <strong>and</strong> in interval ‘‘Variable’’21.7 ± 0.2%. The fractionation in interval ‘‘High’’ is inagreement with <strong>the</strong> known fractionation for <strong>the</strong> COX,18% [Guy et al., 1989], <strong>and</strong> with <strong>the</strong> fractionation thatwas calculated for <strong>the</strong> dark periods 16.7%. This agreementindicates that, as was assumed in section 5.3., <strong>the</strong>uptake in <strong>the</strong> terrarium was dominated by COX in interval‘‘High’’ in which <strong>the</strong> CO 2 concentration was high.[57] The fractionation by COX is 18%, in <strong>photorespiration</strong>it is 21.7%, <strong>and</strong> that <strong>of</strong> AOX is about30% [Ribas-Carbo et al., 2000]. Thus, <strong>photorespiration</strong><strong>and</strong> COX alone cannot explain <strong>the</strong> high Ln 18 O valuesmeasured in interval ‘‘Low’’ <strong>and</strong> interval ‘‘Variable.’’These high values seem to indicate that a considerableportion <strong>of</strong> <strong>the</strong> uptake was through <strong>the</strong> AOX. Since ininterval ‘‘Variable’’ <strong>the</strong>re was net production that introducedoxygen with light isotopic composition, <strong>the</strong> fractionationmust have been even stronger than that calculatedabove for <strong>the</strong> same interval according to <strong>the</strong> steady stateassumption ( 21.7%). The fractionation in interval‘‘Low’’ was extremely strong. The relative rate <strong>of</strong> uptakethrough <strong>the</strong> AOX in this interval was estimated from <strong>the</strong>observed Ln 18 O values in section 5.6. as 41–31% <strong>of</strong>gross production.[58] Some enrichment <strong>of</strong> <strong>the</strong> terrarium leaf water byevapotranspiration might have contributed to <strong>the</strong> highLn 18 O. However, since <strong>the</strong> relative humidity in <strong>the</strong> terrariumwas 100% this effect was probably very small. In fact,no enrichment was found when we compared <strong>the</strong> d 18 O<strong>of</strong><strong>the</strong> terrarium free water <strong>and</strong> <strong>the</strong> terrarium leaf water (datanot shown). However, this result might originate frommeasuring total leaf water, which includes depleted veinwater. Even if we assume that <strong>the</strong> enrichment at <strong>the</strong> site <strong>of</strong>photosyn<strong>the</strong>sis was as high as 1%, our main conclusionswill remain <strong>the</strong> same. The relative rate <strong>of</strong> <strong>the</strong> AOX ininterval ‘‘Low’’ will be 19–29%, still a very high figure,<strong>and</strong> <strong>the</strong> correction to q P (see section 5.6) will be muchsmaller than <strong>the</strong> o<strong>the</strong>r uncertainties.[59] The strong measured fractionation indicates that <strong>the</strong>AOX was activated in <strong>the</strong> same conditions that favorhigh rate <strong>of</strong> <strong>photorespiration</strong>-illumination <strong>and</strong> low CO 2 .This finding is in agreement with <strong>the</strong> indication for highAOX rates in <strong>the</strong> light inferred from in situ measurementsin a lake [Luz et al., 2002]. The CO 2 concentrationin <strong>the</strong> terrarium were very low (150 ppm), much lowerthan in most natural environments. However, since <strong>the</strong>relative humidity in terrarium was 100% stomatal conductancemust have been high. Consequently, <strong>the</strong> internalCO 2 concentration in <strong>the</strong> leaves was similar to that <strong>of</strong>midday in many natural environments. Since strongfractionation occurred not only with <strong>the</strong> 24 h d 1 illuminationbut also with <strong>the</strong> 10 h d 1 illumination, which iscloser to <strong>the</strong> natural cycle, we conclude that <strong>the</strong> engagement<strong>of</strong> <strong>the</strong> AOX in <strong>the</strong> light is likely also in manynatural systems.[60] In previous models <strong>of</strong> <strong>the</strong> Dole Effect, <strong>the</strong> global rate<strong>of</strong> <strong>the</strong> AOX was assumed to be very low <strong>and</strong> was neglected[Bender et al., 1994; Malaize et al., 1999]. This low rate isbased on measurements <strong>of</strong> <strong>the</strong> AOX activity in <strong>the</strong> dark.However, if <strong>the</strong> AOX activation is enhanced in illuminatedleaves in natural systems, <strong>the</strong>n its global rate should beconsiderably higher. This higher rate may help to close <strong>the</strong>gap between <strong>the</strong> calculated value <strong>of</strong> <strong>the</strong> Dole Effect (20.8%[Bender et al., 1994]) <strong>and</strong> <strong>the</strong> measured one (23.5%[Kroopnick <strong>and</strong> Craig, 1972]), <strong>and</strong> compensate for <strong>the</strong>weak fractionation recently reported for soil respiration[Angert et al., 2001]. The connection between <strong>photorespiration</strong><strong>and</strong> AOX might also explain past changes in <strong>the</strong> DoleEffect. Increased rate <strong>of</strong> <strong>photorespiration</strong> will be coupledwith an increased rate <strong>of</strong> AOX. Drier <strong>and</strong> hotter climate isexpected to cause an increased rate <strong>of</strong> <strong>photorespiration</strong>, aswell as more evapotranspiration that will result in 18 Oenriched leaf water. Thus, such climate will cause anincreased Dole Effect by both heavier composition <strong>of</strong> leafwater <strong>and</strong> increased rate <strong>of</strong> <strong>photorespiration</strong> <strong>and</strong> <strong>the</strong> AOX,two processes that have high fractionation relative to that <strong>of</strong>COX.5.6. Estimating <strong>the</strong> Q <strong>of</strong> Photorespiration[61] The average q in <strong>the</strong> terrarium in interval ‘‘Low’’ was0.511. This value <strong>and</strong> <strong>the</strong> values found for <strong>the</strong> AOX <strong>and</strong>COX, can be used to estimate <strong>the</strong> q associated with photo-
ANGERT ET AL.: BIOLOGICAL EFFECTS ON THREE O 2 ISOTOPES 30 - 11respiration by assuming production uptake steady state, <strong>and</strong>a simple weighted average equation,GP ¼ U P þ U COX þ U AOXð20Þ0:511 ¼ ðq P U P þ 0:516U COX þ 0:514U AOX Þ=GP; ð21Þwhere GP is gross production in <strong>the</strong> terrarium, U st<strong>and</strong>s foruptake, <strong>and</strong> <strong>the</strong> subscript P st<strong>and</strong>s for <strong>photorespiration</strong>. Inorder to solve equation (20) for q P <strong>the</strong> rates <strong>of</strong> <strong>the</strong> differentuptake <strong>pathway</strong>s in <strong>the</strong> terrarium relative to gross productionmust be estimated.[62] The gross oxygen production in <strong>the</strong> terrarium, atinterval ‘‘Low,’’ can be estimated from previous experimentsin <strong>the</strong> same terrarium [Luz et al., 1999]. In one <strong>of</strong><strong>the</strong>se experiments <strong>the</strong> d 18 O <strong>of</strong> <strong>the</strong> water was 6.6% (onSMOW scale). As a result, <strong>the</strong> d 18 O value in steady statewas very different from <strong>the</strong> initial atmospheric value. At <strong>the</strong>beginning <strong>of</strong> <strong>the</strong> experiment (days 1–37, illumination <strong>of</strong>24 h d 1 , as at interval ‘‘Low’’), changes in <strong>the</strong> d 18 O <strong>and</strong>dO 2 /Ar <strong>of</strong> <strong>the</strong> terrarium were observed, when it approachedsteady state. The changes in <strong>the</strong> d 18 O <strong>and</strong> dO 2 /Ar weremodeled by <strong>the</strong> numerical model described in section 5.4.The best fit to <strong>the</strong> observed data was reached with uptake togross production ratio <strong>of</strong> 0.99 <strong>and</strong> gross production rate(GP) that is 19.2% <strong>of</strong> <strong>the</strong> terrarium O 2 reservoir per day.[63] The uptake rate measured in <strong>the</strong> dark periods was45% <strong>of</strong> <strong>the</strong> GP estimated above, <strong>and</strong> was probably mostlythrough <strong>the</strong> COX. When <strong>the</strong> terrarium was illuminated,considerable portion <strong>of</strong> <strong>the</strong> total dark respiration must havebeen through <strong>the</strong> AOX (section 5.5.); hence, <strong>the</strong> rate <strong>of</strong>COX in interval ‘‘Low’’ was lower than 45% <strong>of</strong> GP. If weassume a COX <strong>of</strong> 10–30% <strong>of</strong> GP, <strong>the</strong> rate <strong>of</strong> <strong>photorespiration</strong>(U P ) can be calculated from <strong>the</strong> known fractionations <strong>of</strong><strong>the</strong> different <strong>pathway</strong>s <strong>and</strong> <strong>the</strong> terrarium-fractionation ( 18 e)we evaluated for interval ‘‘Low’’ ( 24%) by equation (20)<strong>and</strong> a weighted average equation similar to equation (21),24 ¼ ðe P U P þ e COX U COX þ e AOX U AOX Þ=GP:ð22Þ[64] Using fractionation values <strong>of</strong> 30% for AOX[Ribas-Carbo et al., 2000], 18% for COX [Guy et al.,1989], <strong>and</strong> 21.8% for <strong>photorespiration</strong> U P was calculatedas 29–59% <strong>of</strong> GP. The corresponding rate <strong>of</strong> AOX is 41–31% <strong>of</strong> GP. According to <strong>the</strong>se rates <strong>and</strong> <strong>the</strong> q values <strong>of</strong> <strong>the</strong>COX <strong>and</strong> <strong>the</strong> AOX, <strong>the</strong> q associated with <strong>photorespiration</strong> iscalculated as 0.506 ± 0.003. The error margin is based onlyon <strong>the</strong> uncertainty in <strong>the</strong> rate <strong>of</strong> <strong>the</strong> COX, <strong>and</strong> neglects <strong>the</strong>uncertainty in <strong>the</strong> fractionations <strong>of</strong> <strong>the</strong> different <strong>pathway</strong>s.The uncertainty in <strong>the</strong> fractionation in <strong>the</strong> COX <strong>and</strong> <strong>photorespiration</strong>is small [Guy et al., 1989, 1993]; however <strong>the</strong>uncertainty in <strong>the</strong> fractionation <strong>of</strong> <strong>the</strong> AOX is larger, about±2% for green tissue [Ribas-Carbo et al., 2000; Robinsonet al., 1992]. Including this uncertainty <strong>the</strong> q associated with<strong>photorespiration</strong> is 0.506 ± 0.005.[65] In <strong>photorespiration</strong>, O 2 is consumed by two enzymes,Rubisco <strong>and</strong> glycolate-oxidase. Hence, <strong>the</strong> q value <strong>of</strong> <strong>photorespiration</strong>represents <strong>the</strong> weighted average <strong>of</strong> <strong>the</strong> two consumptionprocesses. Fur<strong>the</strong>r study is necessary in order toderive <strong>the</strong> q values associated with each <strong>of</strong> <strong>the</strong> two enzymes.Figure 6. Analysis <strong>of</strong> triple isotopic composition (not toscale) <strong>of</strong> <strong>the</strong> Last Glacial Maximum (LGM). The point thatrepresents <strong>the</strong> LGM atmosphere (after correction for lowerrate <strong>of</strong> stratospheric photochemistry) lies 12 per meg lowerthan <strong>the</strong> present atmosphere. A change in <strong>the</strong> global averageq (q b ) will affect <strong>the</strong> triple isotopic composition <strong>of</strong> <strong>the</strong>atmosphere in a way that is similar to <strong>the</strong> way a change in qaffected <strong>the</strong> terrarium air (Figure 5). Hence, a change in q bwill cause a change in <strong>the</strong> atmospheric 17 D with amagnitude <strong>of</strong> <strong>the</strong> Ln 18 O difference between atmosphericO 2 <strong>and</strong> photosyn<strong>the</strong>tic oxygen times <strong>the</strong> difference in q b .Thus, a change <strong>of</strong> 0.001 in q b will result in a change <strong>of</strong>about 19 per meg in <strong>the</strong> atmospheric 17 D. The higher globalrates <strong>of</strong> <strong>photorespiration</strong> (PR) in <strong>the</strong> LGM (27% <strong>of</strong> globalproduction instead <strong>of</strong> 24% today) caused lowering <strong>of</strong> q b thatcan explain 5 per meg <strong>of</strong> <strong>the</strong> 12 per meg difference. The rest<strong>of</strong> this difference can be attributed to lower global grossproduction.[66] The q value <strong>of</strong> 0.506 ± 0.005 we report here for<strong>photorespiration</strong> is considerably lower than that <strong>of</strong> both darkrespiration <strong>pathway</strong>s. In <strong>the</strong> next section, we will use thisvalue to estimate <strong>the</strong> effect <strong>of</strong> <strong>photorespiration</strong> on <strong>the</strong> tripleisotopic composition <strong>of</strong> <strong>the</strong> atmosphere.5.7. Implication for <strong>the</strong> Triple Isotopic Composition <strong>of</strong>Atmospheric O 2[67] In order to estimate how a change in <strong>the</strong> globalaverage q <strong>of</strong> biological processes will affect <strong>the</strong> tripleisotopecomposition <strong>of</strong> <strong>the</strong> atmosphere, we can analyze itin a graphical approach presented in Figure 6, or with arigorous analytical model. In this model, <strong>the</strong> troposphere(which is well mixed relatively to <strong>the</strong> lifetime <strong>of</strong> oxygen init) is represented by one box, <strong>and</strong> O 2 is exchanged between<strong>the</strong> biosphere, <strong>the</strong> troposphere, <strong>and</strong> <strong>the</strong> stratosphere. Insteady state we can write <strong>the</strong> following equation:y Sy T þ y Py U ¼ 0;ð23Þwhere y S is <strong>the</strong> stratosphere to troposphere flux <strong>and</strong> y Trepresent <strong>the</strong> flux from <strong>the</strong> troposphere to <strong>the</strong> stratosphere
30 - 12 ANGERT ET AL.: BIOLOGICAL EFFECTS ON THREE O 2 ISOTOPES<strong>of</strong> any isotopic species ( y O 16 O, y = 16,17,18). Flux y Prepresents global photosyn<strong>the</strong>tic production <strong>and</strong> y U isglobal uptake <strong>of</strong> any isotopic species. In <strong>the</strong> model, <strong>the</strong>transfer <strong>of</strong> O 2 to <strong>the</strong> stratosphere involves no fractionation<strong>and</strong> O 2 reentering <strong>the</strong> troposphere is fractionated by x a s (asin <strong>the</strong> work <strong>of</strong> Blunier et al. [2002]). The relationshipbetween 18 a s <strong>and</strong> 17 a s is given by q s . The parameter x a sdescribes <strong>the</strong> sum <strong>of</strong> stratospheric effects on O 2 isotopes,<strong>and</strong> does not represent any single physical process. Theglobal average isotopic ratio <strong>of</strong> oxygen produced fromwater by photosyn<strong>the</strong>sis will be noted as x R AW . The isotopiccomposition <strong>of</strong> leaf water (which is <strong>the</strong> substrate forphotosyn<strong>the</strong>sis on l<strong>and</strong>) is controlled by <strong>the</strong> hydrologicalcycle <strong>and</strong> evapotranspiration. However, since informationon <strong>the</strong> different q’s in <strong>the</strong> hydrological cycle is scarce[Meijer <strong>and</strong> Li, 1998; Miller, 2002] <strong>and</strong> since <strong>the</strong>re is noinformation about <strong>the</strong> q <strong>of</strong> evapotranspiration, we willassume an average isotopic ratio for all <strong>the</strong> oxygenproduced by photosyn<strong>the</strong>sis <strong>and</strong> will not deal directly withdifferences in <strong>the</strong> substrate water. This average isotopic ratiois assumed to be constant in time. The average globalfractionation in biological uptake is given by x a b <strong>and</strong> q b .Wealso assume 16 T = 16 S <strong>and</strong> 16 P = 16 U. Including <strong>the</strong>seformulations in equation (23) gives16 S x R T ð1Þþ 16 P x R 16 AW P x a b x R T ¼ 0; ð24Þx a swhere x can be 17 or 18, <strong>and</strong> <strong>the</strong> subscript ‘‘T’’ st<strong>and</strong>s fortropospheric oxygen.[68] According to equation (1), <strong>the</strong> 17 D <strong>of</strong> tropospheric O 2relative to oxygen produced by photosyn<strong>the</strong>sis is 17 D T AW ¼ ln 17 R T = 17 R AWC ln 18 R T = 18 R AW 10 6 :ð25Þ[69] The value <strong>of</strong> 17 D T-AW is always negative, sincetropospheric O 2 is depleted in 17 O. Equations (24) <strong>and</strong>(25) give17 D T AW ¼ ln16 P16P 17 a16 b S ð17 a s 1Þ16 PC ln16P 18 : ð26Þa16 b S ð18 a s 1Þ[70] The average global q associated <strong>the</strong> biological uptakewill be noted as q b . The difference in <strong>the</strong> tropospheric 17 Dresulting from a change <strong>of</strong> <strong>the</strong> global average q b from q b1 toq b2 is given by substituting equation (26) with equation (5),17 D T W ðq b1 Þ17 D T W ðq b2 Þ¼ln!16 P ð 18 a b Þ qb2 16 S ð17 a s 1Þ:16P ð18 a b Þ qb1 16 S ð17 a s 1Þð27Þ5.7.1. Implications for <strong>the</strong> 17 D in Ice Cores[71] The new q values reported here may change <strong>the</strong>interpretation <strong>of</strong> 17 D measured in ice cores. To demonstratethis, we will use <strong>the</strong> Last Glacial Maximum (LGM) as acase study. According to Blunier et al. [2002], <strong>the</strong> ratio <strong>of</strong><strong>photorespiration</strong> to terrestrial production was 43% in <strong>the</strong>LGM relative to 38% at <strong>the</strong> modern biosphere. This differenceis due to relatively low atmospheric CO 2 concentrationin <strong>the</strong> LGM (since <strong>the</strong> residence time <strong>of</strong> O 2 in <strong>the</strong> atmosphereis 1200 years, <strong>the</strong> preindustrial CO 2 levels are usedfor present), which was partially compensated by anincrease in <strong>the</strong> relative rate <strong>of</strong> photosyn<strong>the</strong>sis in C4 plants.We can apply equation (27) or Figure 6 to estimate <strong>the</strong>effect <strong>of</strong> this different <strong>photorespiration</strong> rate on <strong>the</strong> LGM’s17 D T-AW . By assuming that <strong>the</strong> ratio <strong>of</strong> terrestrial productionto marine production is 1.7 [Blunier et al., 2002] <strong>and</strong> that no<strong>photorespiration</strong> takes place in <strong>the</strong> oceans, we estimate that<strong>the</strong> ratio <strong>of</strong> <strong>photorespiration</strong> to global production is 24% atpresent <strong>and</strong> was 27% in <strong>the</strong> LGM. Using <strong>the</strong> q values fordark respiration <strong>and</strong> <strong>photorespiration</strong> we are reporting here,<strong>and</strong> assuming that 10% <strong>of</strong> dark respiration is through <strong>the</strong>AOX, we calculated that <strong>the</strong> q b in <strong>the</strong> LGM was lower byabout 0.00025 from <strong>the</strong> present value. Assuming <strong>the</strong> AW is40% seawater <strong>and</strong> 60% leaf water <strong>and</strong> using an averageLn 18 O value <strong>of</strong> 23% versus <strong>the</strong> atmosphere for <strong>the</strong> former<strong>and</strong> +6% versus SMOW for <strong>the</strong> later [Gillon <strong>and</strong> Yakir,2001], we calculated <strong>the</strong> average global fractionation ( 18 e b )as 19.4 (0.4 [ 23] + 0.6 [ 23 + 6] = 19.4). Inaddition, we used a 16 P/ 16 S ratio <strong>of</strong> 0.0097 [Luz et al.,1999].[72] Using equation (27), with <strong>the</strong> above parameters wecalculated that <strong>the</strong> effect <strong>of</strong> higher <strong>photorespiration</strong> rates in<strong>the</strong> LGM is expected to cause <strong>the</strong> 17 D <strong>of</strong> <strong>the</strong> LGM troposphereto be lower by 5 ± 2 per meg relative to <strong>the</strong> presenttroposphere (<strong>the</strong> ±2 per meg error margin is derived from<strong>the</strong> uncertainty in <strong>the</strong> q values). This result agrees with <strong>the</strong>simple graphical solution presented at Figure 6 (0.00025 19.4 = 5 per meg). This 5 per meg estimate is insensitive tomost <strong>of</strong> <strong>the</strong> assumptions in <strong>the</strong> calculation, except <strong>the</strong>assumption on <strong>the</strong> variations in <strong>the</strong> global rate <strong>of</strong> <strong>photorespiration</strong>.Hence, this calculation gives <strong>the</strong> order <strong>of</strong>magnitude <strong>of</strong> <strong>the</strong> variation in 17 D that are caused byvariations in global <strong>photorespiration</strong>. To estimate whe<strong>the</strong>ror not this 5 per meg signal is significant, it should becompared to <strong>the</strong> 17 D signal generated by changes in globalproductivity.[73] The D 17 O <strong>of</strong> <strong>the</strong> LGM troposphere relative to <strong>the</strong>present troposphere was measured in air from ice cores <strong>and</strong>was found to be +38 per meg [Blunier et al., 2002; Luz etal., 1999]. This corresponds to a 17 D value <strong>of</strong> +43 per meg(with C <strong>of</strong> 0.516). This value is affected by a lower rate <strong>of</strong>mass-independent stratospheric processes that resultedfrom lower CO 2 concentration in <strong>the</strong> LGM atmosphere.This lower rate resulted in 17 D <strong>of</strong> <strong>the</strong> LGM tropospherehigher by 55 per meg than <strong>the</strong> present value (under <strong>the</strong>assumptions <strong>of</strong> linear dependence <strong>of</strong> <strong>the</strong> stratosphericprocesses rate on CO 2 concentration <strong>and</strong> constant ozoneconcentration [Luz et al., 1999]. There is a 12 per megdifference between <strong>the</strong> +55 per meg expected from <strong>the</strong>lower rate <strong>of</strong> stratospheric processes <strong>and</strong> <strong>the</strong> +43 per megactually measured. This difference was considered inprevious papers [Blunier et al., 2002; Luz et al., 1999]to indicate lower global productivity in <strong>the</strong> LGM. However,as shown above, about half <strong>of</strong> this 12 per meg
ANGERT ET AL.: BIOLOGICAL EFFECTS ON THREE O 2 ISOTOPES 30 - 13change can be explained as <strong>the</strong> result <strong>of</strong> higher <strong>photorespiration</strong>rate in <strong>the</strong> LGM. In conclusion, small changesin <strong>the</strong> global rate <strong>of</strong> <strong>photorespiration</strong> can have an importantimpact on <strong>the</strong> atmospheric 17 D. Consequently, any interpretation<strong>of</strong> triple-isotope ice core data must take thisimpact into account.5.7.2. Global 17 D Budget in <strong>the</strong> Present Atmosphere[74] To gain some insight on <strong>the</strong> global 17 D budget, weestimate <strong>the</strong> parameters <strong>of</strong> equation (26) that represents <strong>the</strong>effects <strong>of</strong> <strong>the</strong> biosphere <strong>and</strong> <strong>the</strong> stratosphere on <strong>the</strong> tripleisotopic composition. The current value <strong>of</strong> q b was calculated,as in <strong>the</strong> previous section, from <strong>the</strong> derived q values<strong>and</strong> <strong>the</strong> estimated global relative rates <strong>of</strong> <strong>photorespiration</strong>(24%), COX (68%) <strong>and</strong> AOX (8%), as 0.513 ± 0.002 (0.24 0.506 + 0.68 0.516 + 0.08 0.514 = 0.513, <strong>the</strong> errormargin is derived from <strong>the</strong> uncertainty in <strong>the</strong> q values).According to Luz et al. [1999] <strong>the</strong> stratospheric massindependentprocesses result in lowering <strong>of</strong> <strong>the</strong> currentatmospheric D 17 O in 117 ± 13 per meg. In <strong>the</strong> terms <strong>of</strong>equation (26) (with 16 P/ 16 S ratio <strong>of</strong> 0.0097 [Luz et al., 1999]<strong>and</strong> q s = 1) this 117 ± 13 per meg lowering corresponds tox a s <strong>of</strong> 0.99999765 ± 0.0000001 assuming 17 D ffi D 17 O <strong>and</strong>18 e b that was calculated in section 5.7.1 as 19.4%. Using<strong>the</strong>se parameters, we calculated by equation (26) that 17 D T-AW (<strong>the</strong> troposphere versus AW) is 175 ± 50 per meg (<strong>the</strong>error margin is based on <strong>the</strong> error in q b <strong>and</strong> x a s ). Correspondingly,17 D AW (<strong>the</strong> average substrate water for photosyn<strong>the</strong>sisversus <strong>the</strong> troposphere) is 175 ± 50 per meg. Thiscalculation can also be preformed graphically on Figure 7.The calculated 17 D AW value is smaller than ei<strong>the</strong>r 215 per megobtained for Lake Kinneret water (section 5.3) or 249 per megfor seawater [Luz <strong>and</strong> Barkan, 2000]. The difference between<strong>the</strong> calculated 17 D AW <strong>and</strong> value obtained for seawater can besolved if higher global rates <strong>of</strong> <strong>photorespiration</strong> will beassumed in <strong>the</strong> calculation. However, this will not explain<strong>the</strong> difference between <strong>the</strong> values obtained for Kinneret water<strong>and</strong> seawater. Both this difference, <strong>and</strong> <strong>the</strong> difference betweenseawater <strong>and</strong> <strong>the</strong> calculated 17 D AW , can be explained byvarious isotope effects in <strong>the</strong> hydrological cycle.[75] Reported l values for meteoric precipitation rangefrom 0.528 [Meijer <strong>and</strong> Li, 1998] to 0.525 [Miller, 2002].Since q is only slightly lower than l (0.002), it is clear that<strong>the</strong> corresponding q values are higher than <strong>the</strong> ones wedetermined for biological uptake (0.506–0.516). The source<strong>of</strong> Lake Kinneret water is depleted meteoric precipitationthat later becomes enriched by evaporation. Hence, arelatively low q associated with evaporation can explainwhy <strong>the</strong> 17 D W <strong>of</strong> lake Kinneret is lower than that <strong>of</strong> seawater[Luz <strong>and</strong> Barkan, 2000]. Similar explanation can show how17 D AW becomes 74 per meg smaller than 17 D W <strong>of</strong> seawater.If <strong>the</strong> q <strong>of</strong> evapotranspiration is also low, <strong>the</strong>n <strong>the</strong> depletionin <strong>the</strong> heavy isotopes <strong>of</strong> meteoric precipitation <strong>and</strong> <strong>the</strong>enrichment in evapotranspiration will yield a low 17 D <strong>of</strong>average leaf water. Such low 17 D <strong>of</strong> leaf water will contributeto a low 17 D AW (175 per meg, Figure 7).[76] The discussion above demonstrates that rigorousclosure <strong>of</strong> <strong>the</strong> triple isotopic balance requires direct measurements<strong>of</strong> <strong>the</strong> q values associated with <strong>the</strong> hydrologicalcycle. Such estimation will enable independent estimate <strong>of</strong><strong>the</strong> isotopic composition <strong>of</strong> average water ( 17 D AW ). TheFigure 7. Schematic illustration (not to scale) <strong>of</strong> suggestedtriple isotope budget in <strong>the</strong> present global atmosphere. Theglobal composition <strong>of</strong> oxygen produced by photosyn<strong>the</strong>sis(AW) is a weighted average <strong>of</strong> about 60% O 2 producedfrom leaf water <strong>and</strong> 40% from seawater. Average leaf wateris formed from seawater that is depleted in 17 O <strong>and</strong> 18 Oduring meteoric precipitation (q 0.525) <strong>and</strong> enriched byevapotranspiration (q < 0.525). AW oxygen is enriched dueto biological uptake (q b = 0.513) to form BSS oxygen. BSSsignifies <strong>the</strong> hypo<strong>the</strong>tical composition <strong>of</strong> <strong>the</strong> atmospherethat would have been produced in <strong>the</strong> absence <strong>of</strong> stratosphericphotochemistry. Fur<strong>the</strong>r mass independent depletion(q 1) by stratospheric photochemistry causes 117 per meglowering <strong>of</strong> atmospheric 17 D.average global biological q (q b ) could be calculated from17 D AW <strong>and</strong> <strong>the</strong> measured triple isotopic composition <strong>of</strong>atmospheric O 2 . Our study shows that <strong>the</strong> relative globalrates <strong>of</strong> dark respiration <strong>and</strong> <strong>photorespiration</strong> control q b .Hence, <strong>the</strong> rates <strong>of</strong> <strong>the</strong>se globally important processes couldbe evaluated from triple isotope studies.6. Conclusions[77] The q values for <strong>the</strong> <strong>cytochrome</strong> <strong>pathway</strong>, <strong>the</strong> alternative<strong>pathway</strong>, <strong>photorespiration</strong>, <strong>and</strong> diffusion in air are0.516 ± 0.001, 0.514 ± 0.001, 0.506 ± 0.005, <strong>and</strong> 0.521 ±0.001, respectively. The combined effect <strong>of</strong> diffusion <strong>and</strong>respiration on <strong>the</strong> atmosphere was shown to be close to that<strong>of</strong> dark respiration. Since <strong>the</strong> value associated with <strong>photorespiration</strong>was found to be considerably lower than that <strong>of</strong>dark respiration, <strong>the</strong> triple isotopic composition <strong>of</strong> atmosphericO 2 is strongly controlled by <strong>the</strong> relative global rates<strong>of</strong> <strong>the</strong>se two processes. This control makes <strong>the</strong> tripleisotopic composition a tracer <strong>of</strong> <strong>the</strong> global rate <strong>of</strong> <strong>photorespiration</strong>in <strong>the</strong> past, as well as in <strong>the</strong> present.[78] The engagement <strong>of</strong> <strong>the</strong> alternative oxidase <strong>pathway</strong>(AOX) in <strong>the</strong> light is larger in low CO 2 than in high CO 2concentrations. Thus, environmental conditions that lower<strong>the</strong> internal CO 2 concentration in leaves are expected tocause an increase in <strong>photorespiration</strong> rate as well as in <strong>the</strong>AOX rate. Since <strong>the</strong> fractionation in both processes is strong,such environmental conditions will cause an increased DoleEffect.
30 - 14 ANGERT ET AL.: BIOLOGICAL EFFECTS ON THREE O 2 ISOTOPES[79] Acknowledgments. We thank Michael Bender, Thomas Blunier,Dan Yakir, <strong>and</strong> Joe Berry for valuable discussion, <strong>and</strong> Y. Helman forproviding unpublished data. The comments <strong>of</strong> two anonymous reviewerssignificantly improved <strong>the</strong> manuscript. We greatly appreciate support from<strong>the</strong> Israel Science Foundation, <strong>the</strong> USA-Israel Binational Science Foundation<strong>and</strong> Moshe-Shilo Minerva Center.ReferencesAngert, A., <strong>and</strong> B. Luz, Fractionation <strong>of</strong> oxygen isotopes by root respiration:Implications for <strong>the</strong> isotopic composition <strong>of</strong> atmospheric O 2 , Geochim.Cosmochim. Acta, 65(11), 1697–1703, 2001.Angert, A., B. Luz, <strong>and</strong> D. Yakir, Fractionation <strong>of</strong> oxygen isotopes byrespiration <strong>and</strong> diffusion in soils <strong>and</strong> its implications for <strong>the</strong> isotopiccomposition <strong>of</strong> atmospheric O 2 , Global Biogeochem. Cycles, 15(4),871–881, 2001.Badger, M. R., Photosyn<strong>the</strong>tic oxygen exchange, Ann. Rev. Plant Physiol.,36, 27–53, 1985.Badger, M. R., S. von Caemmerer, S. Ruuska, <strong>and</strong> H. Nakano, Electronflow to oxygen in higher plants <strong>and</strong> algae: Rates <strong>and</strong> control <strong>of</strong> directphotoreduction (Mehler reaction) <strong>and</strong> rubisco oxygenase, Philos. Trans.R. Soc. London, Ser. B, 355(1402), 1433–1446, 2000.Bender, M., T. Sowers, <strong>and</strong> L. Labeyrie, The Dole effect <strong>and</strong> its variationsduring <strong>the</strong> last 130,000 years as measured in <strong>the</strong> Vostok ice core, GlobalBiogeochem. Cycles, 8(3), 363–376, 1994.Blunier, T., B. Barnett, M. L. Bender, <strong>and</strong> M. B. Hendricks, Biologicaloxygen productivity during <strong>the</strong> last 60,000 years from triple oxygen isotopemeasurements, Global Biogeochem. Cycles, 16(3), 1029, 10.1029/2001GB001460, 2002.Davidson, E. A., <strong>and</strong> S. E. Trumbore, Gas diffusivity <strong>and</strong> production <strong>of</strong>CO-2 in deep soils <strong>of</strong> <strong>the</strong> eastern Amazon, Tellus, Ser. B, 47(5), 550–565, 1995.Dongmann, G., The contribution <strong>of</strong> l<strong>and</strong> photosyn<strong>the</strong>sis to <strong>the</strong> stationaryenrichment <strong>of</strong> 18 O [oxygen] in <strong>the</strong> atmosphere, Biophysik, 11(3), 219–225, 1974.Farquhar, G. D., <strong>and</strong> J. Lloyd, Carbon <strong>and</strong> oxygen isotope effect in <strong>the</strong>exchange <strong>of</strong> carbon dioxide between terrestrial plants <strong>and</strong> <strong>the</strong> atmosphere,in Stable Isotopes <strong>and</strong> Plant Carbon-Water Relations, edited byJ. R. Ehleringer, pp. 47–70, Academic, San Diego, Calif., 1993.Farquhar, G. D., M. H. O’Leary, <strong>and</strong> J. A. Berry, On <strong>the</strong> relationshipbetween carbon isotope discrimination <strong>and</strong> <strong>the</strong> intercellular carbon dioxideconcentration in leaves, Aust. J. Plant Physiol., 9, 121–137, 1982.Gillon, J., <strong>and</strong> D. Yakir, Influence <strong>of</strong> carbonic anhydrase activity in terrestrialvegetation on <strong>the</strong> 18 O content <strong>of</strong> atmospheric CO 2 , Science,291(5513), 2584–2587, 2001.Guy, R. D., J. A. Berry, M. L. Fogel, <strong>and</strong> T. C. Hoering, Differentialfractionation <strong>of</strong> oxygen isotopes by cyanide-resistant <strong>and</strong> cyanide-sensitiverespiration in plants, Planta, 177(4), 483–491, 1989.Guy, R. D., M. L. Fogel, <strong>and</strong> J. A. Berry, Photosyn<strong>the</strong>tic fractionation <strong>of</strong> <strong>the</strong>stable isotopes <strong>of</strong> oxygen <strong>and</strong> carbon, Plant Physiol., 101(1), 37–47,1993.Kroopnick, P., <strong>and</strong> H. Craig, Atmospheric oxygen: Isotopic composition<strong>and</strong> solubility fractionation, Science, 175(4017), 54–55, 1972.Lämmerzahl, P., T. Röckmann, C. A. M. Brenninkmeijer, D. Krankowsky,<strong>and</strong> K. Mauersberger, Oxygen isotope composition <strong>of</strong> stratospheric carbondioxide, Geophys. Res. Lett., 29(12), 1582, 10.1029/2001GL014343,2002.Lane, G. A., <strong>and</strong> M. Dole, Fractionation <strong>of</strong> oxygen isotopes during respiration,Science, 123(574–577), 1956.Luz, B., <strong>and</strong> E. Barkan, Assessment <strong>of</strong> oceanic productivity with <strong>the</strong> tripleisotopecomposition <strong>of</strong> dissolved oxygen, Science, 288(5473), 2028 –2031, 2000.Luz, B., E. Barkan, M. L. Bender, M. H. Thiemens, <strong>and</strong> K. A. Boering,Triple-isotope composition <strong>of</strong> atmospheric oxygen as a tracer <strong>of</strong> biosphereproductivity, Nature, 400(6744), 547–550, 1999.Luz, B., E. Barkan, Y. Sagi, <strong>and</strong> Y. Z. Yacobi, Evaluation <strong>of</strong> communityrespiratory mechanisms with oxygen isotopes: A case study in LakeKinneret, Limnol. Oceanogr., 47(1), 33–42, 2002.Malaize, B., D. Paillard, J. Jouzel, <strong>and</strong> D. Raynaud, The Dole effect over<strong>the</strong> last two glacial-interglacial cycles, J. Geophys. Res., 104(D12),14,199–14,208, 1999.Mason, E. A., <strong>and</strong> T. R. Marrero, The diffusion <strong>of</strong> atoms <strong>and</strong> molecules,Adv. At. Mol. Phys., 6, 155–232, 1970.Matsuhisa, Y., J. R. Goldsmith, <strong>and</strong> R. N. Clayton, Mechanisms <strong>of</strong> hydro<strong>the</strong>rmalcrystallization <strong>of</strong> quartz at 250 degrees C <strong>and</strong> 15 kilobars, Geochim.Cosmochim. Acta, 42(2), 173–182, 1978.Meijer, H. A. J., <strong>and</strong> W. J. Li, The use <strong>of</strong> electrolysis for accurate delta O-17<strong>and</strong> delta O-18 isotope measurements in water, Isot. Environ. HealthStud., 34(4), 349–369, 1998.Miller, M. F., Isotopic fractionation <strong>and</strong> <strong>the</strong> quantification <strong>of</strong> 17 O anomaliesin <strong>the</strong> oxygen three-isotope systems: An appraisal <strong>and</strong> geochemical significance,Geochim. Cosmochim. Acta, 66(11), 1881–1889, 2002.Mook, W. G., Environmental Isotopes in <strong>the</strong> Hydrological Cycle: Principles<strong>and</strong> Applications, vol.I, Introduction: Theory, Methods, Review,U.N. Educ. Sci. <strong>and</strong> Cult. Org./IAEA, Paris, 2000.Ribas-Carbo, M., S. A. Robinson, M. A. Gonzalez-Meler, A. M. Lennon,L. Giles, J. N. Siedow, <strong>and</strong> J. A. Berry, <strong>Effects</strong> <strong>of</strong> light on respiration<strong>and</strong> oxygen isotope fractionation in soybean cotyledons, Plant CellEnviron., 23(9), 983–989, 2000.Robinson, S. A., D. Yakir, C. M. Ribas, L. Giles, C. B. Osmond, J. N.Siedow, <strong>and</strong> J. A. Berry, Measurements <strong>of</strong> <strong>the</strong> engagement <strong>of</strong> cyanideresistantrespiration in <strong>the</strong> Crassulacean acid metabolism plant Kalanchoedaigremontiana with <strong>the</strong> use <strong>of</strong> on-line oxygen isotope discrimination,Plant Physiol., 100(3), 1087–1091, 1992.Thiemens, M. H., Mass-independent isotope effects in planetary atmospheres<strong>and</strong> <strong>the</strong> early solar system, Science, 283(5400), 341 –345,1999.Young, E. D., A. Galy, <strong>and</strong> H. Nagahara, Kinetic <strong>and</strong> equilibrium massdependentisotope fractionation laws in nature <strong>and</strong> <strong>the</strong>ir geochemical <strong>and</strong>cosmochemical significance, Geochim. Cosmochim. Acta, 66(6), 1094–1104, 2002.A. Angert, Center for Atmospheric Sciences, University <strong>of</strong> California,Berkeley, MC 4767, 307 McCone Hall, Berkeley, CA 94720-4767, USA.(angert@atmos.berkeley.edu)E. Barkan <strong>and</strong> B. Luz, Institute <strong>of</strong> Earth Sciences, Hebrew University <strong>of</strong>Jerusalem, Givat-Ram, Jerusalem 91904, Israel.S. Rachmilevitch, Department <strong>of</strong> Plant Sciences, Institute <strong>of</strong> LifeSciences, Hebrew University <strong>of</strong> Jerusalem, Jerusalem 91904, Israel.