Effects of photorespiration, the cytochrome pathway, and the ...
Effects of photorespiration, the cytochrome pathway, and the ...
Effects of photorespiration, the cytochrome pathway, and the ...
- No tags were found...

You also want an ePaper? Increase the reach of your titles
YUMPU automatically turns print PDFs into web optimized ePapers that Google loves.
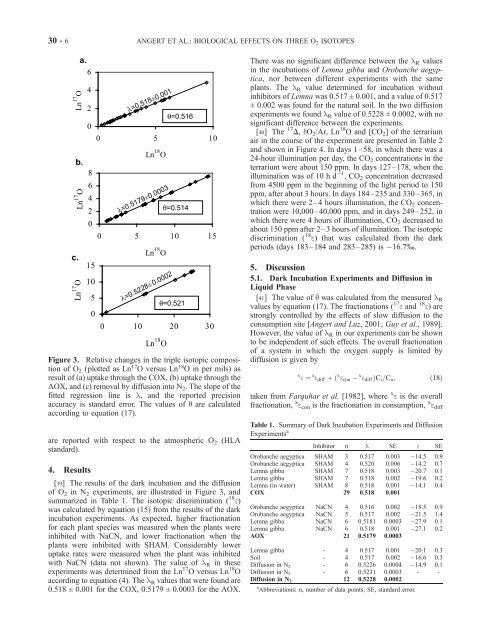
30 - 6 ANGERT ET AL.: BIOLOGICAL EFFECTS ON THREE O 2 ISOTOPESThere was no significant difference between <strong>the</strong> l R valuesin <strong>the</strong> incubations <strong>of</strong> Lemna gibba <strong>and</strong> Orobanche aegyptica,nor between different experiments with <strong>the</strong> sameplants. The l R value determined for incubation withoutinhibitors <strong>of</strong> Lemna was 0.517 ± 0.001, <strong>and</strong> a value <strong>of</strong> 0.517± 0.002 was found for <strong>the</strong> natural soil. In <strong>the</strong> two diffusionexperiments we found l R value <strong>of</strong> 0.5228 ± 0.0002, with nosignificant difference between <strong>the</strong> experiments.[40] The 17 D, dO 2 /Ar, Ln 18 O <strong>and</strong> [CO 2 ] <strong>of</strong> <strong>the</strong> terrariumair in <strong>the</strong> course <strong>of</strong> <strong>the</strong> experiment are presented in Table 2<strong>and</strong> shown in Figure 4. In days 1–58, in which <strong>the</strong>re was a24-hour illumination per day, <strong>the</strong> CO 2 concentrations in <strong>the</strong>terrarium were about 150 ppm. In days 127–178, when <strong>the</strong>illumination was <strong>of</strong> 10 h d 1 ,CO 2 concentration decreasedfrom 4500 ppm in <strong>the</strong> beginning <strong>of</strong> <strong>the</strong> light period to 150ppm, after about 3 hours. In days 184–235 <strong>and</strong> 330–365, inwhich <strong>the</strong>re were 2–4 hours illumination, <strong>the</strong> CO 2 concentrationwere 10,000–40,000 ppm, <strong>and</strong> in days 249–252, inwhich <strong>the</strong>re were 4 hours <strong>of</strong> illumination, CO 2 decreased toabout 150 ppm after 2–3 hours <strong>of</strong> illumination. The isotopicdiscrimination ( 18 e) that was calculated from <strong>the</strong> darkperiods (days 183–184 <strong>and</strong> 283–285) is 16.7%.Figure 3. Relative changes in <strong>the</strong> triple isotopic composition<strong>of</strong> O 2 (plotted as Ln 17 O versus Ln 18 O in per mils) asresult <strong>of</strong> (a) uptake through <strong>the</strong> COX, (b) uptake through <strong>the</strong>AOX, <strong>and</strong> (c) removal by diffusion into N 2 . The slope <strong>of</strong> <strong>the</strong>fitted regression line is l, <strong>and</strong> <strong>the</strong> reported precisionaccuracy is st<strong>and</strong>ard error. The values <strong>of</strong> q are calculatedaccording to equation (17).are reported with respect to <strong>the</strong> atmospheric O 2 (HLAst<strong>and</strong>ard).4. Results[39] The results <strong>of</strong> <strong>the</strong> dark incubation <strong>and</strong> <strong>the</strong> diffusion<strong>of</strong> O 2 in N 2 experiments, are illustrated in Figure 3, <strong>and</strong>summarized in Table 1. The isotopic discrimination ( 18 e)was calculated by equation (15) from <strong>the</strong> results <strong>of</strong> <strong>the</strong> darkincubation experiments. As expected, higher fractionationfor each plant species was measured when <strong>the</strong> plants wereinhibited with NaCN, <strong>and</strong> lower fractionation when <strong>the</strong>plants were inhibited with SHAM. Considerably loweruptake rates were measured when <strong>the</strong> plant was inhibitedwith NaCN (data not shown). The value <strong>of</strong> l R in <strong>the</strong>seexperiments was determined from <strong>the</strong> Ln 17 O versus Ln 18 Oaccording to equation (4). The l R values that were found are0.518 ± 0.001 for <strong>the</strong> COX, 0.5179 ± 0.0003 for <strong>the</strong> AOX.5. Discussion5.1. Dark Incubation Experiments <strong>and</strong> Diffusion inLiquid Phase[41] The value <strong>of</strong> q was calculated from <strong>the</strong> measured l Rvalues by equation (17). The fractionations ( 17 e <strong>and</strong> 18 e)arestrongly controlled by <strong>the</strong> effects <strong>of</strong> slow diffusion to <strong>the</strong>consumption site [Angert <strong>and</strong> Luz, 2001; Guy et al., 1989].However, <strong>the</strong> value <strong>of</strong> l R in our experiments can be shownto be independent <strong>of</strong> such effects. The overall fractionation<strong>of</strong> a system in which <strong>the</strong> oxygen supply is limited bydiffusion is given byx e ¼ x e diff þ ð x e x con e diff ÞC i =C a ; ð18Þtaken from Farquhar et al. [1982], where x e is <strong>the</strong> overallfractionation, x e con is <strong>the</strong> fractionation in consumption, x e diffTable 1. Summary <strong>of</strong> Dark Incubation Experiments <strong>and</strong> DiffusionExperiments a Inhibitor n l SE e SEOrobanche aegyptica SHAM 3 0.517 0.003 14.5 0.9Orobanche aegyptica SHAM 4 0.520 0.006 14.2 0.7Lemna gibba SHAM 7 0.518 0.003 20.7 0.1Lemna gibba SHAM 7 0.518 0.002 19.6 0.2Lemna (in water) SHAM 8 0.518 0.001 14.1 0.4COX 29 0.518 0.001Orobanche aegyptica NaCN 4 0.516 0.002 18.5 0.9Orobanche aegyptica NaCN 5 0.517 0.002 21.5 1.4Lemna gibba NaCN 6 0.5181 0.0003 27.9 0.1Lemna gibba NaCN 6 0.518 0.001 27.1 0.2AOX 21 0.5179 0.0003Lemna gibba - 4 0.517 0.001 20.1 0.3Soil - 4 0.517 0.002 16.6 0.3Diffusion in N 2 - 6 0.5226 0.0004 14.9 0.1Diffusion in N 2 - 6 0.5231 0.0003 - -Diffusion in N 2 12 0.5228 0.0002a Abbreviations: n, number <strong>of</strong> data points; SE, st<strong>and</strong>ard error.