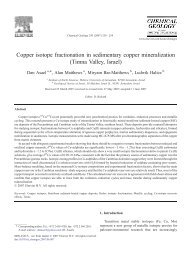
30 - 4 ANGERT ET AL.: BIOLOGICAL EFFECTS ON THREE O 2 ISOTOPES[23] According to equation (1), <strong>the</strong> 17 D <strong>of</strong> <strong>the</strong> photosyn<strong>the</strong>ticallyproduced oxygen is17 R W17 R W17 D W ¼ ln C ln : ð11Þ17R17 ref R ref[24] Subtracting equation (11) from equation (10), <strong>and</strong>using equation (5) yields17 D 17 BSS D W ¼ ln18 a C q: ð12ÞFigure 2. Schematic plot (not to scale) <strong>of</strong> Ln 17 O versusLn 18 O for a closed system in production-uptake steadystate. Point ‘‘W’’ represents oxygen that is produced byphotosyn<strong>the</strong>sis in photosystem 2 from water, <strong>and</strong> ‘‘BSS1’’<strong>and</strong> ‘‘BSS2’’ represent biological steady states. The slope <strong>of</strong><strong>the</strong> line that connects ‘‘BSS1’’ <strong>and</strong> ‘‘W’’ is equal to q 1 <strong>and</strong><strong>the</strong> slope <strong>of</strong> <strong>the</strong> line connecting ‘‘BSS2’’ <strong>and</strong> ‘‘W’’ is equalto q 2 (q =ln( 17 a)/ln( 18 a)). When q <strong>of</strong> <strong>the</strong> system equals q 1<strong>the</strong> system reaches <strong>the</strong> steady state condition indicated by‘‘BSS1’’ with an 17 O excess <strong>of</strong> 17 D BSS1 . Since C equals toq 1 , 17 D BSS1 equals to <strong>the</strong> 17 D W . When q <strong>of</strong> <strong>the</strong> system equalsq 2 <strong>the</strong> system reaches steady state indicated by ‘‘BSS2’’with 17 O excess <strong>of</strong> 17 D BSS2 that is lower than 17 D BSS1 . Thehorizontal distance between ‘‘BSS’’ <strong>and</strong> ‘‘W’’ is <strong>the</strong>system’s equivalent <strong>of</strong> <strong>the</strong> global Dole Effect (in Ln 18 Oterms). The difference between 17 D BSS1 <strong>and</strong> 17 D BSS2 isgiven by <strong>the</strong> system’s ‘‘Dole Effect’’ times <strong>the</strong> differencebetween q 1 <strong>and</strong> q 2 .[20] Rearranging equation (8) <strong>and</strong> substituting it intoequation (4) givesl BSS ¼ ln ð17 aÞln 18 ¼ q: ð9Þð aÞ [21] Hence, <strong>the</strong> slope <strong>of</strong> <strong>the</strong> line connecting <strong>the</strong> O 2 <strong>of</strong> abiological system in production-uptake steady state, <strong>and</strong> <strong>the</strong>O 2 produced from <strong>the</strong> substrate water, is equal to <strong>the</strong> value<strong>of</strong> q. However, as we will show in section 2.3 below, <strong>the</strong>value <strong>of</strong> l is not always equal to <strong>the</strong> value <strong>of</strong> q.[22] The 17 D in production-uptake steady state can befound by substituting equations (7) <strong>and</strong> (8) into equation (1),[25] When q equals C, <strong>the</strong> 17 D value <strong>of</strong> <strong>the</strong> air in steadystate equals to that <strong>of</strong> <strong>the</strong> oxygen that is produced from <strong>the</strong>substrate water. However, if q is different from C, <strong>the</strong>n17 D BSS is controlled both by q <strong>and</strong> 18 a.[26] Currently, <strong>the</strong> value <strong>of</strong> 17 D W cannot be measureddirectly with sufficient accuracy. However, this value canbe estimated by conducting a terrarium experiment inwhich <strong>the</strong> q value <strong>of</strong> <strong>the</strong> uptake process is known (thisknown q will be noted as q 1 ). In such an experiment, <strong>the</strong>value <strong>of</strong> 17 D in steady state ( 17 D BSS1 ) will be identical tothat <strong>of</strong> 17 D W , if we choose C = q 1 . By conducting anadditional experiment in which <strong>the</strong> q value <strong>of</strong> <strong>the</strong> uptakeprocess is unknown (this unknown q will be noted as q 2 ),we can calculate <strong>the</strong> value <strong>of</strong> q 2 from <strong>the</strong> 17 O excess insteady state <strong>of</strong> this experiment ( 17 D BSS2 ), by rearrangingequation (12),ð17 D 17 BSS 2 D W Þq 2 ¼ q 1ln 18 : ð13Þð aÞ[27] The value <strong>of</strong> ln( 18 a) for <strong>the</strong> system can be found byrearranging equation (8),ln 18 a ¼ ln 18 R BSS = 18 R W : ð14Þ[28] The right-h<strong>and</strong> side <strong>of</strong> equation (14) is <strong>the</strong> Ln 18 Ovalue <strong>of</strong> ‘‘BSS’’ versus ‘‘W,’’ which is equivalent to <strong>the</strong>terrarium Dole Effect in Ln 18 O terms (<strong>the</strong> value <strong>of</strong> <strong>the</strong> DoleEffect in d 18 O terms is greater by 0.3% if SMOW is <strong>the</strong>reference <strong>and</strong> lower by 0.3% if atmospheric O 2 is <strong>the</strong>reference). Hence, <strong>the</strong> calculation <strong>of</strong> q 2 from equation (13)is identical to <strong>the</strong> solution presented graphically in Figure 2.[29] To estimate q values by <strong>the</strong> method describe above,<strong>the</strong> q value <strong>of</strong> at least one process (q 1 ) must be knownindependently. This value can be found by conductingexperiments in systems in which <strong>the</strong>re is O 2 uptake butno production.2.3. O 2 Removal Only[30] In our dark respiration <strong>and</strong> binary diffusion experiments,O 2 is only removed from <strong>the</strong> system. The change inisotopic composition in such experiments follows <strong>the</strong>Raleigh distillation equation,1717 R W = 17 a18 R W = 18 aD BSS ¼ ln C ln : ð10Þ17R18 ref R refx e ¼ ln x R= x R 0; ð15Þln f
ANGERT ET AL.: BIOLOGICAL EFFECTS ON THREE O 2 ISOTOPES 30 - 5where x R 0 is <strong>the</strong> initial isotope ratio x O 16 O/ 16 O 2 <strong>and</strong> f is <strong>the</strong>remaining 16 O 2 fraction. Substituting equation (15) intoequation (4) yieldsl R ¼17 e¼ g; ð16Þ18ewhere <strong>the</strong> subscript R st<strong>and</strong>s for Raleigh distillation.Equation (16) shows that in a system where <strong>the</strong>re is onlyuptake <strong>of</strong> oxygen, <strong>the</strong> value <strong>of</strong> l is different from <strong>the</strong>value <strong>of</strong> q. The value <strong>of</strong> q in ‘‘removal only’’ experimentscan be calculated by substituting equation (16) intoequation (5),q ¼ ln ð 1 þ l R 18 eÞlnð1 þ 18 eÞ : ð17Þ[31] The range <strong>of</strong> 18 e in biological uptake is 15 to32% <strong>and</strong> <strong>the</strong> value <strong>of</strong> q in mass-dependent fractionationis about 0.5. Hence, l R will be larger by 0.002–0.004 than qin most systems. For O 2 samples close in composition to <strong>the</strong>st<strong>and</strong>ard O 2 , using slightly different C values will notsignificantly affect <strong>the</strong> calculated 17 D. However, for <strong>the</strong>purpose <strong>of</strong> <strong>the</strong> present study where comparisons betweensteady state O 2 <strong>and</strong> its substrate water are necessary, a smalldifference in parameter C becomes significant. To illustrate<strong>the</strong> importance this point, consider a water sample havingLn 18 O= 23% <strong>and</strong> Ln 17 O= 11.7% with respect to airO 2 . Using equation (1) <strong>and</strong> C = 0.52, 17 D <strong>of</strong> this sample iscalculated as 260 per meg. Similar calculation with C =0.524 yields 17 D <strong>of</strong> 352 per meg.3. Experimental Methods3.1. Dark Respiration Experiments[32] Axenic cultures <strong>of</strong> Lemna gibba, a small waterplant, were grown in a nutrient solution. Illumination frommixed fluorescent/inc<strong>and</strong>escent lamps was at an intensity<strong>of</strong> 200 ± 20 mE m 2 s 1 photosyn<strong>the</strong>tic photon flux (PPF),at <strong>the</strong> level <strong>of</strong> <strong>the</strong> fronds, for 12 h d 1 . Air temperaturewas 24°C <strong>and</strong> 19 ± 0.5°C in <strong>the</strong> light <strong>and</strong> dark periods,respectively.[33] The seeds <strong>of</strong> Orobanche aegyptica, an obligatoryroot parasite, were placed in empty tea bags <strong>and</strong> suspendedfor sterilization in 1% solution <strong>of</strong> NaOCl for 5 min. Theseeds were <strong>the</strong>n rinsed thoroughly for 20 min in steriledistilled H 2 O. After <strong>the</strong> rinse, <strong>the</strong> seeds were activated by 3days imbibition in 5 ml <strong>of</strong> H 2 O in 9-cm-diameter Petridishes with one layer <strong>of</strong> Whatman paper, to which a mixture<strong>of</strong> antibiotics was added. The mixture contained 50 mg each<strong>of</strong> streptomycin <strong>and</strong> penicillin G <strong>and</strong> 25 mg <strong>of</strong> chloramphenicol,in order to prevent <strong>the</strong> development <strong>of</strong> bacterialinfections during <strong>the</strong> imbibition period.[34] To determine <strong>the</strong> q value associated with <strong>the</strong> COX,we inhibited <strong>the</strong> AOX in <strong>the</strong> plant samples with 2 mMSalicylhydroxamic acid (SHAM). To determine <strong>the</strong> valueassociated with <strong>the</strong> AOX, we inhibited <strong>the</strong> COX with 1mM NaCN. The inhibitors were added to a closedaerated chamber containing <strong>the</strong> plant samples <strong>and</strong> waterfor at least 90 min before measurements were made.Additional control experiments without inhibitors wereconducted with Lemna <strong>and</strong> natural soil (<strong>the</strong> resulting qvalue was expected to lie between that <strong>of</strong> <strong>the</strong> AOX <strong>and</strong><strong>the</strong> COX).[35] For <strong>the</strong> incubation, about 1 g <strong>of</strong> plant sample wasinserted into 6 cm 3 blood collection tubes (Vacutainers 1 )that were closed with rubber septa. The tubes wereimmersed in water during incubation in order to preventair leaks. After an incubation period <strong>of</strong> 1 to 10 hours, <strong>the</strong> airin <strong>the</strong> tubes was sampled, via a needle, directly to <strong>the</strong>vacuum preparation line. In o<strong>the</strong>r experiments, plant sampleswere incubated in water <strong>and</strong> <strong>the</strong> changes in <strong>the</strong>dissolved oxygen were monitored. At <strong>the</strong> end <strong>of</strong> <strong>the</strong>seexperiments, 120 cm 3 water were sampled in 250 cm 3pre-evacuated flasks closed with a Lowers Happert 1 valve.Sampling <strong>and</strong> extraction <strong>of</strong> <strong>the</strong> dissolved gases were doneaccording to Luz et al. [2002].3.2. Terrarium Experiments[36] We used an airtight terrarium as described by Luz etal. [1999]. The terrarium contained Philodendron plants,soil <strong>and</strong> natural water from Lake Kinneret, Israel (d 18 O=0.5% versus SMOW). It was illuminated by a fluorescentlamp (100 mE m 2 s 1 ) for 24 h d 1 ,10hd 1 ,4hd 1<strong>and</strong> 2 h d 1 in different stages <strong>of</strong> <strong>the</strong> experiment. Differentlight conditions were used to manipulate <strong>the</strong> CO 2concentration in <strong>the</strong> terrarium, which, in turn, affects <strong>the</strong>relative rate <strong>of</strong> <strong>photorespiration</strong> [Badger, 1985]. Theterrarium was also covered <strong>and</strong> darkened for dark incubations.The CO 2 concentration in <strong>the</strong> terrarium air wasdetermined by sampling 6 cm 3 air in pre-evacuated bloodcollection tubes (Vacutainers 1 ), <strong>and</strong> measuring <strong>the</strong> airsample with an infrared gas analyzer (LI-COR-6252 1 )by a method similar to Davidson <strong>and</strong> Trumbore [1995].The relative accuracy for CO 2 concentration measurementwas ±5%.3.3. O 2 -N 2 Diffusion Experiments[37] In <strong>the</strong> diffusion <strong>of</strong> O 2 in N 2 experiments, a 4-cm 3flask was filled with pure oxygen. The neck <strong>of</strong> <strong>the</strong> flask wasfilled with a diffusive medium (plastic sponge) that preventedadvective mixing, <strong>and</strong> <strong>the</strong> oxygen that diffused out<strong>of</strong> <strong>the</strong> tube was immediately removed by a flow <strong>of</strong> N 2 . After1–2 hours, <strong>the</strong> O 2 concentration in <strong>the</strong> flasks was considerablylowered <strong>and</strong> <strong>the</strong> flasks were closed <strong>and</strong> transferredfor isotopic analysis.3.4. Sample Preparation <strong>and</strong> Mass Spectrometry[38] Sampling, sample preparation, <strong>and</strong> mass spectrometrywere according to Angert <strong>and</strong> Luz [2001], Luz et al.[2002], <strong>and</strong> Luz <strong>and</strong> Barkan [2000]. The preparation <strong>of</strong> <strong>the</strong>sample included cryogenic removal <strong>of</strong> water vapor <strong>and</strong> CO 2,<strong>and</strong> chromatographic separation <strong>of</strong> N 2 , which is needed foraccurate 17 D measurements. The samples were frozen at4°K into stainless steel tubes <strong>and</strong> transferred for analysisin a Finnigan Delta-Plus mass-spectrometer. Correctionswere applied in order to account for <strong>the</strong> sensitivity <strong>of</strong>ionization efficiencies <strong>of</strong> <strong>the</strong> three isotopic species tovariations in <strong>the</strong> O 2 /Ar ratio. The analytical error (absolutedifference from <strong>the</strong> average) for d 18 O, dO 2 /Ar, <strong>and</strong> D 17 Owas 0.02%, 0.5% <strong>and</strong> 5 per meg, respectively. All values