Cancer Reform Strategy - NHS Cancer Screening Programmes
Cancer Reform Strategy - NHS Cancer Screening Programmes
Cancer Reform Strategy - NHS Cancer Screening Programmes
- No tags were found...

You also want an ePaper? Increase the reach of your titles
YUMPU automatically turns print PDFs into web optimized ePapers that Google loves.
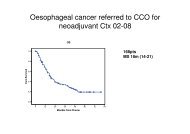
CHAPTER 10: FUNDING WORLD CLASS CANCER CARE 12110.9 Some variation in PCT spending may beexplained by factors such as incidence, length ofhospital stay and emergency admissions.However, these factors are unlikely to be the fullstory. Good PCTs will wish to benchmark theirexpenditure on cancer services with that ofother PCTs with similar health needs. Theyshould use the resources published alongsidethis strategy and the improved information onoutcomes which will be generated by theactions we are taking, to critically appraisewhether they are spending appropriate levels oncancer services in order to appropriately meetthe needs of their local population.Comparison of spend with othercountries10.10 Record investment in the <strong>NHS</strong> since 2000has been mirrored by substantial increases in thefunding for cancer services. However, thisfollows a prolonged period of low investmentin health services compared to the rest ofEurope and significant amounts of thisinvestment have been dedicated to addressingthis historic shortfall.10.11 Spending per capita on cancer servicesremains low compared to some other Europeancountries. Spending on cancer in England is £80per capita, compared to £121 per capita inFrance and £143 per capita in Germany. Overall,England spends 5.6% of its public healthcarebudget on cancer, compared to 7.7% in France,9.2% in the United States and 9.6% inGermany. 5110.12 There is no consensus on the correct levela country should spend on cancer services.This strategy marks a shift towards assessing theperformance of cancer services using measuresof outcomes and outputs rather than simplyinputs. However if outcomes fall below theaspirations set out in this strategy then it will beFigure 17: Estimated cost per head of NICE-approved cancer drugs used in hospitals in Jan-Jun 2005, by cancer network4.54.03.5Cost (£) per head3.02.52.01.51.00.50Method: Calculations based on volumes dispensed (from IMS-Health) and on lowest list prices foreach NICE-approved cancer drug.