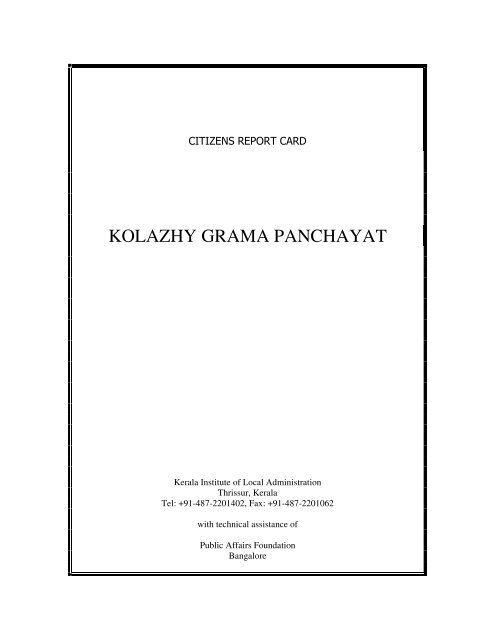
KOLAZHY GRAMA PANCHAYAT - SASANet
KOLAZHY GRAMA PANCHAYAT - SASANet
KOLAZHY GRAMA PANCHAYAT - SASANet

Create successful ePaper yourself
Turn your PDF publications into a flip-book with our unique Google optimized e-Paper software.
10.2 Timely notice on grama sabha meeting ............................................................................................. 4910.3 Number of grama sabha meetings attended during last year ............................................................ 5010.4 Membership in Kudumbasree/ Neighbourhood Groups (NHG) ........................................................ 5010.5 Rating on interface with Panchayat. ................................................................................................. 5011 SUMMERY AND RECOMMENDATION............................................................................................. 5111.1 EDUCATION..................................................................................................................................... 5111.1.1 Conclusions.............................................................................................................................. 5111.1.2 Suggestions .............................................................................................................................. 5111.2 HEALTH............................................................................................................................................ 5111.2.1 Conclusions.............................................................................................................................. 5111.2.2 Suggestions .............................................................................................................................. 5211.3 ICDS .................................................................................................................................................. 5211.3.1 Conclusions.............................................................................................................................. 5211.3.2 Suggestions .............................................................................................................................. 5211.4 <strong>PANCHAYAT</strong> SERVICES .................................................................................................................. 5211.4.1 Conclusions.............................................................................................................................. 5211.4.2 Suggestions .............................................................................................................................. 5311.5 SANITATION AND SOLID WASTE MANAGEMENT....................................................................... 5311.5.1 Conclusions.............................................................................................................................. 5311.5.2 Suggestions .............................................................................................................................. 5311.6 Governance........................................................................................................................................ 5311.6.1 Conclusions.............................................................................................................................. 5311.6.2 Suggestions .............................................................................................................................. 5412 Report Card............................................................................................................................................... 5412.1 Note: .................................................................................................................................................. 545
TABLE OF CONTENTTable 1: Households ............................................................................................................................................ 8Table 2: Gender of the Population ..................................................................................................................... 9Table 3: Boundaries of the Panchayat ............................................................................................................... 9Table 4:Details of Institutions in the Panchayath............................................................................................. 9Table 5: Details of road facilities........................................................................................................................ 9Table 6: Composition of Household ......................................................................................................... 13Table 7: Gender of the Head of the Household.................................................................................... 13Table 8: Age Distribution of the Respondent ....................................................................................... 13Table 9: Level of Education of the Respondent ................................................................................... 14Table 10: Occupational Pattern of the Head of the Household ...................................................... 14Table 11: Duration of Stay in the Panchayat ........................................................................................ 15Table 12: Caste Composition of the Sample Households ................................................................. 15Table 13: Type of Dwelling .......................................................................................................................... 15Table 14 :Nature of Ownership of House ............................................................................................... 16Table 15: Household Facilities.................................................................................................................... 16Table 16:Response from Sectors............................................................................................................... 16Table 17: Gender of Eldest School Going Child .................................................................................... 17Table 18: Age Distribution of the Eldest School Going Child .......................................................... 17Table 19: Distribution of Children in various Classes ....................................................................... 18Table 20: Category of School...................................................................................................................... 18Table 21: Type of School .............................................................................................................................. 18Table 22: Medium of instruction................................................................................................................ 18Table 23: Distance to School....................................................................................................................... 20Table 24: Mode of travel............................................................................................................................... 20Table 25: Regularity of children to school ............................................................................................. 20Table 26: Facilities and services in the school ..................................................................................... 20Table 27 :Distribution of Materials and its Timeliness ...................................................................... 22Table 28: Regularity of teachers, monitoring and evaluation by teachers and happiness ofchildren .................................................................................................................................................... 22Table 29: Level of Satisfaction with the School Services ................................................................. 23Table 30: Reasons for dissatisfaction...................................................................................................... 24Table 31: Change in Quality of Service over Past Four Years ......................................................... 24Table 32: Suggestions for Improving the School ................................................................................ 25Table 33: Gender of the Respondent ....................................................................................................... 25Table 34:Type of Illness ............................................................................................................................... 26Table 35:Type of Illness ............................................................................................................................... 26Table 36: Usage of Health Institutions ................................................................................................... 27Table 37:Types of treatments..................................................................................................................... 27Table 38: Distance to Health Institutions .............................................................................................. 27Table 39: Presence of doctor ...................................................................................................................... 28Table 40: Availability of facilities for out patients .............................................................................. 28Table 41: Availability of Medicine ............................................................................................................. 28Table 42: Quality of Medicine ..................................................................................................................... 29Table 43: Effectiveness of Treatment...................................................................................................... 29Table 44: Alternative choice to cure the diseases............................................................................... 29Table 45 : Level of Satisfaction on Health Service.............................................................................. 30Table 46: Change in Quality of Service over Past Four Years ......................................................... 31Table 47: Suggestions for Improving Health Services ...................................................................... 31Table 48: Distribution of Children in Anganwadis .............................................................................. 32Table 49: Nature of Ownership of Anganwadi Building.................................................................... 33Table 50 : Distance to Anganwadi ............................................................................................................ 33Table 51 : Regularity of Teacher .............................................................................................................. 33Table 52 : Awareness about the Anganawadi ...................................................................................... 33Table 53 : Facilities and service at anganawadi .................................................................................. 34Table 54 : Services during pregnancy...................................................................................................... 346
Table 55 : Service after Delivery ............................................................................................................... 35Table 56 : Level of Satisfaction on Anganawadi Services ................................................................ 35Table 57 : Change in Quality of Service over Past Four Years........................................................ 36Table 58 : Suggestions for Improving ICDS Services ........................................................................ 36Table 59 : Visit to Panchayat During Last Year.................................................................................... 37Table 60 : Reason for Last Visit to Panchayat ...................................................................................... 38Table 61 : Interface with Panchayat........................................................................................................ 38Table 62 : Time Spent at Panchayat Office............................................................................................ 39Table 63 : Number of Visit for Last Purpose.......................................................................................... 39Table 64 : Number of Man days Lost due to Visit to Panchayat..................................................... 40Table 65: Loss of wage per days................................................................................................................ 40Table 66: Level of Satisfaction on Panchayat Office .......................................................................... 41Table 67 : Change in Quality of Service over Past Four Years........................................................ 42Table 68 : Suggestions for Improving Panchayat Office Services ................................................ 42Table 69 : Awareness about citizen charter .......................................................................................... 44Table 70 : Opinion of Respondents on Sanitation Activities of Panchayat ................................ 44Table 71 : Availability of Latrine................................................................................................................ 45Table 72 : Type of Latrine ............................................................................................................................ 45Table 73 : Source Finance for Latrine...................................................................................................... 45Table 74 : Sensitisation About Sanitation.............................................................................................. 46Table 75 : Flow of waste water from kitchen, bathroom etc......................................................... 46Table 76: Process of Disposal of Waste .................................................................................................. 47Table 77 : Level of Satisfaction on Sanitation Activities of Panchayat ....................................... 47Table 78 : Suggestions for improving sanitation activities ............................................................. 48Table 79: Visit to panchayat office during last year........................................................................... 49Table 80: Timely notice on grama sabha meeting .............................................................................. 49Table 81: Number of grama sabha meetings attended during last year .................................... 50Table 82: Membership in Kudumbasree/ Neighbourhood Groups (NHG).................................. 50Table 83: Report Card..................................................................................................................................... 547
1 INTRODUCTIONThis study is a pilot attempt to prepare a Citizens Report Card on the servicesprovided by local bodies based on a feedback survey of beneficiaries of the servicesin Kolazhy Grama Panchayat.In order to prepare the Citizen Report Card information have been collected basedon a questionnaire. The core area of the study are education, health & ICDS. Forthese core areas 300 sample units have been identified from the list of beneficiariesof respective institutions. In the case of the list having less than 300 beneficiariescensus method has been applied. In addition on core areas, information onsubsequent areas, i.e, Panchayat Services, Sanitation and governance has beencollected from the identified sample units1.1.1 <strong>KOLAZHY</strong> <strong>GRAMA</strong> <strong>PANCHAYAT</strong>HThe Kolazhi Grama Panchayath is in Thrissur District, which is situated in the centralpart of Kerala. The eastern boundary of the Panchayat has hilly areas and paddyfields. The central part has laterite stones and south western part has paddy fields.Eventhough the main occupation of the people is agriculture, it faced manyproblems. The prospects of small scale industries in the panchayath are not rosy.1.2 Geographic and demographic profile of thePanchayathArea : 16.62 Sq.Kms.Number of wards : 161.2.1 HouseholdsTable 1: HouseholdsCategory Number of Households PercentageBelow poverty line 3105 40Above poverty line 4659 60TOTAL 7764 1008
1.2.2 Gender of the populationTable 2: Gender of the PopulationGender Number PercentageMale 13319 49Female 13861 51TOTAL 27180 1001.2.3 Boundaries of the PanchayathTable 3: Boundaries of the PanchayatDirectionBoundaryNorth Achuthapuram Road, Mulankunnathukavu G.P.East Viyyoor CanalWest Kolangattu karaSouth Trichur Corporation1.2.4 Details of Institutions in the PanchayathTable 4:Details of Institutions in the PanchayathSl.No. Name of Institution No.of units.1. Primary Health Centre -2. Family Welfare Centre 23. Govt. Ayurveda Dispensary 14. Govt. Homeo Dispensary 15. Anganwadi 186. Continuing Education Centre 37. Govt. Primary School 18. Krishi Bhavan 19. Vetenary Dispensary 210. ICDS Supervisor’s office 111. VEO Office 21.2.5 Details of road facilitiesTable 5: Details of road facilitiesSl.No. Item Numbers1 Length of Village roads (Black topped) 38.8 Kms2 Length of village roads (Soil 49 Kms.9
2 CITIZEN REPORT CARD2.1 What is the Citizen Report Card?The Citizen Report Card (CRC) is a simple but powerful tool to provide public agencies withsystematic feedback from users of public services. CRCs elicit feedback through samplesurveys on aspects of service quality that users know best, and enable public agencies toidentify strengths and weaknesses in their work.In the context of sector reform programmes, CRCs provide an empirical “bottom-up”assessment of the reach and benefit of specific reform measures. It serves to identify the keyconstraints that citizens (especially the poor and the underserved) face in accessing publicservices, benchmark the quality and adequacy of these services as well as the effectiveness ofstaff providing services. These insights help generate recommendations on sector policies,programme strategy and management of service delivery, to address these constraints andimprove service delivery.Citizen Report Cards entail a random sample survey of the users of different public services(utilities), and the aggregation of the users’ experiences as a basis for rating the services.CRCs also help to convert individual problems facing the various programmes into commonsector issues. It facilitates prioritization of reforms and corrective actions by drawingattention to the worst problems highlighted. CRCs also facilitate cross fertilization of ideasand approaches by identifying good practices. Citizen Report Cards provide a benchmark onquality of public services as experienced by the users of these services. Hence, they gobeyond the specific problems that individual citizens may face, and place each issue in theperspective of other elements of service design and delivery, as well as a comparison withother services, so that a strategic set of actions can be initiated.Citizen Report Cards capture citizens' feedback in simple and unambiguous terms byindicating their level of satisfaction or dissatisfaction. Apart from giving summative feedbackon services, CRCs also capture the user feedback on specific aspects of the service. Forexample, the most basic but clear feedback that a citizen may give about the quality ofdrinking water is total dissatisfaction. To appreciate this feedback, we must relate it to theratings given to other dimensions by the same person. For example, adequacy of water supplymay be rated worse than quality. When we look at these two pieces of information, we canconclude that quality of water supply may be a cause of dissatisfaction, but the priority forcorrective action may be on providing adequate water supply. Hence measures of citizens’satisfaction across different dimensions of public services constitute the core of CitizenReport Card studies.Citizen Report Cards do not stop with mere measures of satisfaction - they go on to enquireinto specific aspects of interaction between the service agency and the citizen, and seek toidentify issues that emerge in connection with the same. In more simple terms, it suggeststhat dissatisfaction has causes, which may be related to the quality of service enjoyed by thecitizen (like reliability of water supply, or availability of learning materials in a publicschool), the type of difficulty encountered while dealing with the agency to solve serviceproblems (like complaints of water supply breakdown), and hidden costs in making use of thepublic service (special tuition fees to teachers or investments in filters to purify “drinkingwater”). Therefore we can see that Citizen Report Card studies go into different aspects of10
performance in interfacing with citizens, to provide indicators of problem areas in publicservices.Citizen Report Card studies are not merely a means of collecting feedback on existingsituations from citizens. They are also a means for testing out different options that citizenswish to exercise, individually or collectively, to tackle current problems. For example,whether citizens were willing to pay more or be part of citizens’ bodies made responsible formanaging public water sources. Hence, Report Cards are also means for exploring citizens'alternatives for improvements in public services. An important aspect of Citizen ReportCards is the credibility they have earned. The conclusions in a Citizen Report Card are notopinions of a few persons who think in a particular manner, nor the complaints of a fewaggrieved citizens. The methodology involves systematic sampling across all subsections orsegments of citizens - including those who are satisfied as well as the aggrieved - andpresents a picture that includes all opinions. This is possible because the methodology makesuse of advanced techniques of social science research, for selecting samples, designingquestionnaires, conducting interviews, and interpreting results. As a result, the report cardsprovide reliable and comprehensive representation of citizens' feedback.2.2 Why use a Citizen Report Card?As a diagnostic tool: The CRC provides citizens and governments with qualitative andquantitative information about gaps in service delivery. It can also measure the level ofawareness about citizens’ rights and responsibilities. However, in light of the pastexperiences in varied contexts, the efficacy of CRC as an effective pointer for diagnosingweak areas in the service delivery processes has been well documented. In particular, whenconventional monitoring of services and provisions are weak, CRCs become a powerful toolto inform key issues and themes. Also, the richness of the comparative feedback generated byCRCs across locations and sub-groups (gender, economic, social etc) enable serviceproviders and other stakeholders to identify critical variations and possible pockets ofexclusion.As an accountability tool: The CRC reveals areas where the institutions responsible forservice provision have not fulfilled their obligations. The findings can also be used to identifyand demand improvements in services/provisions. A clear advocacy pointer emerging fromCRC findings is the potency to translate findings and interpretations into ‘rights based’advocacy statements and positions.To benchmark changes: The CRC, if conducted periodically, can track variations in servicequality over time. This credible and objective tracking of performance often brings about apressure on the poor performers to improve the quality of services.To reveal hidden costs: A powerful outcome of CRCs is the generation of credible userfeedback on hidden costs like bribes. Moreover, by organizing the information, the nature ofcorruption (whether bribes are paid voluntarily or extorted) and the size of payments can beeffectively highlighted and racked. The feedback also allows for the extrapolation of theamount of private resources spend to compensate for poor service provision (e.g., waterpurifiers, voltage stabilizers, private tuitions etc.)11
Citizen Report Cards are a powerful tool when used as part of a local or regional plan toimprove services. Institutions undertaking a program to improve services could use CRCs todetermine the types of changes that are necessary and to evaluate the impact of theirintervention.2.3 Outcomes of Citizen Report CardsThe concept of citizen feedback surveys to assess the performance of public services isrelatively new, and fast gaining wide acceptance. The responses to Citizen Report Cardsindicate impact at four levels:Stimulating Reforms: Citizen Report Card studies can clearly bring to light a wide panoplyof issues, both quantitative and qualitative that could send strong signals to public serviceproviders. The use of a rating scale permit the respondents to quantify the extent of theirsatisfaction or dissatisfaction with the service of an agency, as well as different dimensions ofits service. The inter-agency comparisons that a report card permits make possiblequantification and rankings, which demand attention in a way that anecdotes do not.Activating Stakeholder Responsiveness: Many public agencies have used the Citizen ReportCard findings as a diagnostic tool to trigger off further studies and strategies for internalreforms. These findings have also helped the senior leadership to monitor effectiveness ofservice delivery across wide areas, in a simple and direct manner and free of technical details.For administrators and planners, CRC findings have provided insights into aspects of servicedelivery where greater care, supervision and investment may be required.Raising Public Awareness: Citizen Report Card findings are always placed in public domainand disseminated widely through the media. Needless to say, specific findings and thenovelty of the method used, make it useful and attractive for the media. Since issues of poorpublic service come up from time to time, the media as well as researchers link it to CitizenReport Card findings, and use the valid and reliable base for raising issues and proposingchange.Mobilization of State – Public Partnerships: Seminars and meetings are an integral part ofdisseminating Citizen Report Card findings, and involve both government officials andrepresentatives of civil society organizations and NGOs. Citizen Report Cards have givencivil society organizations a handy tool to focus on issues of concern and stimulated them tomove from anecdotal and subjective issues to facts and figures while requesting publicservice agencies for specific improvements in priority areas. It also provided these groupswith an opportunity to understand the constraints under which service providers’ function,and explore options for community initiatives for problem solving.In short, the insights derived from CRCs can shed light on the degree to which pro-poorservices are reaching the target groups, the extent of gaps in service delivery, and the factorsthat contribute to any misdirection of resources and services. They help identify issues thatconstrain the poor from accessing and using the services, like availability, ease of access,quality, reliability and costs. CRCs also help to identify possible ways to improve servicedelivery by actively seeking suggestions from citizens. Finally, CRC findings help test fromthe citizens’ point of view some of the policy conclusions reached in other analytical studies.12
3 GENERAL PROFILE A sample of 521 households were taken from Kolazhy Grama Panchayat forthe study4 Demographic Features4.1 Composition of Household The household composition in terms of adults and children show that 65%are adults and 35% are children. The average household size of a family is 6Table 6: Composition of HouseholdCategory Number Average Number of PersonsBelow 18 Years 982 2Adults 1857 4TOTAL 2839 64.2 Gender of the Head of the Household 93% of the families are headed by males and 7% of the households areheaded by females.Table 7: Gender of the Head of the HouseholdGender Number PercentageMale 486 93Female 35 7TOTAL 521 1004.3 Age Distribution of the Respondent Majority of the respondent are below 35 years of age (52%). 32% of respondents come in the age group of 36 to 50.Table 8: Age Distribution of the RespondentAge Category (in Years)Number of Families PercentageLess than 35 273 5236 to 50 164 3251 to 70 76 15Above 70 8 1TOTAL 521 10013
4.4 Educational level of respondentsThe educational level of the respondents are given belowTable 9: Level of Education of the RespondentLevel Number PercentageIlliterate 13 2.5Literate but not Formal 2 0.4Lower Primary 69 13.2Upper Primary 112 21.5SSLC 216 41.5PDC/Plus Two 74 14.2Degree and Above 35 6.7TOTAL 521 100 Majority of the respondents are having school education 41.5 % are having S.S.L.C 2.5 % are illiterates4.5 Occupation of the head of the household The occupational pattern of the head of the households shows that 23% arenon-agricultural labourers and 22% are private employees.Table 10: Occupational Pattern of the Head of the HouseholdOccupation Number PercentageNon-Agricultural Labour 119 23Small Trade 29 5Agricultural Labour 31 6Mason 38 7Govt. Employee 35 7Unemployed 21 4Farmer 24 5Private Employee 115 22Other Business 95 18Housewife 14 3Total 521 10014
4.9 Nature of ownership of the house The table given below indicates that most of the respondents (94%) live intheir own houses and those living in rented houses constitute only 6% of thetotal sample householdsTable 14 :Nature of Ownership of HouseCategory Number PercentageOwned 489 94Rented 32 6TOTAL 521 1004.10 Household facilities The households have reasonably good facilities 54% of the respondents have LPG connection 94%have electricity connection in their houses 28% have telephone connection 74% have television sets at their homeTable 15: Household FacilitiesItem Number PercentageCooking Gas 281 54Electricity 490 94Telephone (land line) 144 28Television 385 744.11 Sample Units for Data collectionResponse from 521 house holds have been collected. from one sample housedetails more than one sectors is collected. Table 16 gives the number of householdsfrom which sector-wise details are collected.Table 16:Response from SectorsServiceNumberEducation 44Health 295ICDS 265Panchayat Service 276Sanitation 355Governance 41716
SECTOR WISE DETAILS5 EducationIt is reported that only 44 households have at least one child going to thegovernment primary school. Details collected from 44 households.5.1 Gender of the eldest school going child The table below shows that 64% of the eldest school going children are boysand 36% are girls.Table 17: Gender of Eldest School Going ChildGender Number PercentageMale 28 64Female 16 36TOTAL 44 1005.2 Age distribution of the eldest school going child The age distribution of the eldest school going child ranges from 6 years to 10years. 34% are 6 years of age. 23% are 9 years old.Table 18: Age Distribution of the Eldest School Going ChildAge(years) Frequency Percentage6 15 347 8 188 9 209 10 2310 2 5TOTAL 44 1005.3 Distribution of children in various classes17
Highest percentage of the children (34%) are studying in 4 th standard and25% of them are in 1 st standard.Table 19: Distribution of Children in various ClassesClass Frequency Percentage1 11 252 8 173 9 224 15 346 1 2TOTAL 44 1005.4 Category of School The table given below shows that 98% students study in Govt. LowerPrimary School and 2% in Govt. Upper Primary School.Table 20: Category of SchoolCategory Number PercentageGovernment LP School 43 98Government UP School 1 2TOTAL 44 1005.5 Type of schoolsTable 21: Type of SchoolTypes of schoolsNo. of childrengoingPercentageBoys only schools 0 0Girls only schools 0 0Mixed schools 44 100Total 44 100 All students are studying in mixed schools.5.6 Medium of instructionTable 22: Medium of instructionMedium of instructionNo. ofrespondentsPercentageMalayalam 44 10018
English 0 0TOTAL 44 100 Malayalam is the medium of instruction of all students.5.7 ACCESS TO SCHOOL5.8 Distance to School Most of the students (59%) have access to school within a distance of 1 k.m. 41% has to cover a distance of 1 k.m. to 3 k.m.s to reach the school.19
Table 23: Distance to SchoolDistance Number PercentageLess than 1 k.m. 26 591 k.m. to 3 k.m. 18 41TOTAL 44 1005.9 Mode of travel of children to schoolTable 24: Mode of travelMode of transport Number PercentageBy foot 35 80By bus 6 14By autorikshaw 3 6Total 44 100 80% of the students are going to school by foot. 14% are going by bus and 6% by autorikshaw.5.10 Regularity of children to school 93 % students are going to school regularly 7 % are irregular due to illnessTable 25: Regularity of children to schoolRegularity Number Percentage Reasons of irregularityRegular 41 93Irregular 3 7 illnessTOTAL 44 1005.11 Facilities and services in the school.Table 26: Facilities and services in the schoolFacilitiesResponses/services Yes % No %Good condition ofwall and roof of25 57 19 43school buildingSeparate class roomfor each classes44 10020
Pucca partition ofclassroom44 100Availability of benchand desk to all43 98 1 2childrenUsable latrine in theschool44 100Separate latrine forboys and girls37 84 6 14Facility for drinkingwater43 98 1 2Good quality ofwater27 63 17 37Electrified classroom 34 77 10 23Library in the school 42 96 2 4Laboratory in theschool2 4 42 96Use of computer asa teaching aid for 37 84 7 16computer educationMedical check-up inthe school during2005-0643 98 1 2 57% reported that the school building is good. It has been reported that all schools have separate class room with benchesand desks 77% reported that the class rooms are electrified. 96% informed that library is there in the school. Majority of the students (96%) reported that there is no laboratory in theirschool. 84% reported that they have computers as teaching aids.5.12 Availability of drinking water. 98% of the respondents reported that there is drinking water facility inschools. Only 63% reported that the water is good for drinking.5.13 Toilet facility Latrines are available in all schools and all of the respondents reported thatchildren are using it.21
84% of the respondent informed that there are separate latrines available forboys and girls.5.14 Medical check up for children in schools Most of the respondents (98%) reported that medical check up has beenconducted.5.15 Distribution of materials and its timeliness 75% of the respondents have received free text books and out of which 97%of them have got it in time. 32% have got free note books. 68% of the children have got free uniforms and all of them have received it intime.Table 27 :Distribution of Materials and its TimelinessGiven Free Given in TimeItemsPercentage toTotal HavingNumber Percentage Number MaterialsFree Text Books 33 75 32 97Free Note Books 14 32 13 93Free Uniforms 30 68 30 1005.16 Regularity of teachers, monitoring and evaluationby teachers and happiness of children The table given below indicates that there is regular monitoring andevaluation by teachers at school. 98% have reported that monthly examinations are held regularly 96% have reported that progress cards are issued on time. 96% reported that home work is given regularly. 98% are of the opinion that teachers are regularly coming to schoolsTable 28: Regularity of teachers, monitoring and evaluation byteachers and happiness of childrenYesNoNumber % Number %Regular43 98 1 2attendance ofteachersConduct of 43 98 1 2monthly examsDistribution of 42 96 2 4progress card22
Giving homework 42 96 2 4Evaluation and 39 93 3 7correction ofhomeworkHappiness of 43 98 1 2children at studies5.17 Functioning of PTA Out of 44 respondent 40 (91%) are satisfied about the functioning of ParentTeacher Association5.18 Visit to schools and problems 91% of the parents have visited the school during the year and 9% of themhave never visited the school5.19 Problem solving at schoolThere is no problem with the school.5.20 Level of satisfaction with the school services From the table given below it is clear that majority of the respondents aresatisfied with the services at school. Regarding the quality of teaching 72% are completely satisfied and 68% arecompletely satisfied about the attitude of teachers. While considering the overall satisfaction level about the school service, 60%are completely satisfied, 13% are partially satisfied and 17% are not satisfiedat all.Table 29: Level of Satisfaction with the School Services(All Figures are Percentage)Completely PartiallyIndicatorsDissatisfied Indifferent TotalSatisfied SatisfiedStudy Material 69 9 22 0 100Quality of Teaching 72 10 18 0 100Playground 61 11 12 16 100Toilets 56 9 19 16 100Attitude of Teachers 68 9 12 11 100Overall Satisfaction 60 13 17 10 10023
5.21 How satisfied are the people with school activities The level of satisfaction is high is the case of attitude of teachers, quality ofteaching and availability of study materials In the case of infrastructure facilities like playground, toilet facility etc thelevel of satisfaction is between 56 and 61%. The overall satisfaction reported is 60%5.22 Rating on school services Average mark given by the respondents is 56.21 percent5.23 Reasons for dissatisfaction Out of large number of reasons, the major reason for dissatisfaction is lack ofinfrastructure facilitiesTable 30: Reasons for dissatisfactionReasonsPercentageLack of adequate infrastructurefacilities19Lack of availability of study materialsin time3Quality of teaching 4Activities of teachers 2Total 285.24 Change in quality of service over past four year From the table it is clear that 84% have reported that the quality of serviceshas been better over the past four years.Table 31: Change in Quality of Service over Past Four YearsResponse Number PercentageBetter 37 84.1No responding 7 15.9Total 44 10024
5.25 Suggestions for improving the school services Suggestion for improving the services of the school is detailed in the tablegiven below. The main suggestion for improvement is regarding the buildingand water supply.SuggestionTable 32: Suggestions for Improving the SchoolNumber of Number of Number ofSuggestions Suggestion Suggestionas First as Second as ThirdPreference Preference PreferenceTotalNumber ofSuggestionImpr. Std ofCurriculum 0 1 0 1Need Computer 1 1Need Desk andBench 1 1 2Impr. BuildingFacility 15 1 0 16To have ownbuilding 4 4Need SportsMaterials 1 1Need Water supply 2 2 46 HEALTH SECTORA sample of 295 households was selected to study the Health Sector.6.1 Gender of the respondent The gender composition of the respondents shows that 67% are female and33% are male.Table 33: Gender of the RespondentGender Number PercentageMale 98 33Female 197 67TOTAL 295 10025
6.2 Age of the patient Age distribution shows that 39.6% participants are in the age group of 19-45. 14 % are old people having age greater than 65 years.Table 34:Type of IllnessAge group number percentage1-6 33 11.37-12 17 5.813-18 12 4.019-45 116 39.646-65 74 25.3Above 65 41 14Total 293 1006.3 Type of illness People go to Govt. health centres for treatment of minor illness Majority of respondents (40%) have availed the services of health centre forfever. 19% went for body pain.Table 35:Type of IllnessIllness Number PercentageFever 119 40Body Pain 56 19Skin Disease 31 11Joint Pain 30 10Asthama 20 7ENT 13 4Pressure 13 4Karappan 7 2Gastratis 4 1Sugar 2 1Heart 1 1TOTAL 295 1006.4 Usage of health institutions Majority of the respondents (56%) use Ayurveda dispensary 42% of them use Govt. Homeo Dispensaries.26
Table 36: Usage of Health InstitutionsInstitutions Number PercentagePrimary HealthCentre 4 1Sub-Centre 4 1AyurvedaDispensary 162 56Homeodispensary 125 42Total 295 1006.5 Type of patients All patients are out patientsTable 37:Types of treatmentsType of treatments Numbers PercentageOutpatient 295 100Inpatient 0 0Total 295 1006.6 Access to health institutions The below table shows that 53% of the respondents have to travel only 1k.m.to 3 k.m.s to reach the nearest health centre. 44% of them have public health institutions within a distance of 1km fromtheir residenceTable 38: Distance to Health InstitutionsDistance Number PercentageLess than 1 k.m. 129 441 k.m. to 3 k.m. 156 533 to 5 Km 10 3Total 295 1006.7 Availability of doctor 96% of the respondents reported that the doctor was present when theyarrived27
Presenceof doctorPresence ofdoctor,whenpatientarrivedTable 39: Presence of doctorYesNoNumber Percentage Number Percentage282 96 13 46.8 Availability of facilities for out patients Majority of respondents reported that the facility for waiting is available 56% reported that toilet facilities are available.6.9Table 40: Availability of facilities for out patientsFacilityYesNoNumber Percentage Number PercentageWaiting272 92 23 8facilitiesToiletfacilities164 56 131 446.10 Availability of medicine Only 52 % of the respondents informed that the medicines are alwaysavailable. 14 % did not get any medicineTable 41: Availability of MedicineFrequency ofAvailability Number of Respondents PercentageAlways received 153 52Occasionally received 100 34Never received 42 14TOTAL 295 1006.11 Quality of medicine 82 % received good medicine 18 % received outdated medicine28
Table 42: Quality of MedicineOpinionNumber ofRespondents PercentageGood Medicine 242 82Outdated Medicine 53 18TOTAL 295 1006.12 Effectiveness for treatment Majority of the respondents (62%) had been cured of their illness by thetreatment of the Govt. health centres. In the case of 38 % the illness is continuing.Table 43: Effectiveness of TreatmentCured with Treatment 183 62Not Cured 112 38TOTAL 295 1006.13 Alternative choice to cure the diseasesTable 44: Alternative choice to cure the diseasesAlternative Number PercentageWent the private53 47hospital/doctorWent to other public46 41health institutionsNot went to anywhere 13 12Total 112 100 As an alternative choice 47% of patients went to private hospital/doctor 41% visited other public health institution to cure the disease. 12% didn’t approach another doctor.6.14 Problem faced by the patients There have not been any major problems with the hospital6.15 Speed money No bribery is reported by the respondents29
6.16 Level of satisfaction on health services Only 55% of the respondents are completely satisfied with the duration forConsideration, 17% are partially satisfied. 23 % are dissatisfied with the nurse’s behaviour Only 54% are completely satisfied with staff’s mentality to help. Only 48% of the respondents are completely satisfied about the neatness ofthe institute Only 50% are completely satisfied about the availability of medicines. Only 49% of the respondents are completely satisfied with the overallperformance.Table 45 : Level of Satisfaction on Health Service(All figures are in percentages)IndicatorCompletely PartiallySatisfied SatisfiedDissatisfied IndifferentDuration forConsideration 55 17 20 8Doctor'sBehaviour 58 17 18 7Nurse'sBehaviour 60 15 23 2OthersMentality toHelp 54 20 21 5Neatness ofInstitute 48 21 24 7Availability ofMedicine 50 20 25 5GeneralOpinion 49 19 26 66.17 Rating of health services Average mark given by the respondents is 46.5percent30
6.18 Change in the quality of service over past fouryears Regarding the quality of services over past few years, majority of therespondents (73%) are of the opinion that it has been better. But 2% are of the opinion that the situation has been worsened.Table 46: Change in Quality of Service over Past Four YearsResponse Number PercentageBetter 216 73Equal 19 6Worsen 6 2No Responding 54 19Total 295 1006.19 Suggestion for improving health services Majority of the suggestions point out to the need for appointing a permanentdoctor in the Govt. health centres, making the medicines available and facilityfor admitting patients.Table 47: Suggestions for Improving Health ServicesNumber of Number of Number ofSuggestions Suggestion as Suggestionas First Second as ThirdPreference Preference PreferenceTotalNumber ofSuggestionSuggestionPermanent Dr.Required 16 1 0 17Facility forAdmit 14 3 17 34Make availableMedicine 26 7 0 33Need building 6 0 0 6Facility forWaiting 4 1 0 5Latrine FacilityRequired 1 0 1 2Drinking WaterNeeded 0 0 3 3Doctors Serviceis required inEvening 2 2 0 4Two Doctors 2 1 0 331
RequiredDoctor shouldcome in time 6 4 5 15Pharmacist &Nurse shouldcome every day 7 3 1 11Token system 1 0 0 1Laboratory 9 10 2 21Increase Staff 3 0 0 3Electrification 0 0 1 17 INTEGRATED CHILD DEVELOPMENT SCHEME (ICDS) A sample of 265 households was selected to study the ICDS.7.1 Number of Children from a household to Anganwadi From majority of the households (89%) only one child is going to AnganwadiTable 48: Distribution of Children in AnganwadisNumber of Children toAnganwadi Number of Families Percentage1 236 892 23 93 6 2Total 265 1007.2 Nature of ownership of Anganawadi building Majority of the respondents (58%) have reported that the anganwadibuildings are on rent. Only 38% has own building32
Table 49: Nature of Ownership of Anganwadi BuildingType of Ownership Number of Respondents PercentageOwn 102 38Rental 154 58Youth Club/MahilaSamajam 9 4Total 265 1007.3 Access to Anganawadi 91% of the respondents have access to Anganwadi within a distance of 1k.m. from their residence.Table 50 : Distance to AnganwadiDistance Number PercentageLess than 1 k.m. 242 911 k.m. to 3 k.m. 23 9TOTAL 265 1007.4 Regularity of Anganawadi teacher Majority of the respondents (85 %) have reported that the teachers comeregularly.Table 51 : Regularity of TeacherRegularity Number of Respondents PercentageRegular 225 85Occasional 40 15Total 265 1007.5 Awareness about Anganawadi 91% of the parents have sent their children to Anganwadi by their owndecision For 7% of them, it was as suggested by the Anganwadi teacher.Table 52 : Awareness about the AnganawadiSource of InformationNumber of FamiliesSelf 242 91Anganawadi Teacher 19 7Others 4 2Total 265 10033
7.6 Facilities and service at anganawadi 65% of the respondents have reported that there is enough space for childrenin the Anganwadi building. 96% have reported that nutrient food is given Toys have been provided to children as informed by 76% respondents. Only 64% reported that growth chart has been maintained. According to 71% of the respondents, there is medical check up in every 3months.Table 53 : Facilities and service at anganawadiFacilities/servicesResponsesYesNoNumber Percentage Number PercentageEnough space forchildren173 65 92 35Giving nutrient food 255 96 10 4Provide toys tochildren201 76 64 24Keep growth chart 169 64 96 36Medical check up inevery 3 months188 71 77 29 The major food items provided in the Anganwadi are ‘Kanji’ Beans and ‘Upma’7.7 Vaccination to children 60% of the respondents reported that children have received poliovaccination. BCG and DPT are other vaccinations given at Anganwadi.7.8 Service during pregnancy The table below shows the services obtained during pregnancyTable 54 : Services during pregnancyServicesNumber of women received the serviceMeasuring weight 23Nutrient food 30Others 634
7.9 Post natal servicesA very few lactating women obtained services from aganawadi teacher. Thedetails are as follows.Table 55 : Service after DeliveryNumber of mothersServicereceived the servicesInformation on need for cleanliness 9Encouragement of Breast Feeding 87.10 Problems faced There is no major problem with Anganwadies. The minor problems are solvedthen and there7.11 Level of Satisfaction on Anganawadi ServicesTable 56 : Level of Satisfaction on Anganawadi ServicesAll figures are in percentagesIndicatorCompletelySatisfiedPartiallySatisfied Dissatisfied IndifferentBehaviour of Teacher 90 6 1 3Behaviour of Helper 82 11 4 3Supply of Food 76 18 5 1Supply of Toys 44 35 15 6Service duringpregnancy 14 24 31 31Service duringdelivery 11 15 39 35Providing preventivemeasures 23 25 21 31General 42 44 6 8 Level of satisfaction in terms of complete satisfaction, is low in the case ofservices obtained by pregnant and lactating women. In general, complete satisfaction is only for 42 percent7.12 Rating on anganawadi services An average mark of 47.71 percent is given by the respondents35
7.13 Reasons for dissatisfaction The major reasons for dissatisfaction are Absence of own building Attitude of teacher Lack of toys No vaccination Absence of toilet facility Lack of space in the anganawadi7.14 Change in quality of service over past four years Majority of the respondents (66%) reported that the quality of services hasbeen better comparing the past four years. 2% have reported that it has been worsened.Table 57 : Change in Quality of Service over Past Four YearsResponse Number PercentageBetter 175 66Equal 17 6Worse 5 2No Responding 68 26Total 265 1007.15 Suggestions for improving ICDS services The table given below show the suggestions for improving the quality ofservices of Anganwadi.Table 58 : Suggestions for Improving ICDS ServicesNumber of Number of Number ofSuggestions Suggestion Suggestionas First as Second as ThirdPreference Preference PreferenceTotalNumber ofSuggestionSuggestionGood Building isrequired 51 3 3 57Neat cooking isrequired 1 1 4 6Good Latrinerequired 2 2 2 6Drinking water 1 11 4 1636
facilityElectrification isrequired 3 3 6 12Standard ofstudy should beimproved 4 2 3 9Own building isrequired 42 1 2 45RegularNutrition isrequired 6 4 1 11PermanentEmployeesRequired 1 3 2 6Improve serviceof employees 4 5 3 12People shouldbe informed 1 2 4 7Road Facility isrequired 1 3 2 6Toys arerequired 12 2 3 17Play Ground isrequired 1 1 1 3 It can be noted that majority of the suggestions points out to the need forimproving the Anganwadi building and to have other infrastructure facilities.8 SERVICES FROM <strong>PANCHAYAT</strong> OFFICE A sample of 276 Households was selected to study the quality of servicesfrom Panchayat Office8.1 Purpose of visit to panchayat office during last oneyear Most of the respondents (67%) have visited the Panchayat office during thelast one year to pay the building tax. 14% visited to obtain the certificates.Table 59 : Visit to Panchayat During Last YearNumber ofPurposeRespondents PercentageCertificate 40 14Building Permit 9 3Trade License 8 337
Pay Building Tax 186 67Pay Employment Tax 2 1Ownership Certificate 8 3Number for Building 12 5Others 11 4Total 276 1008.2 Purpose of last visit to Panchayat office 63% of the respondents have visited the Panchayat Office previous time topay the building tax.Table 60 : Reason for Last Visit to PanchayatNumber ofPurposeRespondents PercentageCertificate 34 12Building Permit 7 3Trade License 6 2Pay Building Tax 176 63Pay Employment Tax 2 1Ownership Certificate 7 3Number for Building 11 4Others 33 12Total 276 1008.3 Interface with panchayat office 96% of the respondents have approached the Panchayat Office directly fortheir purpose. 4% have utilized the service of an agent. Nobody paid money for utilizing the service of agentTable 61 : Interface with PanchayatNumber ofMode of InterfaceRespondents PercentageDirect 265 96Agent 11 4Total 276 10038
8.3.1 Reasons for utilizing service of agents The following are the reasons for employing an agent For speed To avoid difficulty Lack of time Lack of information8.3.2 Time spent at panchayat office Majority of the respondents (64%) had spent 11 to 30 minutes in thePanchayat office to meet their purpose.Table 62 : Time Spent at Panchayat OfficeNumber ofDurationRespondents PercentageUp to 10 Minutes 17 611 to 30 Minutes 170 6430 to 60 Minutes 46 18Above 60 Minutes 32 12TOTAL 265 1008.3.3 Number of visits to panchayat office for the last purpose The table below shows that 62 % of the respondents was able to fulfil theirpurpose with a single visit to the Panchayat Office. 20 % visited 3 times for their purposeTable 63 : Number of Visit for Last PurposeNumber of VisitsNumber ofRespondentsPercentage1 164 622 47 183 53 20Above 3 1 0Total 265 1008.3.4 Loss of wage days due to visit to panchayat office 25 respondents have lost one wage day due to their visit to the PanchayatOffice.39
Table 64 : Number of Man days Lost due to Visit to PanchayatNumber ofNumber of Man daysRespondents Percentage1 25 762 7 213 1 3Total 33 1008.3.5 Loss of wage per dayTable 65: Loss of wage per daysWage per days (Rs) Number ofPercentagerespondentsRs. 25- Rs.100 20 61Rs.101- Rs.200 11 33Rs.201- Rs.500 2 6Rs.500 and above 0 0Total 33 100 20 persons have a loss of Rs.. less than 100 each. 11 persons have a loss of Rs.100- Rs.200 each.8.3.6 Problem faced at panchayat office There has not been any problem other than procedural delay8.4 Level of satisfaction on panchayat office serviceThe table below shows the level of satisfaction of the respondents about thefunctioning of the Panchayat Office.40
Table 66: Level of Satisfaction on Panchayat Office(All figures are in percentages)IndicatorCompletelySatisfiedPartiallySatisfied Dissatisfied IndifferentNotApplicable TotalInformation onWorking Hours 77 12 5 4 2 100Waiting Time &Facility 80 9 7 3 1 100Procedure andProcess 70 23 6 1 100Simplicity infilling of forms 65 17 7 4 7 100Attitude ofOfficers 50 20 10 10 10 100Speed inProcessing 44 41 13 1 1 100Transparency infixing fees/rates 52 12 32 2 2 100General Opinion 40 16 41 1 2 100 Only 40% are completely satisfied on the overall performance of thepanchayat office. 41% reported dissatisfaction on this matter.8.5 Rating on panchayat office services Average mark given by the respondents is 52.8 percent8.6 Reasons for dissatisfaction Neglected though eligible Complexity of procedures Attitude of staff Availability of staff Illegal activities Lack of information counter Lack of transparency41
8.7 Changes in the quality of service over past fouryears 65% of the respondents feels that the quality of services have been betterover the past 4 years. 14% of them reported that it has been the same.Table 67 : Change in Quality of Service over Past Four YearsResponse Number PercentageBetter 172 65Equal 38 15Worse 6 2No Responding 49 18Total 265 1008.8 Suggestions for Improving Panchayat OfficeServices The table below shows the suggestions for improving the functions of thePanchayat Office.Table 68 : Suggestions for Improving Panchayat Office ServicesSuggestionNumber ofSuggestionsas FirstPreferenceNumber ofSuggestionas SecondPreferenceNumber ofSuggestionas ThirdPreferenceTotalNumber ofSuggestionEvery ward should havefacility 3 2 1 6Computer is required forOffice 1 2 2 5Benefit Should be given toall eligible 1 1 1 3Panchayat Staff should keeptime 1 1 2 4Demand should be attendedwithout delay 5 1 3 9Transparency in procedure 6 1 2 9Facility for information 1 1 1 3Change attitude ofEmployees 3 1 4 8Sanitation facility is required 1 1 2 442
8.9 Speed Money No speed money is reported by the respondents43
8.10 Awareness about citizen charter It is pathetic to note that only 7% of the respondents are aware of the citizencharter and only 2% have seen it.Table 69 : Awareness about citizen charterDescription YesNoNumber Percentage Number PercentageHave knownabout thecitizen charter 19 7 246 93Have seen thecitizen charter 6 2 259 989 SANITATION A sample of 355 households was selected to study the sanitation activities ofthe Panchayat.9.1 Opinion of respondents on sanitation activities ofpanchayat. Out of the 355 households taken as the sample to enquire about thesanitation activities of the Panchayat, Majority of them (64%) reported thatPanchayat has not done any sanitation activities. 33% have reported that Panchaayat is cleaning the roads.Table 70 : Opinion of Respondents on Sanitation Activities ofPanchayatActivityNumber ofRespondentsPercentage tototal (322)Cleaning of Roads 117 33Cleaning of Drainages 10 3Other Services 1 0No Service 227 64Total 355 10044
9.2 Availability of latrine in the house Most of the respondents (99%) have toilets in their home.Table 71 : Availability of LatrineNumber ofDescription RespondentsPercentageAvailable 353 99NotAvailable 2 1Total 355 100 99% respondents have latrine in their houses9.3 Type of latrine All do not have quality toilets 93 % have toilets with a closetTable 72 : Type of LatrineTypeNumber ofRespondents PercentageOpen 10 3Pit 6 2With Closet 331 93Others 6 2Total 353 1009.4 Source of finance for latrine 87% of the respondents have used own money to construct the latrine.Table 73 : Source Finance for LatrineNumber ofSourceRespondents PercentageOwn Recourses 309 87Own Recourses & Govt. Support 35 10Govt. Support 11 3Total 355 1009.5 Reason for not having a quality latrine Lack of money is the major reason for not having a latrine45
9.6 Sensitisation about sanitation during last one year Only 1% of the respondents reported that Panchaayat has conductedsensitisation programmes on sanitation. Majority of the respondents have reported that no advise was given tothem by anybody.Table 74 : Sensitisation About SanitationNumber ofAgencyRespondents PercentagePanchayat 4 1NGO 8 2PHC 11 3Kudumbashree 4 1Anganwadi 2 1School 4 1Hospital 5 1Others 55 15No Advice 262 75Total 355 1009.7 Flow of waste water from kitchen, bathroom etc.Table 75 : Flow of waste water from kitchen, bathroom etc.DescriptionNumber ofPercentagerespondentsTo the open place out of79 22the compound throughdrainageTo a pit in the compound 269 76To open places in the7 2compoundTotal 355 1009.8 Household waste disposal The table given below shows the process of disposal of waste fromhouses. 12% throw their waste to canal 22 % of them into open land46
64 % burn their wastes 2 % waste compostingTable 76: Process of Disposal of WasteNumber ofDescriptionRespondents PercentageThrowing to canal 43 12Throwing to open land 78 22Burning 227 64Composting 7 2Total 355 1009.9 Level of satisfaction on sanitation activities ofpanchayat The table given below shows the level of satisfaction on sanitation activities ofthe Panchayat. Only 45% of the respondents are completely satisfied about the cleaning ofroads, 44% on cleaning drainage, 32% on the maintenance of Public latrines,40% on the procedures of providing latrines,. Considering the overall factors only 28% of the respondents are completelysatisfiedTable 77 : Level of Satisfaction on Sanitation Activities of PanchayatAll figures are in percentagesIndicatorCompletelySatisfiedPartiallySatisfied Dissatisfied IndifferentNotApplicable TotalCleaning Road 45 15 34 5 1 100CleaningDrainage 44 15 36 3 2 100Operation ofPublic Toilets 32 30 25 12 1 100Procedure ofProvidingLatrine 40 30 12 14 4 100GeneralOpinion 28 34 14 21 3 1009.10 Rating on sanitation activities47
Average mark for the sanitation activities given by therespondents is 32 percent9.11 Reasons for dissatisfaction The reasons for dissatisfaction are the neglect of Panchayat in sanitationactivities There is no solid waste management system No public composting facility is available Lack of public latrine9.12 Suggestions for improving sanitation activities The table given below indicate the major suggestions obtained for improvingthe sanitation activities.Table 78 : Suggestions for improving sanitation activitiesNumber of Number of Number ofSuggestions Suggestion Suggestionas First as Second as ThirdPreference Preference PreferenceTotalNumber ofSuggestionSuggestionSensitisationforsanitation 13 15 10 38Publiccompostfacility 17 18 14 49Facility forSolid WasteManagement 19 15 14 48Clean publicwells 40 38 32 110Sanitationfor all isrequired 10 8 4 22Banning ofPlastics 15 10 4 29Sewagefacility isrequired 36 34 28 98Mosquitoeradication 32 22 14 68Organise 12 10 8 3048
MedicalCamp10 Interface with panchayat A sample of 417 households was selected to assess the interface withPanchayat10.1 Visit to panchayat office during last year Majority of the respondents (53%) have visited the Panchayat 1to 3 timesduring the previous year. Repeated visits indicates inefficiency of the officeTable 79: Visit to panchayat office during last yearNumber of timesNumber ofPercentagerespondents1 to 3 times 219 534 to 5 times 52 125 to 10 times 10 2Above 10 times 2 0Never visited 134 33Total 417 10010.2 Timely notice on grama sabha meeting 91% of the respondents have reported that they have received notice forGrama Sabha meeting. 9 % did not have any informationTable 80: Timely notice on grama sabha meetingDescriptionsRespondentsNumber PercentageReceived notice for grama sabha meeting 380 91Not received notices for grama sabha 37 9meetingTotal 417 10049
10.3 Number of grama sabha meetings attended duringlast year The below table illustrates that 29% respondents have attended GramaSabha 2 times. 26% attend only 1 time. 48% of households never attended the Grama Sabha meeting during lastyear.Table 81: Number of grama sabha meetings attended during last yearNumber of timesRespondentsNumberPercentageOne time 108 26Two time 121 29Three time 15 4Four time 12 3Never attended 161 48Total 417 10010.4 Membership in Kudumbasree/ NeighbourhoodGroups (NHG) 56% of the respondents are having membership in Kudumbasree.Table 82: Membership in Kudumbasree/ Neighbourhood Groups (NHG)RespondentsYesNoNumber Percentage Number PercentageAny memberhavingmembershipinkudumbashreeNHG233 56 184 4410.5 Rating on interface with Panchayat. Average mark given by respondents is 54.5 percent50
11 SUMMERY AND RECOMMENDATION11.1 EDUCATION11.1.1 Conclusions Children have access to school since all children have schools within 3 k.m. Both girls and boys are studying in the school. Majority of children go to school by foot. Drinking water is provided by the school, but its quality is not good. Majority of students are studying LP school. Children are going to the school regularly. Majority is in Malayalam medium. Toilet is available and students are using it. Medical check up is done at school. Textbooks and uniforms are supplied to students. There is regular monitoring and evaluation of students by teachers. Monthly examinations are conducted. Homework is given. Satisfaction level of parents are good in the case of attitude and activities of teachers. But relating to the facilities and its quality the level of satisfaction is low. The mark given to school is 56.21.11.1.2 SuggestionsInfrastructural facility of the school has to be improved substantially.Benches and desks are to be upgraded.Computers may be provided for teaching.Provide sports materials.Quality of drinking water should be improved11.2 HEALTH11.2.1 Conclusions Majority of patients are females. Around 40 per cent are in the age group of 19 years to 45 years. Health centres are accessible to people. Only outpatients are treated. Facilities are available only to provide minor treatment. Waiting facility is available, but toilet facility is not sufficient. Medicines are not supplied regularly. Some are reporting that outdated medicines are supplied. More than fifty per cent opted for treatment in Ayurveda. Many patients are not cured after treatment. All patients are not satisfied with doctor’s and nurse’s behaviour. Staff’s mentality is not very good. General level of satisfaction is low.51
11.2.2 Suggestions Expand the services to inpatients also. Develop infrastructural facilities, including toilets. Ensure regular supply of quality medicine. Permanent doctors may be appointed. Doctor’s service is required for more time including the evening. Specialised doctors may be appointed. Drinking water facility has to be provided. Waiting facility has to be provided.11.3 ICDS11.3.1 Conclusions Many of the Anganwadies are functioning in rented buildings. Anganwadies are accessible to children, they are located within around onek.m. form their house. People are aware of the services at anganwadies. Food is supplied at anganwadies, but the quality of food is low. Toys are given to children, but it is not sufficent. Medical check ups and vaccination are given by anganwadis. Teachers in general are regular. Level of satisfaction of respondents is low, due to lack of facilities. Marks given to anganwadies is 47.7 per cent.11.3.2 Suggestions Good building is required for anganwadies. Neatness in cocking has to be ensured. Latrine facility has to be improved. Standard of teaching has to be improved. Nutritious food has to be supplied. Permanent employees have to be appointed. Play ground has to be developed.11.4 <strong>PANCHAYAT</strong> SERVICES11.4.1 Conclusions Panchayat office provides licenses and certificates. Majority of respondents visited panchayat office for paying taxes andobtaining certificates. Majority approach directly, but some are approaching indirectly by engagingagents. People have to visit several times the office for the same reason. Level of satisfaction on pachayat service is low.52
Information on working hours is not known to all. Waiting facility is not sufficient. Forms are complicated to fill up. There is no transparency in fixing the rates. The office procedures are cumbersome in nature.11.4.2 Suggestions Procedures have to be simplified for reducing the processing time. Transparency in fixing rates and procedures has to be established. Facilities, including waiting facility have to be improved. Computerisation has to be done to speed up the activities. Forms have to be simplified. Officers have to be regular in attending the office. Citizen’s charter has to be given wide publicity.11.5 SANITATION AND SOLID WASTE MANAGEMENT11.5.1 Conclusions Sanitation activities of Panchayat are very limited. People are having toilets in their home, but the quality of these toilet are notgood in some cases. Sensitisation on sanitation by panchayat is very weak. No solid waste management system is existing in the panchayat. People are throwing their wastes outside their home. There is no public composting facility. Public toilets are not provided by the panchayat. Public wells are not cleaned by panchayat.11.5.2 Suggestions Panchayat has to initiate sanitation activities. Sensitisation on sanitation is required. Public toilets are to be provided. Financial support to the poor has to be given for construction of toilets. Solid waste management system has to be introduced. Public wells have to be kept clean. Public composting facility has to be established by panchayat.11.6 Governance11.6.1 Conclusions People have to visit panchayat office several times for the same purposes dueto the inefficiency of the office. More than fifty per cent of respondents are members of Kudumbashree.53
Many are not receiving any information on grama sabha. Level of satisfaction on interface is very low. The average mark given is 54.5 per cent.11.6.2 Suggestions Wide publicity has to be given to grama sabha. Each member has to be informed about the meeting of grama sabha. More powers and functions have to be given to grama sabha.12 Report CardTable 83: Report CardSectorRating inPercentage GradeEducation 56.21 BPanchayat Services 52.80 BGovernance 54.50 BHealth 46.5 CI.C.D.S 47.71 CSanitation 32.00 DOverall Ratings 48.28 C12.1 Note:A for 60 % and above, B for 50 %-60%, C for 40% to 50%, D for 30% to 40%and E for less than 30%*******54