SPSA - Ceres Unified School District
SPSA - Ceres Unified School District
SPSA - Ceres Unified School District

You also want an ePaper? Increase the reach of your titles
YUMPU automatically turns print PDFs into web optimized ePapers that Google loves.
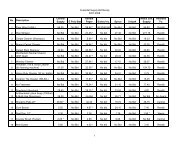
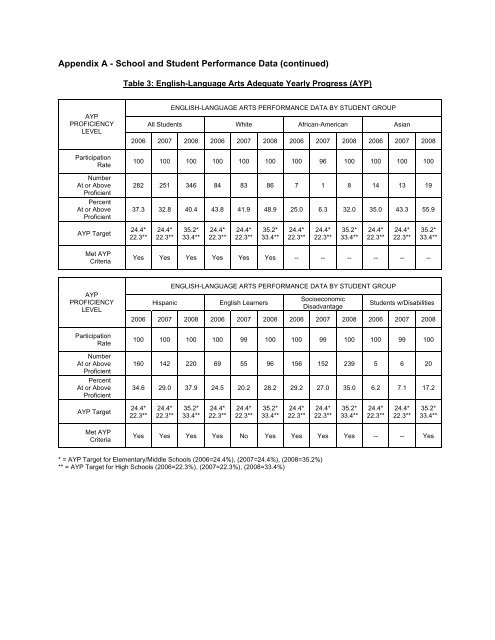
Appendix A - <strong>School</strong> and Student Performance Data (continued)Table 3: English-Language Arts Adequate Yearly Progress (AYP)AYPPROFICIENCYLEVELENGLISH-LANGUAGE ARTS PERFORMANCE DATA BY STUDENT GROUPAll Students White African-American Asian2006 2007 2008 2006 2007 2008 2006 2007 2008 2006 2007 2008ParticipationRate100 100 100 100 100 100 100 96 100 100 100 100NumberAt or AboveProficientPercentAt or AboveProficient282 251 346 84 83 86 7 1 8 14 13 1937.3 32.8 40.4 43.8 41.9 48.9 25.0 6.3 32.0 35.0 43.3 55.9AYP Target24.4*22.3** 24.4*22.3** 35.2*33.4** 24.4*22.3** 24.4*22.3** 35.2*33.4** 24.4*22.3** 24.4*22.3** 35.2*33.4** 24.4*22.3** 24.4*22.3** 35.2*33.4**Met AYPCriteriaYes Yes Yes Yes Yes Yes -- -- -- -- -- --AYPPROFICIENCYLEVELENGLISH-LANGUAGE ARTS PERFORMANCE DATA BY STUDENT GROUPHispanic English LearnersSocioeconomicDisadvantageStudents w/Disabilities2006 2007 2008 2006 2007 2008 2006 2007 2008 2006 2007 2008ParticipationRate100 100 100 100 99 100 100 99 100 100 99 100NumberAt or AboveProficientPercentAt or AboveProficient160 142 220 69 55 96 156 152 239 5 6 2034.6 29.0 37.9 24.5 20.2 28.2 29.2 27.0 35.0 6.2 7.1 17.2AYP Target24.4*22.3** 24.4*22.3** 35.2*33.4** 24.4*22.3** 24.4*22.3** 35.2*33.4** 24.4*22.3** 24.4*22.3** 35.2*33.4** 24.4*22.3** 24.4*22.3** 35.2*33.4**Met AYPCriteriaYes Yes Yes Yes No Yes Yes Yes Yes -- -- Yes* = AYP Target for Elementary/Middle <strong>School</strong>s (2006=24.4%), (2007=24.4%), (2008=35.2%)** = AYP Target for High <strong>School</strong>s (2006=22.3%), (2007=22.3%), (2008=33.4%)