Network Monitoring and Data Center Operation - SOI-Asia
Network Monitoring and Data Center Operation - SOI-Asia
Network Monitoring and Data Center Operation - SOI-Asia
- No tags were found...

You also want an ePaper? Increase the reach of your titles
YUMPU automatically turns print PDFs into web optimized ePapers that Google loves.
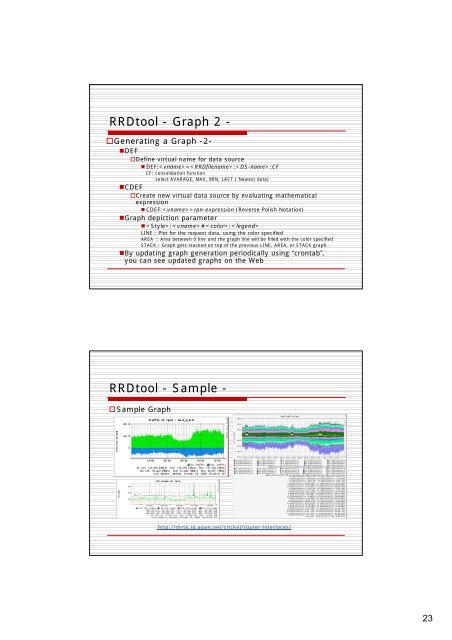
RRDtool - Graph 2 -Generating a Graph -2-•DEFDefine virtual name for data source• DEF:=::CFCF: consolidation functionselect AVARAGE, MAX, MIN, LAST ( Newest data)•CDEFCreate new virtual data source by evaluating mathematicalexpression• CDEF:=rpn-expression (Reverse Polish Notation)•Graph depiction parameter• :#:LINE : Plot for the request data, using the color specifiedAREA : Area between 0 line <strong>and</strong> the graph line will be filled with the color specifiedSTACK : Graph gets stacked on top of the previous LINE, AREA, or STACK graph•By updating graph generation periodically using “crontab”,you can see updated graphs on the WebRRDtool-Sample - Sample Graphhttp://mrtg.jp.apan.net/cricket/router-interfaces/23