Network Monitoring and Data Center Operation - SOI-Asia
Network Monitoring and Data Center Operation - SOI-Asia
Network Monitoring and Data Center Operation - SOI-Asia
- No tags were found...

You also want an ePaper? Increase the reach of your titles
YUMPU automatically turns print PDFs into web optimized ePapers that Google loves.
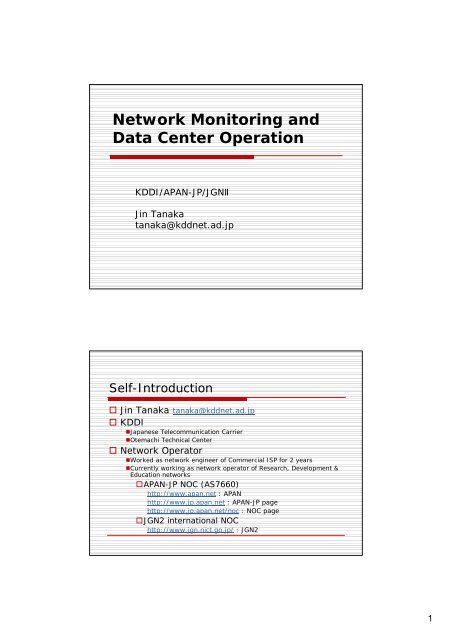
<strong>Network</strong> <strong>Monitoring</strong> <strong>and</strong><strong>Data</strong> <strong>Center</strong> <strong>Operation</strong>KDDI/APAN-JP/JGNJin Tanakatanaka@kddnet.ad.jpSelf-Introduction Jin Tanaka tanaka@kddnet.ad.jp KDDI•Japanese Telecommunication Carrier•Otemachi Technical <strong>Center</strong> <strong>Network</strong> Operator•Worked as network engineer of Commercial ISP for 2 years•Currently working as network operator of Research, Development &Education networksAPAN-JP NOC (AS7660)http://www.apan.net : APANhttp://www.jp.apan.net : APAN-JP pagehttp://www.jp.apan.net/noc : NOC pageJGN2 international NOChttp://www.jgn.nict.go.jp/ : JGN21
Agenda1. Basic Knowledge of <strong>Network</strong><strong>Monitoring</strong>2. <strong>Network</strong> <strong>Monitoring</strong> Tools3. Advanced Tools for Measuring<strong>Network</strong> Performance4. <strong>Data</strong> <strong>Center</strong> <strong>Operation</strong>5. Discussion & QuestionBasic Knowledge of <strong>Network</strong><strong>Monitoring</strong>2
Why <strong>Network</strong> <strong>Monitoring</strong> is necessary?Reliability of network is considered to be more<strong>and</strong> more important• Lifeline, Business, etc. Mission CriticalOccurrence of trouble is inevitable on anynetwork• With current IP technology, it is difficult to make anetwork without trouble!In order to shorten unavailable time• Detect trouble at an early stage• Complete trouble-shoot quicklyIn order to grasp the situation of network• Availability, Performance, RoutingWhat is <strong>Monitoring</strong> 1Basic way of <strong>Monitoring</strong>Classified into three monitoring ways• In Internal <strong>Network</strong> (mostly)• Via External <strong>Network</strong>• Non-network (Emergency case) 1, <strong>Monitoring</strong> in internal3, Independent access(Emergency case)-ISDN, PSTNInternal network<strong>Network</strong> (mostly)External network<strong>Monitoring</strong>Machine2, <strong>Monitoring</strong> via External<strong>Network</strong>- via Peering <strong>Network</strong>- via the Internet3
What is <strong>Monitoring</strong> 2Scheme of <strong>Monitoring</strong>1. Determine the monitoring target (What is the target for monitoring?)2. Set up the monitoring node- Ping to target, SNMP polling3. Establish the threshold- Ping / polling interval, SNMP MIB4. Threshold exceeded5. Notice the alert- Sound, mail, pop-up<strong>Monitoring</strong> is realized in a repetition of the above flow.Trouble-shooting is started when the notice(5) is judged to be trouble!Determination of <strong>Monitoring</strong> Target Select target which is suitable for checkingnormality of network service What is the target for monitoring?• Router Dead or Alive? Status? Performance? Routing?• Server Dead or Alive? Status? Damon? Service Port?• Traffic, etc. Increase or decrease? Dos Attack? Performance? Environment?4
<strong>Monitoring</strong> Method 1 Examine how to monitor the target• Active monitor or Passive monitor Polling = <strong>Monitoring</strong> machines give message inwatching target•Useful for checking the current statusICMP/SNMP polling… Receive trap message from target•Useful for detecting the status changeSNMP trap, syslog… Statistics data•Useful for grasping the trend <strong>and</strong> transition• Select the <strong>Monitoring</strong> Tool Ping (ICMP), SNMP, <strong>Monitoring</strong> Tool, Original Tool, etc.• Check the monitoring Route to Target Internal or External network<strong>Monitoring</strong> Method 2 Examine the frequency of monitoring• <strong>Monitoring</strong> the target on a case-by-case basis orregular basis Is it necessary to monitor regularly usingmonitoring tool or system?• Critical target in providing network service• Statistics data useful to trouble-shooting• Determination of monitoring interval 5/15/30 minutes,1/8/24hours,• Establish the threshold for alert Required for generating alert by quantitativechangeThe best monitoring method is realized in environmentsimilar to actual service condition !5
Notification of Alert How to notify alert• Selection of suitable alert notification function isindispensableGraphical• Pop up message, flashing icon on displayMail• For checking the condition, sent regularly• Sent only when there is state changeSound• Alert has no meaning if operators do not notice thenetwork trouble !<strong>Network</strong> <strong>Monitoring</strong> Tools6
- ICMP/Ping Polling 1 - Check IP reachability by ICMP echo/reply• Additional information RTT (Round Trip Time) Packet Loss TTL (Time to Live) Most st<strong>and</strong>ard way of checking node activity Time series RTT/Packet loss data becomes importantinformation when measuring link performanceRTT: xx msecPacket Loss: xx %TTL: xxICMP echoICMP echo reply- ICMP/Ping Polling 2 -Optional Parameter•In case of daily operation Packet size (byte) Sending interval (sec) Sending count (n) Timeout (sec) TTL (n) Pattern (0x????) etc.•At <strong>Monitoring</strong> system Sending interval Sending count Time outSet up the value which is adapted for critical level or service level!7
UDP/TCP polling Effective in monitoring service ports of server• Using client for service DNS - nslookup• Using telnet WWW,SMTP,POP• Using tool Radius - radpingbash-2.05$ telnet ns.jp.apan.net 80Trying 203.181.248.3...Connected to ns.jp.apan.net.Escape character is '^]'.get501 Method Not Implemented:Telnet with service portreplySNMP - Framework - SNMP: Simple <strong>Network</strong> Management Protocol Polling: UDP 161, Trap : UDP 162 Protocol for monitoring/managing equipment vianetwork Enables us to monitor the state <strong>and</strong> traffic of variousequipment without being dependent on vender Management is realized by UDP between…• monitoring/managing server : Manager e.g. HP Open View, Sun NNM• network equipment : Agent resides in device e.g. Most general technique for acquiring detailedinformation from a router or a switch8
SNMP - Version - SNMP v1 RFC1157• When Manager requests, Agent returns response• Agent sends trap when specific event has occurred SNMP v2 RFC1902• Basic of features are almost the same as those of v1• Additional regulation 64bit counter : can deal with large numerical value Get-bulk request : used to efficiently retrieve large blocks of data Supports the use of encryption of messages SNMP v3 RFC22712275• Additional regulation Various security function : MD5 user authentication,DES encryption Dynamically configure the SNMP Agent using SNMP SETcomm<strong>and</strong>sSNMP - MIB & OID - SNMP Manager can acquire the managementinformation defined by MIB(Management InformationBase) from Agent• Current version : MIBv2 RFC 1213• MIB is the aggregate of object (information) on theequipment which SNMP Agent holds• Identifier is defined for each object = OID• MIB performed by Agent is roughly divided into: MIBv2 : st<strong>and</strong>ard, public, specified by IETF Enterprise MIB : private, specified by vendor company9
SNMP - MIB Tree - Objects are managed by the tree Expressed in a row of values divided by the periodrootccitt(0)iso(1)org(3)dod(6)Internet(1)Joint-iso-ccitt(2)directory(1) mgmt(2) exprimental(3) private(4)mib(1)St<strong>and</strong>ard MIBsenterprise(1)Vendor-specific MIBsSNMP - OID - OID Expression• iso(1). org(3). dod(6). internet(1). mgmt(2). mib2(1)-> .1.3.6.1.2.1e.g. sysDscr = .1.3.6.1.2.1.1.1 = mib-2.1.1 = system.1SubtreeNamesysteminterfacesatipicmptcpudpegptransmissionsnmpOID1.3.6.1.2.1.11.3.6.1.2.1.21.3.6.1.2.1.31.3.6.1.2.1.41.3.6.1.2.1.51.3.6.1.2.1.61.3.6.1.2.1.71.3.6.1.2.1.81.3.6.1.2.1.101.3.6.1.2.1.11DescriptionDefines a list of objects that pertain to system operation, such as the system uptime, system contact, <strong>and</strong> system name.Keeps track of the status of each interface on a managed entity. The interfaces group monitors which interfaces are up ordown <strong>and</strong> tracks such things as octets sent <strong>and</strong> received, errors <strong>and</strong> discards, etc.The address translation (at) group is deprecated <strong>and</strong> is provided only for backward compatibility. It will probably bedropped from MIB-III.Keeps track of many aspects of IP, including IP routing.Tracks things such as ICMP errors, discards, etc.Tracks, among other things, the state of the TCP connection (e.g., closed, listen, synSent, etc.).Tracks UDP statistics, datagrams in <strong>and</strong> out, etc.Tracks various statistics about EGP <strong>and</strong> keeps an EGP neighbor table.There are currently no objects defined for this group, but other media-specific MIBs are defined using this subtree.Measures the performance of the underlying SNMP implementation on the managed entity <strong>and</strong> tracks things such as thenumber of SNMP packets sent <strong>and</strong> received.10
SNMP - SNMP Message H<strong>and</strong>ling 2 - Comm<strong>and</strong> examplesGetRequest GetNextRequest SetRequest SNMP - Trap Message - The way for Agent to inform Manager about event of somethingundesirable Trap originates from Agent <strong>and</strong> is sent to the trap destination, asconfigured within Agent itself When Manager receives a trap, it needs to know how to interpretit PDU• Enterprisevendor identification (OID) for the agent• AgentAddressThe IP address of the node where the trap was generated.• Trap TypeGeneric / Specific (not used)• TimestampThe length of time between the last re-initialization of the agent that issued a trap <strong>and</strong>the moment at which the trap was issued12
<strong>Monitoring</strong> Software - HP OpenView - HP OpenView <strong>Network</strong> Node Manager ®http://www.openview.hp.com/products/nnm/index.html Overview• Auto discovery <strong>and</strong> mapping• Drill-down views (Hierarchy Map)• Fault monitoring : ICMP / SNMP polling• Event monitoring : Trap receiving/Event configuration• SNMP tools : Status polling• MIB Browser• Web-based reports• Extended software is enhanced• Platform : Windows 2000/XP, Solaris 8/9, HP-UXAPAN-JP NOC monitors its network using OpenView mainly!<strong>Monitoring</strong> Software- HP OpenView Sample 1-OpenView ContractureEvent log<strong>Network</strong> mapICMP polling forconnectivity check<strong>Network</strong> sub-mapRouter map13
MRTG - Configuration 2 - Target Configuration•Target ExpressionTarget[]::@• : Identify equipment• : Measurement item• : SNMP community string• : Hostname or IP address of equipment•SNMP data collection specification method Basic / Port (ifindex)Target[myrouter]: 2:public@wellfleet-fddi.ethz.ch Explicit OIDs / MIB VariablesTarget[myrouter]: 1.3.6.1.2.1.2.2.1.14.1&1.3.6.1.2.1.2.2.1.20.1:public@myrouterTarget[myrouter]: ifInErrors.1&ifOutErrors.1:public@myrouterYou can use cfgmaker to generate references with the options-- ifref=? iref=ip: Interface by IP ifref=descrf: Interface by Description ifref=name: Interface by Name ifref=eth: Interface by Ethernet AddressMRTG - Configuration 3 -Example of ConfigurationTarget[la]: ifHCInOctets¥so-2/0/0&ifHCOutOctets¥so-2/0/0:xxxxxxx@tpr2.jp.apan.net:::::2MaxBytes[la]: 300000000Title[la]: Traffic Analysis of TransPAC LA LinkPageTop[la]: Traffic Analysis of TransPAC LA linkWithPeak[la]: ymwDirectory[la]: tpr2Options[la]: bits, growrightTarget[la-err]: ifInErrors¥so-2/0/0&ifOutErrors¥so-2/0/0:xxxxxxx@tpr2.jp.apan.netMaxBytes[la-err]: 300000000Title[la-err]: Packet Error for TransPAC LA linkPageTop[la-err]: Packet Error for TransPAC LA linkDirectory[la-err]: tpr2Options[la-err]: growright, integer, nopercentYLegend[la-err]: Number of Error PacketsShortLegend[la-err]: nLegend1[la-err]: Number of Error Packets for Incoming TrafficLegend2[la-err]: Number of Error Packets for Outgoing TrafficLegend3[la-err]: Peak of Number of Error Packets for Incoming TrafficLegend4[la-err]: Peak of Number of Error Packets for Outgoing TrafficLegendI[la-err]: In:LegendO[la-err]: Out:WithPeak[la-err]: w18
MRTG - Comments - Comments / Disadvantages• If you are to monitor a lot of devices (1000s), it is better tohave a fast disk• If using external monitoring scripts, a fast processor <strong>and</strong> alot of memory is necessary• Not particularly fast when compared to other data retrieval<strong>and</strong> storage schemes (Flat text files can slow downprocessing.)• MRTG can’t customize graphing periods• Flat text files are difficult to process when scripting againstthe data• Use 64bit counters with SNMPv2 for OC3-OC192 speedinterface, GbE if it is 115Mbps traffic can wrap 32bit countersaround in 5 minutes• MRTG can’t modify collected data which is summarized• Only two variables are available in processing a graphRRDtool (Round Robin <strong>Data</strong>base Tool)Overview• Successor to MRTG• Developed by the same developer of MRTG : Tobias Oetiker• Tool group for RRD can flexibly define data item, timeinterval, data amount, graph depiction, etc.• Binary file format that can store data at any interval for anylength of time File does not grow in size over time• Ability to make custom graphs across user-defined intervals Ability to graph multiple variables on a single graph• Additional scripts are necessary in creating graphs <strong>and</strong> webpage 25-30 percent faster than MRTG• Does not have the function to collect data• http://people.ee.ethz.ch/~oetiker/webtools/rrdtool/19
RRDtool-Architecture -Comparison of architecture between MRTG <strong>and</strong> RRDSNMPengineGraphillrouterFrontendProgramlogIndexrouterFrontendProgramGraphillserverIndextextRRDRRDtool - Basic Usage -Basic usage of RRD tools•Set up new Round Robin (RRD) Define RRD used as vessel of data Comm<strong>and</strong> : rrdtool create filename•Store new set of values into RRD periodically Write the data collected by frontend program in RRD Comm<strong>and</strong> : rrdtool update filename•Generate Graph Create graph from data stored in one or several RRDs Comm<strong>and</strong> : rrdtool graph filename (specify the graph name togenerate) datadatadata RRDGraph20
RRDtool-Practice -Example•Object Gigabit Ethernet Switch•Definition Definition of RRD recordIntervalNum of RRDfileStoragePeriodGraph1 minute3606 hours4 hours5 minutes5762 daysDaily2 hours60050 daysMonthly1 day7312 yearsYearly4 days91510 years10 years Ability to describe peak graph from data of 1-day to 10-yearsRRDtool-Create -Set up a new Round Robin <strong>Data</strong>base (RRD)Comm<strong>and</strong> Example/usr/local/rrdtool-1.0.46/bin/rrdtool create ¥/home/httpd/html/traffic/traffic_vlan.rrf ¥–step 60 ¥DS:vlan2in:counter60:0:125000000 ¥DS:vlan2out:counter60:0:125000000 ¥DS:vlan7in:counter60:0:125000000 ¥DS:vlan7out:counter60:0:125000000 ¥:RRA:AVERAGE:0.5:1:360 ¥RRA:AVERAGE:0.5:5:576 ¥RRA:AVERAGE:0.5:120:600 ¥RRA:AVERAGE:0.5:1440:731 ¥RRA:AVERAGE:0.5:5760:915 ¥RRA:MAX:0.2:5:576 ¥RRA:MAX:0.1:120:600 ¥RRA:MAX:0.1:440:731 ¥RRA:MAX:0.1:5760:915 ¥• DS : Define the data item COUNTER: continuous increasing counters 60 : if no new data is supplied for more than 60sec, it is considered as “unknown” 0 : minimum acceptable value (byte) 125000000 : maximum acceptable value (byte)• RRA (Round Robin Archive) :Define the data consolidations AVARAGE/MAX: average /maximum ofconsolidated of data 0.5 : consolidation interval is be made up from*UNKNOWN* data while the consolidated value isstill regarded as known.- Average 50%. MAX 20% or 10% 1: consolidated data point where the data thengoes into the archive 360 : how many generations of data values arekept in RRA21
RRDtool - Update -Stores a new set of values into RRD periodically• <strong>Data</strong> collection Collect the data from targets using frontend program• Original tool• Cricket - http://cricket.sourceforge.net/• Orca - http://www.orcaware.com/orca/• SNAPP - http://sourceforge.net/projects/snapp/• Updating an RRD Feed collected data into a RRD database using following comm<strong>and</strong>sComm<strong>and</strong> Examplerrdtool update/home/httpd/html/traffic/traffic_vlan.rrd ¥--template in:out N:11222:1The name of the RRD you want to update.DS1: DS2The data sources are defined in the RRD‘N’=Update time is set to be the current timeRRDtool - Graph 1 -Generating Graph -1-Comm<strong>and</strong> Examplerrdtool graph /home/httpd/html/traffic/traffic.png -s -4h –w 800 –h 800 –a PNG ¥–t “VLAN Traffic” –v “bit/s” ¥DEF:vlan2in_ave=/home/httpd/html/traffic/traffic_vlan.rrd:vlan2in:AVERAGE ¥DEF:vlan2out_ave=/home/httpd/html/traffic/traffic_vlan.rrd:vlan2out:AVERAGE ¥DEF:vlan7in_ave=/home/httpd/html/traffic/traffic_vlan.rrd:vlan7out:AVERAGE ¥DEF:vlan7in_ave=/home/httpd/html/traffic/traffic_vlan.rrd:vlan7out:AVERAGE ¥CDEF:vlan2in_ave_bit=vlan2in_ave,8 * ¥CDEF:vlan7in_ave_bit=vlan7in_ave,8 * ¥CDEF:vlan2out_ave_bit=vlan2out_ave,-8 * ¥CDEF:vlan7out_ave_bit=vlan7out_ave,-8 * ¥AREA:vlan2in_ave_bit#ff5e5e:VLAN2-in ¥STACK:vlan7in_ave_bit#5eff5e:VLAN7-in ¥AREA:vlan2out_ave_bit#aa0101:VLAN2-out ¥STACK:vlan7out_ave_bit#0101aa:VLAN7-out ¥Options-s: start time (default : seconds), -e: end seconds (default : seconds),-w,h : width <strong>and</strong> height pixels, -a : image format GIF|PNG, -t : Graph title,-v vertical-label text22
RRDtool - Graph 2 -Generating a Graph -2-•DEFDefine virtual name for data source• DEF:=::CFCF: consolidation functionselect AVARAGE, MAX, MIN, LAST ( Newest data)•CDEFCreate new virtual data source by evaluating mathematicalexpression• CDEF:=rpn-expression (Reverse Polish Notation)•Graph depiction parameter• :#:LINE : Plot for the request data, using the color specifiedAREA : Area between 0 line <strong>and</strong> the graph line will be filled with the color specifiedSTACK : Graph gets stacked on top of the previous LINE, AREA, or STACK graph•By updating graph generation periodically using “crontab”,you can see updated graphs on the WebRRDtool-Sample - Sample Graphhttp://mrtg.jp.apan.net/cricket/router-interfaces/23
Advanced Tools for Measuring<strong>Network</strong> PerformanceIperf - Overview -Iperf is used to measure TCP <strong>and</strong> UDP b<strong>and</strong>widthperformance•Tool to measure maximum TCP b<strong>and</strong>width, allowing thetuning of various parameters <strong>and</strong> UDP characteristics•Able to "memory to memory“ transfer to remove disk IOinfluencing the results•Client <strong>and</strong> server can have multiple simultaneousconnections•Supporting IPv6 , Platform : UNIX systems / Windows /Mac OS•Effective in investigating circuit quality, when a new circuitis established•http://dast.nlanr.net/Projects/Iperf/24
Iperf - Mode -TCP mode• Measure b<strong>and</strong>width• Reports MSS (Maximum Segment Size)/MTU (Maximum Transfer Unit)size <strong>and</strong> observed read sizes• Supports TCP window size via socket buffersUDP mode• Client can create UDP streams of specified b<strong>and</strong>width• Measure packet loss, delay, jitterSince traffic is generated actually, it must be careful tooperate Iperf!ClientServerIperf - Example - Test result Exampletest% iperf -u -i1 -s------------------------------------------------------------Server listening on UDP port 5001Receiving 1470 byte datagramsUDP buffer size: 1.00 MByte (default)------------------------------------------------------------[ 3] local 203.181.249.xxx port 5xxx connected with 203.181.248.xxport 32781[ ID] Interval Transfer B<strong>and</strong>width Jitter Lost/Total <strong>Data</strong>grams[ 4] 0.0- 1.0 sec 61.0 MBytes 511 Mbits/sec 0.006 ms 0/43492 (0%)[ 4] 1.0- 2.0 sec 61.0 MBytes 511 Mbits/sec 0.005 ms 0/43479 (0%)[ 4] 2.0- 3.0 sec 61.0 MBytes 511 Mbits/sec 0.005 ms 1/43478 (0.0023%)[ 4] 3.0- 4.0 sec 61.0 MBytes 511 Mbits/sec 0.007 ms -1/43478 (-0.0023%)[ 4] 4.0- 5.0 sec 61.0 MBytes 511 Mbits/sec 0.004 ms 0/43478 (0%) Traffic25
BWCTL (B<strong>and</strong>width Control)Users attempting to run b<strong>and</strong>width tests used to be notcertain whether or not their test was scheduled in a timeframe where other tests were not to run BWCTL is a resource allocation <strong>and</strong> scheduling daemon forarbitration of iperf tests BWCTL client application works by contacting a bwctld processon both endpoints of test systems Requires that NTP be running to synchronize the system clock Open mode : everyone can use Authentication mode : need to exchange AES key Support IPv6, Platform : UNIX systems Developed by Internet2 http://e2epi.internet2.edu/bwctl/OWAMP (One-way Active Measurement Protocol)Roundtrip-based measurement can not identify the delay ineach direction, especially when asymmetric routers are used OWAMP is a comm<strong>and</strong> line client application <strong>and</strong> a policy daemonused to determine one way latencies between hosts It is possible to collect active measurement data- e.g., one-way delay, packet loss, jitter NTP must be setup correctly on the system to calculate areasonable estimate of time error <strong>and</strong> to stabilize clock Support IPv6. Platform : UNIX systems Current Draft : draft-ietf-ippm-owdp-10.txt Developed by Internet2 http://e2epi.internet2.edu/owamp/icmp ping : RTTowping : one-way26
OWAMP - Protocol - Consists of two inter-related protocols•OWAMP-ControlUsed to initiate, start/stop test sessions, <strong>and</strong> fetch test results•OWAMP-TestDefine the format of probe packet Sample measurement datahttp://pe2.koganei.wide.ad.jp/cgi-bin/owd-stathttp://qpe.jp.apan.net/cgi-bin/owd-statNetflow - Overview -Overview•Enables IP traffic flow analysis without probes•Invented <strong>and</strong> patented by CiscoJuniper (called cflowd), Foundry, many venders are supporting•Flow cash data on routers is exportedto a flow tool, so that traffic flow is to be analyzedEnable NetFlowTrafficCore <strong>Network</strong>UDPNetFlowExportPacketsCollector(Solaris, HP-UX, or Linux)Application GUIflow Definition:•Source IP address•Destination IP address•Source port•Destination port•Layer 3 protocol type•TOS byte (DSCP)•Input logical interface(ifIndex)27
Netflow - Flow <strong>Data</strong> -Flow data export• Enable NetFlow on the routerThere is difference in architecture between Cisco <strong>and</strong> Juniper routersTake care! the load of a router does not become high!- Check CPU, memory, b<strong>and</strong>width, sampling rateFlow data collection & Analysis• Prepare the software for receiving flow-export dataflow-tools http://www.splintered.net/sw/flow-tools/cflowd http://www.caida.org/tools/measurement/cflowd/Cisco : NetflowCollector• Analyze traffic from raw data with softwareflow-scan http://net.doit.wisc.edu/~plonka/FlowScan/(If you want to graph-ize analysis data, I recommend you to use RRDtool)Cisco : CiscoWorks• Source <strong>and</strong> destination IP address• Source <strong>and</strong> destination TCP/UDP ports• Packet <strong>and</strong> byte counts• Routing information (next-hop address, source autonomous system (AS)number, destination AS number, source prefix mask, destination prefixmask)Netflow - Example -Netflow Example28
Observatory - Overview -Obsavatory Project• Abilene Observatory http://abilene.internet2.edu/observatory/ Abilene backbone http://abilene.internet2.edu/• APAN Observatory http://www.jp.apan.net/NOC/Observatory/ System which collects network performance data at backbone Collected data can be used for operation <strong>and</strong> research APAN is preparing three types data collected <strong>and</strong> shared publiclyacross JP-US link• Latency data --- using OWAMP• Netflow data --- using Netflow (Juniper, Procket & flow-tool)• Throughput data --- Iperf (BWCTL)Chicago/IndianapolisAPAN TokyoXPLos AngelesAverage RTT 190msObservatory – Formation -Observatory system will help grow up R&D networks!NOC Basic ServiceHelpful in operationSoftware,Papers, etc.NOC Advanced ServiceObservatory•Developed by NOC researchers &maintained by NOC engineers/operators•Common Tools with High Priority•Output data in st<strong>and</strong>ard format<strong>Data</strong> with authenticationResearchersResearchers can get measurementdata of the global networks <strong>and</strong>collaborate with foreignresearchers.29
Introduction of other advanced toolsAbilene Router Proxy - Overview - Similar to Looking Glass, but with some advanced functions Web-form allows users to submit various comm<strong>and</strong>s tobackbone routers Allows remote network operators to troubleshoot problemswithout contacting NOC Unix-based Uses scripted telnet to login to the routers <strong>and</strong> grab the output Not designed for high-speed access to backbone information Very useful operation tool among inter-domain network Enable us to view operational situation of almost all Abilenerouters http://ratt.uits.iu.edu/routerproxy/abilene/Introduction of other advanced toolsAbilene Router Proxy - Sample -30
Summary For summary, below is the table showing ranks of eachtool according to four core criteria( 1 : lowest – 5 : highest)OpenviewAccessible3Useful foroperation4Useful fortrouble-shoot5Low CostNagios 4 2 4 5MRTG 4 5 4 5RRD 3 4 5 52Iperf (BWCTL)3455OWANP2355NetFlow3454Router Proxy 4 5 5 5<strong>Data</strong> <strong>Center</strong> <strong>Operation</strong>31
<strong>Data</strong> <strong>Center</strong> operation- Service -1. Circuit service•Leased circuit, ATM/SONET/Ethernet/VPN2. Housing/co-location service•Rack co-location, open co-location•Security consideration Security camera, Security entry system3. Site Management service•Basic service Check entering/leaving, check the power supply & air condition,check equipment lamp, power off/on equipment•<strong>Monitoring</strong> service Ping monitoring, service port monitor, log-monitor, etc.•Report service Traffic graph report (MRTG), resource report, etc.•Alternate processing of routine work Tape change, stated equipment re-boot, etc•Assistance in trouble-shooting Technical support over telephone, detection of a trouble points, etc<strong>Data</strong> <strong>Center</strong> operation- Service 2 -4.Professional management & operation• Outsourcing of network operation• Business solution•Flexible operation to best meet user’s requirements <strong>and</strong>characteristics of user network Routing : IGP/EGP, Multicast, IPv6, etc. Cover almost all layers (Layer 1,2,3,4) Server maintenance : DNS, Web, Mail, etc. Negotiations with external network Management of network resource : IP address, VLAN, Rack space <strong>Monitoring</strong> Security <strong>Network</strong> consulting Face-to-face communication32
<strong>Data</strong> <strong>Center</strong> operationModelmonitoringnegotiation/cooperationthe InternetNOCKDDI <strong>Network</strong>InternalExternalsecurityresource managementrouting/traffic tuningExternal NOCIX / the InternetUser <strong>Network</strong><strong>Data</strong> <strong>Center</strong>power supplyentering/leavingProfessional management & operationAPAN & JGN2Location:•NOC is located at KDDI Otemachi Bldg 12F in Tokyo, withequipments installed on the 5F of the same bldg.Staff:•247 Operators st<strong>and</strong>byOperators are also in charged of operations for othernetworks Scientific, Academic, Commercial ISPDuties:•Opening <strong>and</strong> closing of Trouble Tickets•Receiving problem reports•Trouble-shooting•Development <strong>and</strong> maintenance of measurement <strong>and</strong> operationtools33
Professional management & operationAPAN JP Site NOCOpen ViewNNMAPANMail & WebClientAPANKDDIPhysicalLayer MonitorKDDI12F<strong>Operation</strong> StaffKDDICircuit DivisionAPAN Equipment5F• HP Open View works independently in the NOC segment• NOC staff is utilizing Mail & Web clients to detect alerts• Physical Layer Monitor system of KDDI observes circuits. When any alerts are detected,they are concurrently issued at KDDI Circuit Division.<strong>Network</strong> <strong>Operation</strong> in line with<strong>Network</strong> CharacteristicsCommercial ISP backbone•Stability <strong>and</strong> reliability are important above all Redundant configuration is indispensable for trouble avoidance <strong>and</strong> load distributionof equipment Although the network scale is large, network design is simple•<strong>Monitoring</strong> the connectivity of L2/L3 layer level mainly It is difficult to grasp the application level of each user’s flow But it is very important to check the trend of end-to-end communication•Substantial operation manual Since equipments are extensive, operation manual must be substantial inmanagement of equipment or network composition Since there are many operators, unified observance of an operation policy•<strong>Operation</strong> of hierarchical networks Each edge/access /backbone network has its own best-suited operational policy <strong>and</strong>system•Quick notice of trouble SLA (Service level agreements): Guarantee of the notice timee.g. within 30 minutes34
<strong>Network</strong> <strong>Operation</strong> in line with<strong>Network</strong> CharacteristicsR&D <strong>Network</strong>s 1•<strong>Network</strong> performance <strong>and</strong> high-speed b<strong>and</strong>width are required Must support high-speed application where one user uses several 10Mbps ~ 10Gbpsthroughput Flexibly provide high performance network for every experiment ordemonstration•Allocation of network resources based on operators view Coordinate so that high-speed demonstration may not be performed simultaneously•Maintenance for physical <strong>and</strong> logical configuration change isperformed frequently In response to user dem<strong>and</strong>, we have to change configurationbecause scale of equipment is limited•<strong>Network</strong> operation range is wide Managing not only backbone but also near-the-end host is required<strong>Network</strong> <strong>Operation</strong> in line with<strong>Network</strong> CharacteristicsR&D <strong>Network</strong>s 2•Test bed operation of advanced technology <strong>and</strong> new equipment We actually provided vendors with some problem reports of Juniper & Procket router New operation <strong>and</strong> trouble-shooting method is always searched for•Disclose operation information as much as possible Researcher <strong>and</strong> other NOC operator can check network operation situation Collected operation data activate network research•Troubles causing long outage time are noticeable There are only few environment where equipments are installed in a housing sitewith operation by 24/7 NOC (especially in <strong>Asia</strong>)35
Proposal for Improving <strong>Network</strong>Service Level Shortening of trouble-h<strong>and</strong>ling time•Start trouble-h<strong>and</strong>ling <strong>and</strong> announce the information quickly<strong>Operation</strong> tools enable us to issue trouble tickets automatically <strong>and</strong> announceinformation quickly•Shorten trouble-shooting timeRemote trouble-shooting from other areas( cf. Router Proxy on Abilene) World Wide Information sharing•Installation of shared information server providing the followinginformationPerformance <strong>and</strong> <strong>Operation</strong> status of networkTrouble <strong>and</strong> Maintenance information Redundant <strong>Network</strong> configuration•Redundant configuration is very effective in realizing highavailability. It is desirable that we establish redundantconfiguration as much as possible.Proposal for Improving <strong>Network</strong>Service Level <strong>Operation</strong> of lower layers•For operation, it is very important to check the status of circuitsin cooperation with circuit carriers•As a recent trend, backbone network based on L2 or Lambda isconspicuousLayer2• Difficulty in finding bottle-necks• Apply L3 monitoring technologye.g. ICMP ping, traceroute, other measurement tool• VLAN ID management from end-to-endLambda• Operators can’t monitor <strong>and</strong> measure performance of circuit/link• Burden for operation on end router/user36
Discussion & QuestionToday’s Assignment1. Describe monitoring method which is suitable to monitorthe following issues as concretely as possible.1-1. Connectivity to a PC in internal-network1-2. WWW service on web server1-3. Detecting down/up of interface on Ethernet switch promptly1-4. Traffic of GbE interface on a router1-5. Checking the utilization rate for P2P application in whole traffic2. Describe merit of housing equipments in a data centerfollowing three categories.2-1. <strong>Network</strong> Connectivity2-2. Environment2-3. <strong>Operation</strong>3. Give 1-2 lines of feedback37