Global Offshore Prospects - Douglas-Westwood
Global Offshore Prospects - Douglas-Westwood
Global Offshore Prospects - Douglas-Westwood
- No tags were found...

You also want an ePaper? Increase the reach of your titles
YUMPU automatically turns print PDFs into web optimized ePapers that Google loves.
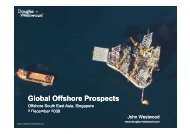
<strong>Global</strong> <strong>Offshore</strong> <strong>Prospects</strong>Steven KopitsManaging Director, <strong>Douglas</strong>-<strong>Westwood</strong>Houston, TexasDecember 3, 20091
www.dw‐1.comOur BusinessHistory and Office Locations• Established 1990• Aberdeen, New York & CanterburyActivities & Service Linesoffshore• Market research & analysis• Commercial due‐diligence• Business strategy & advisory• Published market studiespowerIndustry Sector Coverage• Oil & Gas• Renewablesonshore• PowerLarge, Diversified Client Base• 600 projects, 400 clients, 50 countries• Leading global corporatesLNG• Energy majors and their suppliersdownstream• Investment banks & PE firms• Government agenciesrenewables2
TurmoilMacro Factors<strong>Offshore</strong> Oil & GasConclusions4
A Financial Crisis?2000’s:• China – drives a commodities boom• Oil producers major beneficiaries• Money re-cycled through London & New York markets• Fuels the housing & consumer credit boom• And the derivatives market• And oil pricesAug ’08:Oil priceshit $147and breaksdemand.And BanksSept ’08:LehmanBrothersliquidationMay‘09:TherecoverybeginsApril ’09:US houseprices down29%5
Were oil prices partly responsible for this recession?• ‘the current US recession began within two months of oil hitting the4% GDP threshold, that is, when oil reached $80 / barrel.’Source: <strong>Douglas</strong>-<strong>Westwood</strong> research note May ‘096
TurmoilMacro Factors<strong>Offshore</strong> Oil & GasConclusions7
<strong>Offshore</strong> market drivers – CO 2 reduction• CO 2 emissions soared aftersigning of Kyoto protocol• US improved in line with UK,Germany• Increases driven by emergingeconomies, primarily China30282624Kyoto Protocol• US consumes 5x more energyper capita; China has 4x the22population20• What might happen as suchdeveloping economies grow?• Will CO 2 regulations drive fueldemand growth? Or willeconomic development?18161980198219841986198819901992199419961998200020022004CO 2 Emissions from Fossil Fuels – mt billionsSource: EIA20068
Market Drivers – Demand GrowthChina reachesUS in 2018China doublesUS in 2025• China is central in the demand growth story• China's economy to grow 8%-9% in 2009• 2009 car sales to increase 35% from 2008• Meeting Chinese demand will be the centralmission of energy producers in the coming years‘Were China tofollow Korea’s pathof development - asit largely has to date– its oil demandwould more thandouble in the nextdecade. By 2030,Chineseconsumption couldexceed 50 mbpd’source: <strong>Douglas</strong>-<strong>Westwood</strong>analysis using EIA, IMF, andUS Census Bureau data9
Advanced Economies Reduce Oil Consumptionsources: UN, BP, Wikipedia$70 oil$75 oil• Oil supply has been unable to keep up with demand• Prices have increased as emerging markets bid for existing supplies• As prices go up, OECD countries—US, EU, Japan—are squeezed outof the market at $70-$75 $75 per barrel crude; US demand down 9%• Will supply improve in the future?10
They got it wrong before – will they again?March 1999 April 2009 The Future?11
<strong>Global</strong> oil supplies under pressure120100
Have 8 out of 10 oil majors have passed peak production?2002 2003 2004 2005 2006 2007 2008ExxonMobil 2496 2516 2571 2523 2681 2616 2404BP 2018 2121 2531 2562 2475 2414 2410PetroChina 2109 2119 2233 2270 2276 2312 2379Shell 2359 2379 2253 2093 2030 1899 1771Petrobras 1533 1701 1661 1847 1908 1920 1996Chevron 1897 1823 1737 1701 1759 1783 1676Total 1589 1661 1695 1621 1506 1509 1456ConocoPhillips 891 1237 1242 1447 1698 1644 1367ENI 921 981 1034 1111 1079 1020 1026StatoilHydro 1112 1132 1135 1102 1058 1054 1056Data: Petroleum Review, May 2009Peak Year• Peak oil is a reality, not just for the majority of the producing countriesbut perhaps for the majority of the top producers.• State oil companies now control 80% of the world’s remaining reserves• Deepwater is one of the few remaining places where the oil majors canincrease production13
Natural gasscubic metretrillion5432<strong>Offshore</strong> Deep<strong>Offshore</strong> ShallowOnshore3.02.52.01.5Btu ratio Oil‐to‐GasAvg. ratio Oct. 2009 ‐ 2015Avg. ratio 1998 ‐ 200511.000.519301934193819421946195019541958196219661970197419781982198619901994199820022006201020142018The Growing Importance of <strong>Offshore</strong> GasSource: Energyfiles199819992000200120022003200420052006200720082009201020112012201320142015Oil-to-Gas Price Ratio on a BTU Parity BasisSource: EIA• Strong long-term demand growth – a ‘clean’ fuel for power generation• Decommissioning / difficulty in permitting of coal power stations means that toplug the gap another ‘dash for gas’ likely—UK in particular• Major investments underway e.g. LNG, gas shales• Renaissance of natural gas in the US• Prospective ratio of oil to gas prices suggests natural gas as vehicle fuel14
TurmoilMacro Factors<strong>Offshore</strong> Oil & GasConclusions15
2009 – total global E&P spend 10% down?Source: DnB NOR,• <strong>Global</strong> E&P expenditure expected to fall by 15%, from $454 bn in2008 to $387 bn in 2009• Small & marginal projects have been hit• Mainly onshore? And activity that relies on the credit market• The bigger offshore projects & opex less affected• Spending recovery in 201016
Different sectorsNumber of Rigs605040302010Total RigsRigs Under ContractAverage Dayrate$450,000$400,000$350,000$300,000$250,000$200,000$150,000$100,000$50,000• Jackup market – continuedweakness expected. 63 rigs onorder.• High-spec deepwater sectorrobust. 38 drillships on order, 41semi-subs.subs.• Land drilling recovery underwayNumb ber of Rigs0$0Nov-02 Nov-03 Nov-04 Nov-05 Nov-06 Nov-07 Nov-08 Nov-09North American Rig Count: On to 2400?2000Drillships500 Total Rigs$160,000Rigs Under Contract450Average Dayrate$140,0000001500400$120,0003501000300$100,000250$80,000000500200$60,000150100$40,000050$20,000199 97199 98+212%+190%‐45%‐57%199 99200 00200 01200 02200 03200 04200 05200 06200 07200 08+30%‐58%200 090$0Nov-02 Nov-03 Nov-04 Nov-05 Nov-06 Nov-07 Nov-08 Nov-09JackupsSources: Baker-Hughes; RigLogix 1 Dec 200917
<strong>Offshore</strong> oil & gas production & spend to grow• Capex to dip by 3% from$157bn to $152bn in 2009Opex ($billion ns)Capex &• But total spend to grow from$260 bn (2008) to $360 bn(2013)400350300250200150100500AfricaAsiaAustralasiaEastern Europe & FSULatin AmericaMiddle EastNorth AmericaWestern Europe2004 2005 2006 2007 2008 2009 2010 2011 2012 2013<strong>Global</strong> <strong>Offshore</strong> Expenditure by Region 2004-2013Source: Energyfiles / <strong>Douglas</strong>-<strong>Westwood</strong>• Most regions to see growth• W Europe to decline• Strong underlying Opex growth as afunction of both increased volume ofactivity it and complexity• Deepwater production growing strongly18
The Growing Importance of Deepwater($billions)Expenditure$35 AfricaAsia$30 AustralasiaLatin America$25 OthersNorth America$20 Western Europe$15$10$5Millions of Ba arrels a Day12108642$02004 2005 2006 2007 2008 2009 2010 2011 2012 2013Deepwater ExpenditureSource: <strong>Douglas</strong>-<strong>Westwood</strong>02000 2002 2004 2006 2008 2010 2012 2014Deepwater Production• The world will increasingly gyrely on offshore and deepwater• Deepwater oil production 2% in 2002, 8% in 2009, 12% by 2015• Development of complementary technology – e.g. subsea processing• Gas developments – ‘subsea-to-shore’ developments19
<strong>Offshore</strong> drilling – Deepwater to show strongest growthSource: “ World <strong>Offshore</strong> Drilling Spend Forecast 2009-2013”EnergyFiles & <strong>Douglas</strong>-<strong>Westwood</strong>• Deepwater fundamentals remain solid• Past surge in expenditure driven by escalating oil prices / rig shortages• Spend to reach $89 bn in 2013 (+57%)• And still more to come: e.g. Brazil pre-salt20
Petrobras Continues to Dominate the Market• Petrobras’ spending plan of $174.4 billion during 2009-2013approved.• Massive pre-salt finds in Santos basin. 9-14 billion boe recoverablereserves announced for Tupi, Lara, Guará alone. Pilot productionsystems moving ahead for Tupi• Tupi EWT began May 2009. Pre-salt production to reach 157,000bpd 2013, 422,000 bpd 2015 and 1.2 million bpd 2020.• Petrobras plan 10 FPSOs for Phase 1A (2013-2017) 2017) pre-saltdevelopments. 8 to be identical units (hulls Brazilian-built)originally.• What to do with the gas?? BG estimate over 40 Tcf recoverablefrom just three fields! Petrobras could become a leader in FLNGand/or FGTL.21
Long-term growth in floating production systems141210AfricaAustralasiaLatin AmericaNorth AmericaOrder YearAsiaE. Europe & FSUMiddle EastWestern Europe$ billion864202004 2005 2006 2007 2008 2009 2010 2011 2012 2013<strong>Global</strong> Floating Production Expenditure 2004-2013Source: <strong>Douglas</strong>-<strong>Westwood</strong>• Material decrease in orders in 2009 expected• Impact of project delays – $14 billion of projects slipped• <strong>Global</strong> FPS market to be worth $50 billion over 2009-2013 period• Increasing share of market to leased FPSOs. Consolidation likely• Presently too many builds, too few opportunities• Long term >200 prospects exist and growth will recover22
Liquefa action Capacity (mm mtpa)350300250200150100AfricaAsiaAustralasiaContinuing growth in LNG capacityEastern Europe and FSULatin AmericaMiddle EastNorth AmericaWestern Europe5002005 2006 2007 2008 2009 2010 2011 2012 2013 2014• Large expansions to Qatargas and Rasgas plants to come onstream in2009/2010. A total 48.6 mmtpa of new capacity to the market• 20 additional liquefaction trains forecast, plus 13 new export terminals• 49 new LNG import terminals and a number of expansions to expected tobe completed in the next five years• FLNG spend beginning• $74 billion spend 2009-201423
Recession and impact on LNG demandLNG Imports (mmtpa)2008 2009 2012 2015Japan 69.24 60-61 67-70 71-74South Korea 27.26 23-24 30 33Taiwan 9.08 8 10 12China 3.34 5 10-12 20-22India 8.59 8 10 12Total 117.51 104-106 127-132 148-153Source: LNG Journal• Recession has dampened demand for LNG, particularly among themajor importing countries in the Pacific basin.• However, long-term outlook for demand for LNG remains strong.• Leading importers are expected to take about two years to recover to2008 levels.24
O&M – a massive aging offshore infrastructure• >7,000 fixed platforms, >200$80 LogisticsfloatingPlatform Drilling Services$70Subsea IRMSupport Services• 185,000 km subsea pipelinesAsset Services$60Production Services• 3,600 subsea wells operating$50$40• 690 offshore drilling rigs$30• Increasing costs and energy$20intensity per barrel$10• Demand for major$0modification work increasing p ySource: <strong>Douglas</strong>‐<strong>Westwood</strong>• Future N. Seadecommissioning$billions2005 2006 2007 2008 2009 2010 2011 2012 2013 2014<strong>Global</strong> <strong>Offshore</strong> O&M Expenditure by Market• <strong>Offshore</strong> O&M - $53 billion spend in 2009 and growing rapidly.• Over $330 billion worth of expenditure expected over the nextfive years.2525
TurmoilMacro Factors<strong>Offshore</strong> Oil & GasConclusions26
The Post-Recession World• Technology-driven• IOC’s will be under increasing pressure for new discoveries andexpanded production—mostly from deepwater offshore• But recession has ended ‘price is no object’ environment• OECD countries are unlikely to sustain oil prices much above $80• Threat of recurring recession, sluggish growth, possiblystagflation• China and other emerging economies will tend to bid awayincremental oil production• Cost will be an important driver• If we find the oil, can we afford to bring it up?• Oil supply will be insufficient• Natural gas has to take up some of the load• Both technological innovation and cost will be critical drivers in theyears ahead• Challenging times ahead, but the global economy will absorb allvolumes that can be produced at affordable pricesDeepwater...at a price.27
Big challenges, big opportunitiesThank youThis presentation can be downloaded from www.douglas-westwood.com28