World Subsea Vessel Operations Market Forecast - Douglas ...
World Subsea Vessel Operations Market Forecast - Douglas ...
World Subsea Vessel Operations Market Forecast - Douglas ...
You also want an ePaper? Increase the reach of your titles
YUMPU automatically turns print PDFs into web optimized ePapers that Google loves.
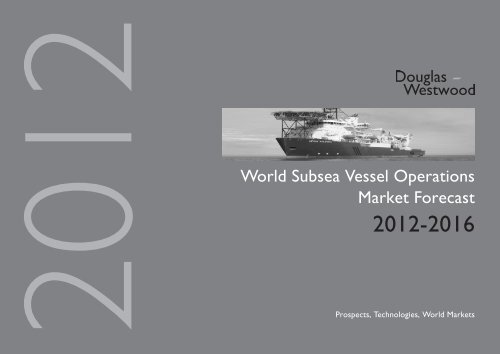
2012<strong>World</strong> <strong>Subsea</strong> <strong>Vessel</strong> <strong>Operations</strong><strong>Market</strong> <strong>Forecast</strong>2012-2016Prospects, Technologies, <strong>World</strong> <strong>Market</strong>s
ContentsTable of Contents1 Executive Summary & Conclusions........................7Summary.......................................................................................................................................... 8Conclusions..................................................................................................................................... 92 Macro Economic Overview.................................. 10Global Energy Supply & Demand..............................................................................................11The Move to Offshore................................................................................................................12Role of Deepwater......................................................................................................................13Oil Price – Drivers and Forward Assumptions ....................................................................14Gas Price – Drivers and Forward Assumptions ..................................................................15E&P Expenditure ........................................................................................................................163 Definitions & Terminology..................................... 17Production.....................................................................................................................................18<strong>Vessel</strong>s............................................................................................................................................19<strong>Vessel</strong> Definitions.........................................................................................................................20<strong>Vessel</strong> Activity by Type...............................................................................................................224 The <strong>Vessel</strong> Fleet....................................................... 23Global <strong>Vessel</strong> Supply....................................................................................................................24DSVs – Supply Side <strong>Market</strong> Trends..........................................................................................25ROVSVs – Supply Side <strong>Market</strong> Trends.....................................................................................27FLEXLAYs – Supply Side <strong>Market</strong> Trends.................................................................................29PIPELAYs – Supply Side <strong>Market</strong> Trends...................................................................................31LWIVs – Supply Side <strong>Market</strong> Trends........................................................................................335 The <strong>World</strong> <strong>Subsea</strong> <strong>Vessel</strong> <strong>Operations</strong><strong>Market</strong> <strong>Forecast</strong>.......................................................... 35Model Summary...........................................................................................................................36Global <strong>Market</strong> – by Region........................................................................................................37Global <strong>Market</strong> – by Sector.........................................................................................................38Africa – <strong>Market</strong> Overview & Drivers......................................................................................39Africa – Expenditure & <strong>Vessel</strong> Day Demand..........................................................................40Asia – <strong>Market</strong> Overview & Drivers ........................................................................................41Asia – Expenditure & <strong>Vessel</strong> Day Demand ............................................................................42Australasia – <strong>Market</strong> Overview & Drivers ............................................................................43Australasia – Expenditure & <strong>Vessel</strong> Day Demand ................................................................44Eastern Europe & FSU – <strong>Market</strong> Overview & Drivers ........................................................45Eastern Europe & FSU – Expenditure & <strong>Vessel</strong> Day Demand ...........................................46Latin America – <strong>Market</strong> Overview & Drivers .......................................................................47Latin America – Expenditure & <strong>Vessel</strong> Day Demand ..........................................................48Middle East – <strong>Market</strong> Overview & Drivers ...........................................................................49Middle East – Expenditure & <strong>Vessel</strong> Day Demand .............................................................50North America – <strong>Market</strong> Overview & Drivers ....................................................................51North America – Expenditure & <strong>Vessel</strong> Day Demand ........................................................52Norway – <strong>Market</strong> Overview & Drivers .................................................................................53Norway – Expenditure & <strong>Vessel</strong> Day Demand .....................................................................54UK – <strong>Market</strong> Overview & Drivers ..........................................................................................55UK – Expenditure & <strong>Vessel</strong> Day Demand .............................................................................56RoWE – <strong>Market</strong> Overview & Drivers ....................................................................................57RoWE – Expenditure & <strong>Vessel</strong> Day Demand ........................................................................586 Appendix................................................................... 59Data and Text Conventions.......................................................................................................60© 2012 <strong>Douglas</strong>-Westwood <strong>World</strong> <strong>Subsea</strong> <strong>Vessel</strong> <strong>Operations</strong> <strong>Market</strong> <strong>Forecast</strong> 2012-20162
ContentsTable of FiguresFigure 1: Global Expenditure by Region..............................................................................................................8Figure 2: Consumption by Region ......................................................................................................................11Figure 3: Global Oil Supply mix – Onshore/Offshore Split 1930-2025........................................... 12Figure 4: Oil Production – Shallow/Deep Split 1965-2025....................................................................13Figure 5: Gas Production – Shallow/Deep Split 1965-2025...................................................................13Figure 6: Global Oil Price 2003-2017 (EIA, <strong>Douglas</strong>-Westwood)......................................................14Figure 7: Global Gas Price 2003-2017 (EIA, <strong>Douglas</strong>-Westwood).....................................................15Figure 8: Global E&P Expenditure (Barclays Capital)................................................................................16Figure 9: Historic <strong>Vessel</strong> Deliveries by Type 1965-2012...........................................................................24Figure 10: DSV Total <strong>Vessel</strong> Supply 1975-2012............................................................................................25Figure 11: DSV Dayrate Range (US $ 000’s) 2007-2016........................................................................25Figure 12: ROVSV Total <strong>Vessel</strong> Supply 1975-2012......................................................................................27Figure 13: ROVSV Dayrate Range 2007-2016..............................................................................................27Figure 14: FLEXLAY Total <strong>Vessel</strong> Supply 1975-2012..................................................................................29Figure 15: FLEXLAY Dayrate Range 2007-2016...........................................................................................29Figure 16: PIPELAY Total <strong>Vessel</strong> Supply 1975-2012....................................................................................31Figure 17: PIPELAY Dayrate Range 2007-2016.............................................................................................31Figure 18: PIPELAY Total <strong>Vessel</strong> Supply 1975-2012....................................................................................33Figure 19: PIPELAY Dayrate Range 2007-2016.............................................................................................33Figure 20: Global <strong>Vessel</strong> <strong>Operations</strong> Expenditure by Region................................................................37Figure 21: Global <strong>Vessel</strong> <strong>Operations</strong> Expenditure by <strong>Market</strong>................................................................38Figure 22: Global Expenditure by <strong>Market</strong> .......................................................................................................38Figure 23: Africa – <strong>Subsea</strong> Tree Installations by Water Depth..............................................................39Figure 24: Africa – Expenditure by <strong>Market</strong> and <strong>Vessel</strong> Day Demand ..............................................40Figure 25: Asia – <strong>Subsea</strong> Tree Installations by Water Depth & Wellstock......................................41Figure 26: Asia – Expenditure by <strong>Market</strong> and <strong>Vessel</strong> Day Demand .................................................42Figure 27: Australasia – <strong>Subsea</strong> Tree Installations by Water Depth & Wellstock........................ 43Figure 28: Australasia – Expenditure by <strong>Market</strong> and <strong>Vessel</strong> Day Demand ................................... 44Figure 29: EE & FSU – <strong>Subsea</strong> Tree Installations by Water Depth & Wellstock.......................... 45Figure 30: EE & FSU – Expenditure by <strong>Market</strong> and <strong>Vessel</strong> Day Demand ...................................... 46Figure 31: Latin America – <strong>Subsea</strong> Tree Installations by Water Depth & Wellstock................. 47Figure 32: Latin America – Expenditure by <strong>Market</strong> and <strong>Vessel</strong> Day Demand ............................. 48Figure 33: Middle East – <strong>Subsea</strong> Tree Installations by Water Depth & Wellstock...................... 49Figure 34: Middle East – Expenditure by <strong>Market</strong> and <strong>Vessel</strong> Day Demand .................................. 50Figure 35: North America – <strong>Subsea</strong> Tree Installations by Water Depth & Wellstock.............. 51Figure 36: North America – Expenditure by <strong>Market</strong> and <strong>Vessel</strong> Day Demand .......................... 52Figure 37: Norway – <strong>Subsea</strong> Tree Installations by Water Depth & Wellstock............................. 53Figure 38: Norway – Expenditure by <strong>Market</strong> and <strong>Vessel</strong> Day Demand ......................................... 54Figure 39: UK – <strong>Subsea</strong> Tree Installations by Water Depth & Wellstock........................................55Figure 40: UK – Expenditure by <strong>Market</strong> and <strong>Vessel</strong> Day Demand ....................................................56Figure 41: RoWE – <strong>Subsea</strong> Tree Installations by Water Depth & Wellstock................................ 57Figure 42: RoWE – Expenditure by <strong>Market</strong> and <strong>Vessel</strong> Day Demand ............................................ 58© 2012 <strong>Douglas</strong>-Westwood <strong>World</strong> <strong>Subsea</strong> <strong>Vessel</strong> <strong>Operations</strong> <strong>Market</strong> <strong>Forecast</strong> 2012-20163
ContentsTable of TablesTable 1: Annual Crude Oil Production by Company – mmbbl/d .....................................................16Table 2: <strong>Vessel</strong> Type Definitions............................................................................................................................20Table 3: LWIV <strong>Vessel</strong> Type Definitions...............................................................................................................21Table 4: <strong>Vessel</strong> Activity by <strong>Vessel</strong> Type..............................................................................................................22Table 5: Global <strong>Vessel</strong> Expenditure by Region .............................................................................................37Table 6: Global Expenditure by <strong>Market</strong> ...........................................................................................................38Table 7: Africa – Key Infrastructure.....................................................................................................................39Table 8: Africa – Expenditure & <strong>Vessel</strong> Day Demand by <strong>Market</strong>........................................................40Table 9: Asia – Key Infrastructure.........................................................................................................................41Table 10: Asia – Expenditure & <strong>Vessel</strong> Day Demand by <strong>Market</strong>.........................................................42Table 11: Australasia – Key Infrastructure........................................................................................................43Table 12: Australasia – Expenditure & <strong>Vessel</strong> Day Demand by <strong>Market</strong>...........................................44Table 13: Eastern Europe & FSU – Key Infrastructure...............................................................................45Table 14: EE & FSU – Expenditure & <strong>Vessel</strong> Day Demand by <strong>Market</strong>.............................................. 46Table 15: Latin America – Key Infrastructure.................................................................................................47Table 16: Latin America – Expenditure & <strong>Vessel</strong> Day Demand by <strong>Market</strong>.................................... 48Table 17: Middle East – Key Infrastructure.......................................................................................................49Table 18: Middle East – Expenditure & <strong>Vessel</strong> Day Demand by <strong>Market</strong>......................................... 50Table 19: North America – Key Infrastructure..............................................................................................51Table 20: North America – Expenditure & <strong>Vessel</strong> Day Demand by <strong>Market</strong>................................. 52Table 21: Norway – Key Infrastructure..............................................................................................................53Table 22: Norway – Expenditure & <strong>Vessel</strong> Day Demand by <strong>Market</strong>.................................................54Table 23: UK – Key Infrastructure.........................................................................................................................55Table 24: UK – Expenditure & <strong>Vessel</strong> Day Demand by <strong>Market</strong>........................................................... 56Table 25: RoWE – Key Infrastructure.................................................................................................................57Table 26: RoWE – Expenditure & <strong>Vessel</strong> Day Demand by <strong>Market</strong>....................................................58© 2012 <strong>Douglas</strong>-Westwood <strong>World</strong> <strong>Subsea</strong> <strong>Vessel</strong> <strong>Operations</strong> <strong>Market</strong> <strong>Forecast</strong> 2012-20164
Notes & AcknowledgementsAbout Us<strong>Douglas</strong>-Westwood is an independentcompany that carries out business researchfor the international energy industries. Itsmarket analysis, surveys and forecasts areused by many of the world’s major energycompanies, the leading industry contractorsand manufacturing companies, financialinstitutions and government departments. Intotal, DW has clients in more than 70 countriesand to date over 750 projects havebeen completed in oil & gas, renewableenergy, conventional and nuclear powergeneration.DisclaimerThis report is a <strong>Douglas</strong>-Westwood study andall rights are reserved, whether this pertainsto the body of the report or any informationcontained within. The information containedin this document is believed to be accurate,but no representation or warranty, express orimplied, is made by <strong>Douglas</strong>-Westwood Ltdas to the completeness, accuracy or fairnessof any information contained in it, and we donot accept any responsibility in relation to suchinformation whether fact, opinion or conclusionthat the reader may draw. The viewsProduction TeamSeries Editor John Westwoodjw@douglaswestwood.comReport Editor Thom Paynetp@douglaswestwood.comReport Author Joseph Corriganjc@douglaswestwood.com<strong>World</strong> <strong>Subsea</strong> <strong>Vessel</strong> <strong>Operations</strong><strong>Market</strong> <strong>Forecast</strong> is published by:<strong>Douglas</strong>-Westwood Limited,St Andrew’s House,Station Road East,CanterburyCT1 2WD, UKtel: +44 1227 780999fax: +44 1227 780880admin@douglaswestwood.comexpressed are those of the individual authorsand do not necessarily represent those of thepublisher.While we have made every attempt to ensure© Copyright <strong>Douglas</strong>-WestwoodLimited 2012the information contained in this documenthas been obtained from reliable sources,<strong>Douglas</strong>-Westwood Ltd is not responsible forany errors or omissions, or for the results obtainedfrom the use of this information. All informationin this document is provided “as is”,with no guarantee of completeness, accuracy,timeliness or of the results obtained from theuse of this information, and without warrantyof any kind, express or implied, including, butnot limited to warranties of performance, mer-By purchasing this document, yourorganisation agrees that it will notcopy or allow to be copied in part orwhole or otherwise circulated in anyform any of the contents without thewritten permission of the publishers.Additional copies of this study may bepurchased at a specially discountedrate.chantability and fitness for a particular purpose.Nothing herein shall to any extent substitutefor the independent investigations and theDW report number 522-12sound technical and business judgment of thereader. Laws and regulations are continuallyISBN 9781-905-183-84-5changing, and can be interpreted only in lightof particular factual situations.© 2012 <strong>Douglas</strong>-Westwood <strong>World</strong> <strong>Subsea</strong> <strong>Vessel</strong> <strong>Operations</strong> <strong>Market</strong> <strong>Forecast</strong> 2012-20165
Notes and Acknowledgements<strong>Douglas</strong>-Westwood’s OfferingsAdvisoryTransactionsResearchPublicationsPublished <strong>Market</strong> ReportsOver 800 advisory studies completed for clientsin more than 70 countriesWith an extensive advisory team in offices overthree continents, DW delivers consultancyservices worldwide. Working in partnership withour clients worldwide, DW advisory is focussedon the strategic planning process, helping ourclients to make investment decisions. We developand test advanced competitive strategies fornew products, new business streams, mergersand acquisitions delivering consultancy servicesthrough advanced market insight, modelling andsimulation to a client base which includes E&P,oilfield services and public sector.Commercial Due-Diligence for deals from $10million to $1 billionDW staff build on our sector knowledge to offercommercial due diligence services to buyersand sellers of energy services sector companies.We are the leading provider of commercial andmarket due diligence on the oilfield equipment &services sector and also provided services to playersin upstream and downstream oil & gas, powerand renewables; providing services worldwide onrefinancing, M&A deals and IPOs ranging from $10million to $1 billion in value..Global Real-time <strong>Market</strong> MonitoringBusiness research, analysis and modelling remainour core activity. Over the years DW Analystshave built a best in class information storagecapability, with databases recording transactionsand activity across a number of energy sectors.A dedicated research department now monitoractivity in core-markets worldwide, allowing DWto be confident that our information always reflectsthe up to the minute nature of the markets.Our experience of researching and recordingactivity in the oilfield equipment & services (OFS)sector remains unequalled, with DW also holdingacknowledged expertise in emerging markets andtechnologies such as offshore windpower, wave &Industry acclaimed energy business market studiesand forecastsThe publications divisions of DW are the producerof industry acclaimed energy business marketstudies and forecasts. Designed to be of optimumpractical value, DW reports are designed for theneeds of our technically knowledgeable clientbase, leveraging DW’s acknowledged strengths inoffshore, subsea and supply markets. With manyof our leading reports now in multiple editions,DW publications have become indispensable toour readers, helping them to feel confident thatthey have all the necessary information to makecomplex investment decisions. Each <strong>Douglas</strong>-Westwood report includes a full market review;unmatched information on supply and demandOil & GasNorth Sea Offshore DecommissioningOffshore Produced Water GamechangerOnshore Produced Water Gamechanger<strong>World</strong> AUV <strong>Market</strong> <strong>Forecast</strong><strong>World</strong> Deepwater <strong>Market</strong> <strong>Forecast</strong><strong>World</strong> <strong>Subsea</strong> Hardware <strong>Market</strong> <strong>Forecast</strong><strong>World</strong> <strong>Subsea</strong> <strong>Vessel</strong> <strong>Operations</strong><strong>Market</strong> <strong>Forecast</strong><strong>World</strong> Floating Production <strong>Market</strong> <strong>Forecast</strong><strong>World</strong> ROV <strong>Market</strong> <strong>Forecast</strong><strong>World</strong> Offshore <strong>Operations</strong> &Maintenance <strong>Market</strong> <strong>Forecast</strong>Russian Onshore Oilfield ServicesMiddle East & N.Africa Oilfield Services<strong>World</strong> Onshore Produced Water<strong>World</strong> Land Drilling Rig <strong>Market</strong> <strong>Forecast</strong>tidal, difficult-to-access markets and geographiessuch as Russia and the Middle East. DW marketresearch is made available to clients through ourpublications and client commissioned studies.and pricing, and culminates in a five-year forecastby region and industry sub-sector.EnergyUK Power Generation <strong>Forecast</strong><strong>World</strong> Onshore Pipelines <strong>Market</strong> <strong>Forecast</strong><strong>World</strong> FLNG <strong>Market</strong> <strong>Forecast</strong><strong>World</strong> LNG <strong>Market</strong> <strong>Forecast</strong>Unconventional Gas: Drilling & ProductionRenewables<strong>World</strong> Wave & Tidal <strong>Market</strong> <strong>Forecast</strong><strong>World</strong> Offshore Wind <strong>Market</strong> <strong>Forecast</strong>A full list of DW reports is available here;www.douglas-westwood.com/publications© 2012 <strong>Douglas</strong>-Westwood <strong>World</strong> <strong>Subsea</strong> <strong>Vessel</strong> <strong>Operations</strong> <strong>Market</strong> <strong>Forecast</strong> 2012-20166
6 Appendix© 2012 <strong>Douglas</strong>-Westwood <strong>World</strong> <strong>Subsea</strong> <strong>Vessel</strong> <strong>Operations</strong> <strong>Market</strong> <strong>Forecast</strong> 2012-201659
www.douglas-westwood.com


