2004 - Asianbanks.net
2004 - Asianbanks.net
2004 - Asianbanks.net
- No tags were found...

You also want an ePaper? Increase the reach of your titles
YUMPU automatically turns print PDFs into web optimized ePapers that Google loves.
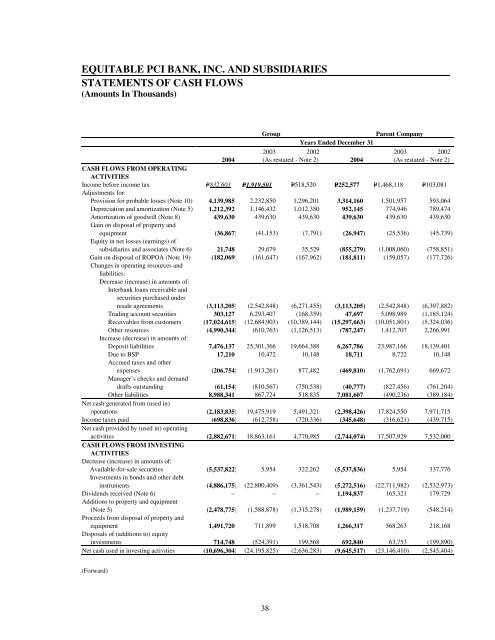
EQUITABLE PCI BANK, INC. AND SUBSIDIARIESSTATEMENTS OF CASH FLOWS(Amounts In Thousands)GroupParent CompanyYears Ended December 312003 2002 2003 2002<strong>2004</strong> (As restated - Note 2) <strong>2004</strong> (As restated - Note 2)CASH FLOWS FROM OPERATINGACTIVITIESIncome before income tax P=832,603 P=1,919,501 P=518,520 P=252,577 P=1,468,118 P=103,081Adjustments for:Provision for probable losses (Note 10) 4,139,985 2,232,850 1,296,201 3,314,160 1,501,957 593,064Depreciation and amortization (Note 5) 1,212,392 1,146,432 1,012,350 952,145 774,946 789,474Amortization of goodwill (Note 8) 439,630 439,630 439,630 439,630 439,630 439,630Gain on disposal of property andequipment (36,867) (41,153) (7,791) (26,947) (25,536) (45,739)Equity in <strong>net</strong> losses (earnings) ofsubsidiaries and associates (Note 6) 21,748 29,679 35,529 (855,279) (1,008,060) (758,851)Gain on disposal of ROPOA (Note 19) (182,069) (161,647) (167,962) (181,811) (159,057) (177,726)Changes in operating resources andliabilities:Decrease (increase) in amounts of:Interbank loans receivable andsecurities purchased underresale agreements (3,113,205) (2,542,848) (6,271,455) (3,113,205) (2,542,848) (6,397,882)Trading account securities 303,127 6,293,407 (168,359) 47,697 5,098,989 (1,185,124)Receivables from customers (17,024,615) (12,684,903) (10,389,144) (15,297,663) (10,051,801) (5,324,036)Other resources (4,990,344) (610,763) (1,126,513) (787,247) 1,412,707 2,266,991Increase (decrease) in amounts of:Deposit liabilities 7,476,137 25,301,366 19,664,388 6,267,786 23,987,166 18,139,401Due to BSP 17,210 10,472 10,148 18,711 8,722 10,148Accrued taxes and otherexpenses (206,754) (1,913,261) 877,482 (469,810) (1,762,691) 669,672Manager’s checks and demanddrafts outstanding (61,154) (810,567) (750,538) (40,777) (827,456) (761,204)Other liabilities 8,988,341 867,724 518,835 7,081,607 (490,236) (389,184)Net cash generated from (used in)operations (2,183,835) 19,475,919 5,491,321 (2,398,426) 17,824,550 7,971,715Income taxes paid (698,836) (612,758) (720,336) (345,648) (316,621) (439,715)Net cash provided by (used in) operatingactivities (2,882,671) 18,863,161 4,770,985 (2,744,074) 17,507,929 7,532,000CASH FLOWS FROM INVESTINGACTIVITIESDecrease (increase) in amounts of:Available-for-sale securities (5,537,822) 5,954 322,262 (5,537,836) 5,954 337,776Investments in bonds and other debtinstruments (4,886,175) (22,800,409) (3,361,543) (5,272,516) (22,711,982) (2,532,973)Dividends received (Note 6) − − − 1,194,837 165,321 179,729Additions to property and equipment(Note 5) (2,478,775) (1,588,878) (1,315,278) (1,989,159) (1,237,719) (548,214)Proceeds from disposal of property andequipment 1,491,720 711,899 1,518,708 1,266,317 568,263 218,168Disposals of (additions to) equityinvestments 714,748 (524,391) 199,568 692,840 63,753 (199,890)Net cash used in investing activities (10,696,304) (24,195,825) (2,636,283) (9,645,517) (23,146,410) (2,545,404)(Forward)38