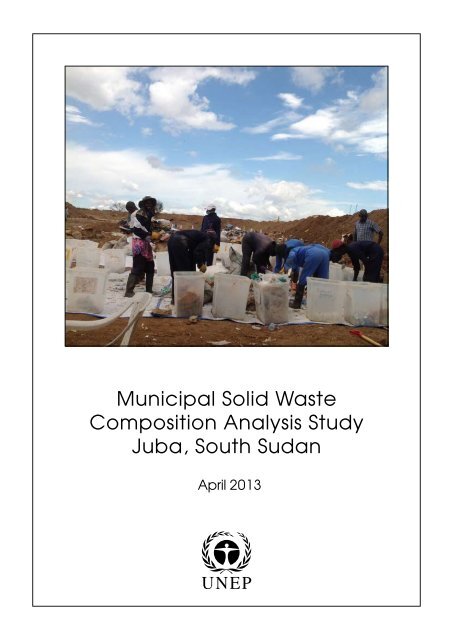
Municipal Solid Waste Composition Analysis Study Juba ... - UNEP
Municipal Solid Waste Composition Analysis Study Juba ... - UNEP
Municipal Solid Waste Composition Analysis Study Juba ... - UNEP
- No tags were found...

Create successful ePaper yourself
Turn your PDF publications into a flip-book with our unique Google optimized e-Paper software.
<strong>Municipal</strong> <strong>Solid</strong> <strong>Waste</strong><strong>Composition</strong> <strong>Analysis</strong> <strong>Study</strong><strong>Juba</strong>, South SudanApril 2013
http://unep.org/SouthSudan/Standards for use of the UK aid logo June 2012This report by the United NationsEnvironment Programme wasmade possible by the generouscontribution of the Governmentof the United KingdomThis report was prepared by Michael J. Cowing for United Nations Environment Programme, South Sudan.<strong>UNEP</strong> wishes to thank the following parties, in no particular order of priority, for their invaluable contribution to the successfulexecution of this challenging exercise: <strong>Juba</strong> City Council, JICA, <strong>Juba</strong> County Council, the waste-pickers, SSDO, <strong>Juba</strong> University.DisclaimerNo use of this publication may be made for resale or for any other commercial purpose whatsoever without prior permission in writingfrom <strong>UNEP</strong>. The contents of this volume do not necessarily reflect the views of <strong>UNEP</strong>, or contributory organizations. The designationsemployed and the presentations do not imply the expressions of any opinion whatsoever on the part of <strong>UNEP</strong> or contributoryorganizations concerning the legal status of any country, territory, city or area or its authority, or concerning the delimitation of itsfrontiers or boundaries.
Table of contents1. Background and Rationale ……………………………………… 22. Methodology ……………………………………………………. 53. Equipment ………………………………………………............ 84. Procedure ………………………………………………………. 95. Health & Safety ………………………………………………... 126. Results ………………………………………………………….. 147. Conclusions ……………………………………………………... 198. Recommendations……………………………………………….. 20ATTACHMENTS:Attachment 1 – <strong>Waste</strong> <strong>Analysis</strong> Forms…………………………. 21Attachment 2 – <strong>Waste</strong> Definitions………………………............. 23Attachment 3 – Results of <strong>Waste</strong> Characterisation Exercise..…... 28<strong>Municipal</strong> solid waste composition analysis study – <strong>Juba</strong>, South Sudan 1
1. BACKGROUND AND PROJECT RATIONALEThe rapid increase in both the volume and variety of solid and hazardous waste as a resultof continuous economic growth, urbanization and industrialization, is a growing problemfor both national and local governments around the world. Presently, it is estimated thatthe total amount of municipal solid waste (MSW) generated globally is increasing bysome 8 per cent per year (<strong>UNEP</strong>/IETC, 2009).Although considerable efforts are being made around the globe by many governmentsand other entities to tackle waste-related problems, there is still much to be done. TheWorld Bank estimates that in developing countries, municipalities spend up to 50 per centof their available budget on solid waste management. However, despite this remarkableexpenditure across the developing world, a large proportion of urban solid wastes remainuncollected. Furthermore, much of the population in general, and the poorest people inparticular, remain without service.The condition of waste management in the city of <strong>Juba</strong> in South Sudan is worsening wellabove the curve of these worrying global trends. <strong>Juba</strong>’s population is continuing to growrapidly – largely as a result of migration due to the conflict with Sudan. Exact figures arenot available and the existing data is somewhat contradictory. The 2008 Census held thepopulation of the city to be 375,000 but other sources, including the United Nations(UN), estimate that it is now over one million (Sudd Institute study-2012). Whatever theprecise numbers it is universally recognized that <strong>Juba</strong> is one of the fastest growing citiesin the world. The city’s already overstretched and disorganized waste managementsystems are ill-equipped to cope with the increase in demand precipitated by thispopulation growth. They are in urgent need of review and improvement.Clearly a comprehensive understanding of waste management processes in <strong>Juba</strong> is aprerequisite for the design of any remedial measures there. That understanding issignificantly hampered at present by a dearth of reliable waste generation andcharacterization data.With this critical relationship between knowledge and solutions in mind, the UnitedNations Environment Programme (<strong>UNEP</strong>) has commissioned this study to address theissue of the availability and accuracy of waste analysis data in <strong>Juba</strong>.It is worth noting that <strong>Juba</strong> is far from singular in this respect. Many African cities are indire need of improving their MSW management systems, and will need to clarify thestreams of relevant data if that need is to be met. So the results and conclusions from thework conducted in <strong>Juba</strong> and presented in this study will have a wider regional relevanceand application.The current picture at <strong>Juba</strong>’s Lagoon Dump Site is mixed. On the one hand the JapanInternational Cooperation Agency (JICA) is making significant improvements by fencingthe site; developing and implementing an operational plan; providing mechanical plantand equipment; and regularly applying cover material.<strong>Municipal</strong> solid waste composition analysis study – <strong>Juba</strong>, South Sudan 2
On the other hand, the engineered void-space within the disposal site remains relativelysmall and only offers approximately two years of operational capacity. Similarly, thelonger-term future of the site is questionable at best, not least because the facility is notincluded in the city’s Master Plan.Lastly, the surrounding area is urbanizing rapidly, largely because the government ismoving many of its ministries away from the congested city center.So for all these reasons, the need to use recycling to divert waste away from the LagoonDump - and thus extend the operational life of the site - is all the more pressing. Thelocation of the site’s footprint is shown in Figure 1 below.Figure 1 – the approximate location of the Lagoon Dump Site to the West of <strong>Juba</strong> CityIt is unclear whether there are any formal recycling activities ongoing within <strong>Juba</strong>. It iscertain however, that considerable volumes of material are extracted from the incomingwaste stream at the disposal site by several hundred waste-pickers or informal wasterecyclers.These informal waste recycling activities, which convert waste products, such as plasticand aluminum beverage containers into resources, are of great importance not only to thelocal economy but also to the wider process of waste management.<strong>Municipal</strong> solid waste composition analysis study – <strong>Juba</strong>, South Sudan 3
Income generated by these activities makes an essential contribution to the livelihoods ofa large number – certainly several hundred, possibly even thousands – of villagers livingin close proximity to the site. More broadly, informal waste recycling activities are anessential component of the Integrated <strong>Solid</strong> <strong>Waste</strong> Management (ISWM) system, whichis based on the 3R (reduce, reuse and recycle) principle, and is an internationallyaccepted approach to waste management that is being progressively implemented in bothdeveloped and developing countries around the world.Photo 1 – <strong>Waste</strong>-pickers converge on a waste collection vehicle at the Lagoon DumpSite.<strong>Municipal</strong> solid waste composition analysis study – <strong>Juba</strong>, South Sudan 4
2. METHODOLOGY2.1 <strong>Waste</strong> CharacterisationThe waste characterisation exercise was undertaken at the Lagoon Dump site by the leadconsultant, and was conducted in compliance with two main international publications:• ASTM - American Society for Testing and Materials - Standard Test Method forDetermination of the <strong>Composition</strong> of Unprocessed <strong>Municipal</strong> <strong>Solid</strong> <strong>Waste</strong> -D5231 – 92 - 2008);• <strong>UNEP</strong>/IETC - Developing Integrated <strong>Solid</strong> <strong>Waste</strong> Management Plan, Volume 1,<strong>Waste</strong> Characterisation and Quantification wit Projections for Future (2009).The approach developed for this exercise satisfies the need for methods to be structured,produce accurate and reliable results, and to be repeatable.Seldom in waste management is the total population measured - therefore, representativesampling of the type undertaken during this exercise is an established practice foraccurately determining waste quantities and waste characteristics.The selected method is based on the collection and manual sorting of a number ofsamples of waste over a period of five (5) days i.e. from Monday to Friday.The recommended sample weight of approximately 100 kg was used for the study as ithas been established, through various studies, that measurements made on this size ofsample do not vary significantly from measurements made on far larger samples takenfrom the same waste.According to the ASTM methodology, a total of thirty two (32) randomly selectedsamples must be analyses in order to provide the desired level of statistical accuracy(90%) and confidence. However, due to various logistical and financial constraints thetotal number of samples analysed was 25. According to <strong>UNEP</strong>’s InternationalEnvironmental Technology Centre (2009) methodology this provides a confidence levelof 80% for the majority of materials including newspaper, aluminum, ferrous metal,glass, plastic and organic – but not cardboard.For the purpose of this study, nine (9) major waste categories were selected for sampling– which catered for all of the requested categories within the TOR. These nine wastecategories were further broken down into some 45 sub-categories – all of which aredetailed within the Sample Form provided within Attachment 2 at the end of this report.<strong>Municipal</strong> solid waste composition analysis study – <strong>Juba</strong>, South Sudan 5
The nine (9) major waste categories for the characterization exercise were as follows:• Paper and Paperboard• Glass• Metal• Plastic• Textiles• Organics• Construction and Demolition (C & D) <strong>Waste</strong>s• Special Care <strong>Waste</strong>s• Other <strong>Waste</strong>sEach waste sample of approximately 100 kg was sorted manually into dedicatedcontainers for each of the respective waste components by a team of 10 local staff whohad been trained by the consultant prior to the exercise. Each of the local staff was veryfamiliar with the site and the handling of waste as they were all informally employed atthe site as waste-pickers.2.2 Bulk DensityThe bulk density of the incoming waste was calculated by executing the followingprocedures:• A container of a known volume (V1) was weighed and its weight recorded (W1).• A sample of each consignment of waste was poured into the container until itoverflowed.• The contents of the container were settled by dropping it three times onto themeasuring table from an approximate height of 10cm.• The container was then topped up with additional waste from the selected sample.• The container was then weighed again and the weigh recorded (W2).• The bulk density was then calculated using the following equation: W2–W1/ V1.2.3 <strong>Waste</strong> GenerationThis phase of the study sought to determine the waste generation rate per capita for thetown of <strong>Juba</strong> and was undertaken by the South Sudan Development Organisation (SSDO)- a local NGO - between12-16 December, 2012.SSDO selected 306 houses in total from three different districts of the city to representhigh, middle and low income categories of housing. Additionally, 50 shops of small,medium and large sizes were also selected from the largest market within <strong>Juba</strong> known asKonyo Konyo Market.<strong>Municipal</strong> solid waste composition analysis study – <strong>Juba</strong>, South Sudan 6
Six individuals were recruited as data-collectors – each of whom managed the collectionof data from 60 houses while one data-collector was dedicated to the collection of datafrom shops.The main procedures for the waste generation exercise included the following steps:• Provision of colour coded plastic bags to selected houses and shops:o Yellow for high-income areas and large shops;o Blue bags for middle-income areas and medium size shops;o Black bags for low-income areas and small size shops.• Households were asked to store all waste produced in the preceding 24 hours;• The designated data collector collected and weighed the waste each day using asmall portable weighing machine.• Additionally, the details regarding the number of inhabitants within eachparticipating property were recorded for last 24-hour period.The above procedures allowed for calculation of waste produced per capita byhouseholds in different districts of the town as well as per economic status.<strong>Municipal</strong> solid waste composition analysis study – <strong>Juba</strong>, South Sudan 7
3. EQUIPMENT3.1 <strong>Waste</strong> CharacterisationThe equipment used in the execution of the waste characterisation survey included thefollowing:• Access to the site’s wheeled-loader to transport, when necessary, samples ofwaste to the area designated for the analysis exercise.• One (1) Bench Scale• One (1) Crane Scale with a capacity of 125 kg• Five (5) Heavy-Duty Tarps,• Five (5) Shovels,• Five (5) Rakes,• Five (5) Hand Brooms,• Forty-five (45) waste containers – labeled for each sub-category of waste;• two (2) wheel-barrows• One (1) large canopy to provideshade and shelter during heavyrain• Twenty (20) traffic cones.• one (1) large First Aid Kit• one (1) eye-bath,• Personal Protective Equipment forthe ten staff members, including:o Over-alls;o Leather and latex gloves,o Rubber boots,o Disposable face masks• Portable wash-water facilitieswith soap and disinfectant.• Provision of drinking water andlunch for samplers each day plusregular rest-breaks in the shadebetween each sample analysis.3.2 <strong>Waste</strong> GenerationAll information pertaining to the wastegeneration study undertaken by SSDO isprovided within Attachment 5 at the endof this report.Photo 2 - weighing of waste samples using thebench-scales.<strong>Municipal</strong> solid waste composition analysis study – <strong>Juba</strong>, South Sudan 8
4. PROCEDURE4.1 <strong>Waste</strong> CharacterisationThe following procedures were followed in the execution of the waste characterizationexercise:1. The area within the Lagoon Site designated for the waste analysis exercise wasdemarcated using high visibility traffic-cones. This ensured the safety of the teamby preventing vehicles and mobile plant and equipment from randomly enteringthe area.2. The demarcated area was as flat as possible and in close proximity to the tippingcellfor ease of movement of waste between the two zones.3. The large tarps were spread on level ground within the designated area for theexercise. Their use was important to minimize the amount of contamination ofthe waste samples from the underlying soil.4. The forty-five (45) waste storage containers were each labeled with the wastecomponents selected for sampling and were arranged around the perimeter ofeach of the tarps.5. The tare weight of each of the containers was and recorded and periodically rechecked(2.2 kg average weight).6. The bench-scale was placed in the vicinity of the storage containers on a clean,flat wooden table.7. The accuracy of the scale was periodically checked using a known (reference)weight.Photo 3 – Tarps and labeled waste containers deployed within the designatedsampling area<strong>Municipal</strong> solid waste composition analysis study – <strong>Juba</strong>, South Sudan 9
8. At the start of the characterization exercise, waste samples were selected from thestockpiled bagged waste from the SSDO waste generation exercise.9. Once the stockpiled bagged waste was exhausted on Day 4 of the wastecharacterization exercise, waste was obtained randomly from incoming wastecollection vehicles.10. Complete details of the source and type of each waste sample examined areprovided within Table 1 below.11. Information on the sampled waste both from the SSDO exercise and from thedriver of selected waste collection vehicles was obtained and recorded within thewaste sampling form – a copy of which is provided within Attachment 2 of thisreport. The type of information collected for each waste sample included:a. date;b. time;c. vehicle details;d. origin of waste;e. weather conditions.12. For waste samples obtained from incoming vehicles – the site’s wheeled-loaderwas used to mix and cone the waste and transport a sample to the designatedsampling area.13. The waste was placed onto the tarpaulin and a representative 100kg sample sizeobtained using the bench-scale.14. The sorting personnel began sorting the selected waste sample without delay.15. All containers within the waste, such as capped jars, paper bags, and plastic bagswere emptied of their contents and the different materials segregated – such asmetal lids from glass jars.16. Following identification and segregation each waste item was segregated andplaced in the appropriately labeled storage container.17. In the case of composite items found in the waste, the individual materials wereseparated, where practical, and the individual materials placed in the appropriatestorage containers.18. Sorting of the waste continued until the maximum particle size of the remainingwaste particles was approximately 10mm at which point the remaining particleswere apportioned into the storage containers corresponding to the wastecomponents represented in the remaining mixture.19. The gross weights of the storage containers was then recorded on the prescribedform including, where necessary, waste items sorted but not stored in thecontainers.20. Following the weighing of the wastes from the sorting area it was removed eitherby hand or by the wheeled-loader.21. The target was to complete five (5) to six (6) samples each day although due tologistical constraints on the site this did not always prove to be possible.<strong>Municipal</strong> solid waste composition analysis study – <strong>Juba</strong>, South Sudan 10
Table 1 – Details of <strong>Waste</strong> Samples Analysed at Lagoon Dump SiteSampleNoSample Date Sample Location <strong>Waste</strong> Type <strong>Waste</strong> Storage &Collection1. 17/12/2012 Amarat Residential(high income)Plastic bagsHouse to House2. 17/12/2012 Jalaba & Atlabara Residential(medium income)Plastic bagsHouse to House3. 17/12/2012 Gabat, Munuki & ResidentialPlastic bagsKator(low income)House to House4. 18/12/2012 Amarat Residential(high income)Plastic bagsHouse to House5. 18/12/2012 Jalaba & Atlabara Residential(medium income)Plastic bagsHouse to House6. 18/12/2012 Gabat, Munuki & ResidentialPlastic bagsKator(low income)House to House7. 18/12/2012 Amarat Residential(high income)Plastic bagsHouse to House8. 18/12/2012 Jalaba, Atlabara &TongpinkResidential(medium income)Plastic bagsHouse to House9. 18/12/2012 Gabat, Munuki & ResidentialPlastic bagsKonyo-Konyo (low income)House to House10. 19/12/2012 Amarat, Atlabara Residential(high/medium income)Plastic bagsHouse to House11. 19/12/2012 Hai-Jalaba, Atlabara, ResidentialPlastic bagsTongping(medium income) House to House12. 19/12/2012 Gabat, Munuki & ResidentialPlastic bagsKonyo-Konyo (low income)House to House13. 19/12/2012 Munuki Residential(low/medium income)Plastic bagsHouse to House14. 19/12/2012 Jebel Market Market Skip container15. 19/12/2012 Kololo U.S Embassy Plastic bags16. 20/12/2012 Malakia Market Market Skip container17. 20/12/2012 Rujal Maffi Market Market Skip container18. 20/12/2012 Hai-Thoura Residential(medium income)Plastic bagsHouse to House19. 20/12/2012 Hajjar Tobacco Co Commercial Flat Bed Truck20. 21/12/2012 Aron Int’ Hotel Commercial Plastic bagsSkip Container21. 21/12/2012 Ministry of CabinetAffairsInstitutionalPlastic bagsFlat bed truck22. 21/12/2012 Gudele Block 8,Munuki PayamResidential(medium income)Plastic bagsHouse to House23. 21/12/2012 UNCompoundJebel KujurInstitutionalPlastic bagsSkip Container24. 21/12/2012 Nyakuron East Market Market plastic bagsFlat bed truck25. 21/12/2012 Tongping <strong>Juba</strong>Na-BariResidential(high income)Plastic bagsFlat bed truck<strong>Municipal</strong> solid waste composition analysis study – <strong>Juba</strong>, South Sudan 11
5. HEALTH AND SAFETY5.1 <strong>Waste</strong> CharacterisationBecause of the hazards associated with the sorting of solid waste, appropriate measureswere undertaken to ensure the protection of the members of the sorting team. Thesemeasures included the provision of Personal Protective Equipment (PPE) to all staffalong with the provision of appropriate training provided by the consultant prior to thecommencement of the exercise.Photo 4 – PPE in use during the characterization exercise, including overalls, boots,gloves and disposable face-masks.The team of waste-sorters was clearly briefed to be mindful of the danger that projectilesof various kinds might well escape from the waste as it was being unloaded. Clearly anyprocess that involves crushing large numbers of glass, metal, and plastic containers, willgenerate a certain amount of airborne splinters that could well pose a threat to life andlimb. Similarly the members of the team were made aware of the threat posed to them byvarious sharp objects - nails, razor blades, hypodermic needles, pieces of glass and so on - allof which are present in the solid waste.<strong>Municipal</strong> solid waste composition analysis study – <strong>Juba</strong>, South Sudan 12
Supervisory staff ensured that sorting-personnel adhered to all health and safety measuresand precautions – including the use of PPE.Exposure of the team to heat stress, dehydration and fatigue were monitored and riskswere minimized by ensuring the adequate provision of drinking water, food and shade –in conjunction with regular rest breaks.High levels of hygiene were emphasized and catered for throughout the five-day exerciseby the provision of water, soap and disinfectant for use during rest breaks and prior toeating and at the end of each working day.During the five-day exercise no injuries were recorded. However, it was noted thatvirtually all of the staff, each of whom work at the site as waste-pickers, had examples ofcuts and puncture wounds primarily on their hands and feet, due to the absence ofsuitable PPE (Personal Protection Equipment).<strong>Municipal</strong> solid waste composition analysis study – <strong>Juba</strong>, South Sudan 13
6. RESULTS6.1 <strong>Waste</strong> CharacterisationThe main findings of the waste characterisation study conducted in December 2012 at theLagoon Dump Site are provided in Table 2 below and represented graphically in Figure 1.Table 2 – Key Results from <strong>Waste</strong> Characterization <strong>Study</strong>No <strong>Waste</strong> Component % by Weight1. Organics 312. Plastics 203. Paper & Cardboard 124. Soil/ash 125. Metal 76. Other <strong>Waste</strong> 77. Glass 58. Textiles 49. Special Care <strong>Waste</strong> 2TOTAL 100<strong>Municipal</strong> solid waste composition analysis study – <strong>Juba</strong>, South Sudan 14
The main components of the MSW from <strong>Juba</strong> are represented in Figure 1 on the previouspage. Organic materials represented the single largest component of the MSW streamfrom <strong>Juba</strong> accounting for 31% by weight - followed by plastics at 20%; paper 12%; soil& ash 12%; metal 7%; glass 5 %; textiles 4%; & special-care waste 2%.Major <strong>Waste</strong> ComponentsThe figures for <strong>Juba</strong>’s waste composition for items such as paper, metal and glass at 12%,7% and 5% respectively, are similar to <strong>UNEP</strong>’s International Environmental TechnologyCentre (2009) average figures from Accra, Ibadan, Dakar, Abidjan, and Lusaka.However, the organic content, despite being the largest single component of <strong>Juba</strong>’swaste, at 31% is low compared to <strong>UNEP</strong>/IETC’s range of 35-80%. Also, <strong>Juba</strong>’s plasticcomposition of 20% was considerably higher than <strong>UNEP</strong>/IETC’s average figure of lessthan 10%.These apparent anomalies in some of the waste characteristics may be explained, at leastin part, by the unique nature of the <strong>Juba</strong>’s rapid expansion over the last two years or so.A clearer picture - and one in which we could have a great deal more confidence - wouldemerge if a second waste characterisation exercise were to be conducted during the wetseason.Such an exercise would yield a higher number of samples and a correspondingamount of results.Organic <strong>Waste</strong>Organic waste was the largestcomponent of the overall wastestream by weight accounting for31%. Within that organic waste,garden/yard waste accounted forthe largest component at 64%,followed by food waste at 34%,and agricultural waste at 2%.During the sampling exercise itwas noted that many of the wastepickerswere eating items of fooddirectly from the waste, such asfruit and kitchen waste, and, in thecase of vegetables and carbohydrates,collecting them forremoval from the site and forcooking later in the day.<strong>Municipal</strong> solid waste composition analysis study – <strong>Juba</strong>, South Sudan 15
Plastic <strong>Waste</strong>Plastic waste made up 20% of thetotal waste stream by weight. Thelargest single component of thatplastic waste was clear PETcontainers at 46%, followed by filmplastic at 33%, HDPE containers at12%, and other plastics at 5%.Brown and green PET accounted for2% each.A large proportion of the clear PETcontainers, most of which havecontained drinking water, are takenout of the waste by the waste pickersand sold to middle-men who usuallywash and shred the material beforetransporting it by truck to Uganda orKenya.We found no evidence that film plastic or HDPE containers are recycled at all. Oneplausible explanation for this apparent anomaly is that those materials will fetch a lowprice in the regional market place and so are not prized by the waste pickers.Paper & Cardboard <strong>Waste</strong>Paper & Cardboard waste made up12% by weight of the total wastestream. The largest component ofthis waste category was cardboard at57%, followed by office paper at15%, other miscellaneous paper at13%, newspaper at 9% andmagazines and catelogues at 6%.We found no evidence that paper orcardboard are recycled at all.<strong>Municipal</strong> solid waste composition analysis study – <strong>Juba</strong>, South Sudan 16
Metal <strong>Waste</strong>Metal waste accounted for 7% of theoverall waste volume by weight.Aluminium containers, typically usedfor containng soft drinks, representsthe largest component of the metalwaste stream at 49%, followed bytin/steel containers at 39%, otherferrous metals at 10%, and other nonferrous metal containers at 2%.<strong>Waste</strong>-pickers recover and sell a largeproportion of the aluminium containersthat arrive at the site. The middle-menwho buy the aluminium melt it into smallbars so as to facilitate transporting thematerial by road to Kenya and Uganda.Tin and steel containers are not as yetbeing collected in significant numbers -probably because they are worth less thanaluminium.Other <strong>Waste</strong>Other waste accounted for 7% of theoverall waste stream sampled. Thelargest component of this wastecategory by weight was nylon sheetingat 31%, followed by disposalnappies/diapers at 24%, charcoal at19%; waste electrical equipment at12%; polystyrene at 8%, ceramics at4%, and tyres at 2%. This category ofwaste is targetted by the waste-pickersbut in an understandably ad hocfashion. This is particularly true ofcharcoal and waste electricalequipment.<strong>Municipal</strong> solid waste composition analysis study – <strong>Juba</strong>, South Sudan 17
6.2 <strong>Waste</strong> GenerationThe outcome from SSDO’s waste generation exercise is somewhat puzzling – producingan average household waste generation rate within <strong>Juba</strong> of 1.11 kg/cap. Day. This amountis considerably above the range found by <strong>UNEP</strong>’s International EnvironmentalTechnology Centre (2009) in a range of African cities (Accra, Ibadan, Dakar, Abidjan,and Lusaka) and determined a generation rate of 0.5-0.8 kg/capita/day.Still more perplexing is the fact that SSDO’s exercise determined that low-income houseswere actually producing more waste than high-income houses – average figures being0.87 and 1.14 kg/capita/day respectively. This statistic goes against the global trend inwhich waste generation increases in proportion to wealth.6.3 <strong>Waste</strong> DensityDensities in the range of 90 to 180 kilograms per cubic meter (kg/m 3) for un-compactedMSW are common in OECD case studies. 1 <strong>Waste</strong> densities in African cities, by contrast,may be in the range of 180 to 540 kg/m 3 due to the high moisture and putrescible organiccontent.The average density for <strong>Juba</strong>’s waste was found to be 112 kg/m 3, which is low comparedto that of an average African city. This figure can probably be accounted for by twofactors. The first is that the study was conducted during the dry season and so themoisture content was low. The second is that, in general, the organic content of <strong>Juba</strong>’swaste is low in comparison to that of the average African city.1 It is worth noting that compacted MSW, as delivered by collection vehicles with mechanical compactors,can have densities up to two to three times that of uncompacted waste depending on the composition of thewaste, and the type of compacting equipment.<strong>Municipal</strong> solid waste composition analysis study – <strong>Juba</strong>, South Sudan 18
7. CONCLUSIONS1. The waste characterisation exercise was undertaken during the dry season in <strong>Juba</strong>– although there were occasional light showers of rain. So the understanding ofthe character of <strong>Juba</strong>’s waste remains partial.2. By undertaking this waste generation and characterisation exercise an importantstep has been taken towards assisting with the planning and implementation ofappropriate and sustainable SWM practices within <strong>Juba</strong> in the future.3. The waste generation rates of 1.1kg/capita/day are surprisingly high and should betaken with a degree of caution until such time as when a second exercise isundertaken in the wet season. Presently, it is difficult to explain why lowerincome houses were found to be producing more waste than high income houses –a finding which goes against both African and global trends.4. The average bulk density of the waste of 112 kg/m 3 indicates that the wastematerial could be compacted by waste collection vehicles fitted with acompaction mechanism – similar to those recently deployed by <strong>Juba</strong> City Council.Such vehicles are more economical than an equivalent sized flat-bed truckbecause their payloads are three to four times bigger.5. There is a healthy amount of informal recycling activities at the disposal site.PET, and aluminium and ferrous metal containers are the materials that arerecycled the most.6. Spending a week on the Lagoon Dump Site has reinforced an appreciation of thecontribution made by the waste-pickers both to their economy and to wastemanagement. They salvage significant amounts of recyclable materials daily andin so doing generate income for many local people and help to extend theoperational life of the site.7. Lastly, these practices of waste picking and the benefits they bring, could beaugmented by composting organic waste, which represents 31% of the totalincoming waste. That possibility should be explored, as should the potential forusing the compost in the local agricultural sector.<strong>Municipal</strong> solid waste composition analysis study – <strong>Juba</strong>, South Sudan 19
8. RECOMMENDATIONS1. In compliance with international best practice - a second waste compositionexercise should be conducted during the wet season to measure any seasonalvariations.2. Additional donor funding should be sought to address the key factors to ensurethat any improvements in SWM in <strong>Juba</strong> City are sustainable, namely:i. institutional capacity building;ii. supportive policy and legislative frameworks;iii. public education and awareness raising;iv. cost recovery mechanisms.3. The deployment by <strong>Juba</strong> City Council of new compactor vehicles to collectmunicipal waste should be applauded, and where possible those measures shouldbe extended to all areas of the city.4. The generation and utilization of compost from incoming organic waste should beintroduced as a pilot exercise – and after six months evaluated for up-scaling.5. The activities of the waste-pickers at the Lagoon Dump Site should be supportedby the authorities by a combination of activities, possibly including, but notlimited to, the following:i. Assisting with the establishment of a recognised organisation ofwaste-pickers;ii. Enhancing the access waste-pickers have to local recyclingmarkets;iii. Improving the health and safety conditions under which the wastepickerswork through the introduction of appropriate equipment(PPE) – particularly safety boots and gloves;iv. Organizing regular health screening and innoculations for thewaste-pickers;v. Raising their awareness on health issues and hygeine;vi. Building initiatives that encourage young children at the site toreturn to school.<strong>Municipal</strong> solid waste composition analysis study – <strong>Juba</strong>, South Sudan 20
ATTACHMENT 1<strong>Waste</strong> <strong>Analysis</strong> Forms• DATE: • VEHILCE I.D:• TIME:oSTARTED:• WASTE ORIGINATING FROM:• FORM COMPLETED BY:o FINISHED: o NAME:• WEATHER CONDITIONS:oSIGNATURE:MATERIALTYPEPAPER&PAPERBOARD1 Newspaper2 Cardboard/boxboard3 Magazines/catalogues4 Officepaper5 Other/miscellaneouspaperGLASS6 Clearcontainers7 Greencontainers8 Amber containers9 Remainder/compositeglassMETAL10 Tin/steelcontainers11 Aluminumcontainers12 Otherferrousmetal13 Othernon-ferrousmetal14MajorappliancesGross(kg) Tare(kg) Net(kg) %of Total<strong>Municipal</strong> solid waste composition analysis study – <strong>Juba</strong>, South Sudan 21
MATERIAL TYPE Gross(kg) Tare(kg) Net(kg) %of TotalPLASTICS15 Clear PET Bottles/containers16 Green PET Bottles/Containers17 Amber PET Bottles/containers18 HDPEcontainers19 Filmplastics20 OtherplasticsTEXTILE21 TextilesORGANICS22 Food waste23 Garden waste24 Agriculturalwaste25 Abattoir <strong>Waste</strong>26 Remainder/compositeorganicsCONSTRUCTION&DEMOLITIONMATERIAL27 Concrete28 Lumber29 Remainder/compositeC& DSPECIALCAREWASTES30 Paint31 Hazardousmaterials32 Biomedical33 Batteries34 Oil Filters35 Remainder/composite S.C. <strong>Waste</strong>OTHER WASTE36 <strong>Waste</strong> Electrical Products (WEEE)37 Tyre38 Furniture39 Ceramics40 Other<strong>Municipal</strong> solid waste composition analysis study – <strong>Juba</strong>, South Sudan 22
ATTACHMENT 2<strong>Waste</strong> DefinitionsPAPER AND PAPERBOARD1. "Newspaper" means paper used in newspapers. This type includes newspaper and allitems made from newsprint, such as free advertising guides.2. "Cardboard" usually has three layers. The center wavy layer is sandwiched betweenthe two outer layers. It does not have any wax coating on the inside or outside. This typedoes not include chipboard. This type includes entire cardboard containers, such asshipping and moving boxes, computer packaging cartons, and sheets and pieces of boxesand cartons. This type does not include chipboard.3. "Magazines and Catalogues" means items made of glossy coated paper. This paper isusually slick, smooth to the touch, and reflects light. This type includes glossymagazines, catalogues, brochures, and pamphlets.4.”Office Paper” means paper generated in an office setting and includes computer paper,white envelopes white window envelopes, notebook paper, ground wood computer paper,carbonless forms, goldenrod coloured paper and school construction paper.5. "Other Miscellaneous Paper" means items made mostly of paper that do not fit intoany of the other paper types. This includes telephone books and directories, items madeof chipboard, ground wood paper, and deep-toned or fluorescent dyed paper. Examplesincludes unused paper plates and cups, perforated edge (fan-fold) computer paper, manilafolders, manila envelopes, index cards, white envelopes, butcher paper, and hard coverand soft cover books, waxed corrugated cardboard, aseptic packages, plastic-coated papermilk cartons, waxed paper, tissue, paper towels, blueprints, sepia, onion skin, fast foodwrappers, carbon paper, self adhesive notes, and photographs.GLASS6. "Clear Containers" means clear glass beverage/food containers. This typeincludes whole or broken clear soda, beer, fruit juice, liquor bottles, fruit, jam,mayonnaise containers etc.7. "Green Containers" means green, glass beverage containers. This type includes wholeor broken green soda and beer bottles and food jars.8. "Amber Containers" means amber glass beverage/food containers. This type includeswhole or broken brown soda and beer bottles and food jars.<strong>Municipal</strong> solid waste composition analysis study – <strong>Juba</strong>, South Sudan 23
9. "Remainder/Composite Glass" means glass that cannot be put in any other type ortype. It includes flat (pane) glass as well as items made mostly of glass but combinedwith other materials. This type includes window glass, Pyrex, Corning ware, crystal andother glass tableware, mirrors, light bulbs, and auto windshields.METAL10. "Tin/Steel Containers" means rigid containers made mainly of steel. Theseitems will stick to a magnet and may be tin-coated. This type is used to store beveragesand food. This type includes beverage containers including bimetal containers with steelsides and aluminum ends.11. "Aluminum Containers" means any beverage/food container made mainly ofaluminum. This type includes aluminum soda, beer and food containers. This type doesnot include bi-metal containers with steel sides and aluminum ends.12. "Other Ferrous Metal" means any other ferrous metal items not mentioned above.13. "Other Non-Ferrous Metal" means any other non-ferrous metal items not mentionedabove.14. "Major Appliances" means discarded major appliances of any colour. These itemsare often enamel-coated. Examples: This type includes washing machines, clothes dryers,hot water heaters, stoves, and refrigerators. This type does not include electronics, suchas televisions and stereos.PLASTICS15. Clear PET Bottles/Containers" means clear PETE (polyethylenetrephthelate) beverage/food containers. When marked for identification, it bears thenumber "1" in the center of the triangular recycling symbol and may also bear the letters"PETE" or "PET". A PETE container usually has a small dot left from the manufacturingprocess, not a seam. It does not turn white when bent. This type includes juice, soft drinkand water bottles and some liquor bottles.16. Green PET Bottles/Containers – means green PETE (polyethylenetrephthelate) beverage/food containers. (see above for details).17. Amber PET Bottles/Containers – means amber PETE (polyethylenetrephthelate) beverage/food containers. (see above for details).18. "HDPE Containers" means natural and coloured HDPE (high-density polyethylene)containers. This plastic is usually either cloudy white, allowing light to pass through it(natural) or a solid colour, preventing light from passing through it (coloured). Whenmarked for identification, it bears the number "2" in the triangular recycling symbol. This<strong>Municipal</strong> solid waste composition analysis study – <strong>Juba</strong>, South Sudan 24
type includes milk jugs, water jugs, detergent bottles, some hair-care bottles, emptymotor oil, empty antifreeze, and other empty vehicle and equipment fluid containers.19. "Film Plastic" means flexible plastic sheeting. It is made from a variety of plasticresins including high-density polyethylene (HDPE) and low-density polyethylene(LDPE). It can be easily contoured around an object by hand pressure. This type includesplastic garbage bags, agricultural film, food bags, dry cleaning bags, grocery store bags,packaging wrap, and food wrap. This type does not include rigid bubble packaging.20. "Other Plastic Items" means plastic items not mentioned above. This includescontainers made of types of plastic other than HDPE (high-density polyethylene) orPETE (polyethylene terephthelate). Items may be made of PVC (polyvinyl chloride),LDPE (low-density polyethylene), PP (polypropylene), PS (polystyrene), or mixed resins.When marked for identification, these items may bear the number "3", "4", "5", "6", or"7" in the triangular recycling symbol. This type includes food containers such as bottlesfor salad dressings and vegetable oils, flexible and brittle yogurt cups, syrup bottles,margarine tubs and microwave food trays. This type also includes some shampoocontainers and vitamin bottles, plastic outdoor furniture, plastic toys and sporting goods,and plastic housewares, such as mop buckets, dishes, cups, and cutlery. It also includesbuilding materials such as house siding, window sashes and frames, housings forelectronics such as computers, televisions and stereos, and plastic pipes and fittings.TEXTILES21. "Textiles" means items made of thread, yarn, fabric, or cloth. This type includesclothes, fabric trimmings, draperies, carpets, carpet padding and all natural and syntheticcloth fibers. This type does not include cloth-covered furniture, mattresses, leather shoes,leather bags, or leather belts.ORGANICS22. "Food <strong>Waste</strong>" means food material resulting from the processing, storage,preparation, cooking, handling, or consumption of food. This type includes material fromindustrial, commercial, or residential sources. This type includes discarded meat scraps,dairy products, eggshells, fruit or vegetable peels, and other food items from homes,stores, and restaurants. This type includes processed residues or material from canneries,distilleries, breweries, or other industrial sources.23. "Garden <strong>Waste</strong>" means non-food organic materials resulting from propertylandscaping and maintenance. This type includes leaves, trees, grass cuttings.24. "Agricultural <strong>Waste</strong>" means food organic materials resulting from agriculturalharvesting and vegetable. This type includes pruning, shrubs, branches, stumps, treetrunks.25. "Abattoir waste" means non-food organic materials resulting from property<strong>Municipal</strong> solid waste composition analysis study – <strong>Juba</strong>, South Sudan 25
maintenance and construction activity. This type includes branches, stumps, and treetrunks.26."Remainder/Composite Organic" means organic material that cannot be put in any ofthe above categories. This includes items made mostly of organic materials, butcombined with other material types. This type includes leather items, cork, hemp rope,garden hoses, rubber items, hair, cigarette butts, diapers, feminine hygiene products,small wood products (such as Popsicle sticks and tooth picks), agricultural manures andanimal feces.CONSTRUCTION AND DEMOLITION (C & D) MATERIALS27."Concrete " means a hard material made from sand, aggregate gravel, cement mix andwater as well as masonry bricks and mortar. This type includes pieces of buildingfoundations, concrete paving, concrete blocks and clay bricks.28."Lumber" means processed wood for building, manufacturing, landscaping,packaging, and processed wood from demolition. This type includes dimensional lumber,lumber cutoffs, engineered wood such as plywood and particleboard, wood scraps,pallets, wood fencing, wood shake roofing, and wood siding.29. "Remainder/Composite Construction and Demolition" means construction anddemolition material that cannot be put into any of the above categories. This type mayinclude items from different categories combined, which would be very difficult toseparate. This type includes ceramics, tiles, toilets, sinks, and fiberglass insulation, rock,stones, and sand, clay, soil and other fines. This type may also include demolition debristhat is a mixture of items such as plate glass, wood, tiles, gypsum board, and aluminumscrap, shingles and other roofing material.SPECIAL CARE WASTES30. "Paint" means containers with paint in them. Examples: This type includes latexpaint, oil-based paint, and tubes of pigment or fine art paint. This type does not includedried paint, empty paint cans, or empty aerosol containers.31. "Hazardous Materials" means containerized liquids, solids and gases that arepotentially hazardous to human health or the environment. This type includes acids,bases, oxidizers and flammable materials used in domestic and industrial applications.This type includes aerosol cleaners and lubricants, drain cleaner, paint solvent, antifreeze,brake fluid and pressurized propane cylinders.32."Biomedical" means waste materials specifically associated with hospital and healthcare services and requiring specialized management. This type includes syringes, labglass, heavily soiled dressings, tissue samples and pharmaceutical wastes. This type doesnot include nonhazardous health-care facility wastes generated through food preparation,building maintenance and administrative functions.<strong>Municipal</strong> solid waste composition analysis study – <strong>Juba</strong>, South Sudan 26
33. "Batteries" means any battery. This includes lead acid batteries, dry cell batteries, etc.from all sources.34. "Oil Filters" means oil filters from automobiles.35. "Remainder/composite Special Care <strong>Waste</strong>" ” means material that cannot be put inany other type in the above categories.OTHER WASTES36. “<strong>Waste</strong> Electrical Products” – includes cables, wires, switches, computer appliancesetc.37. "Tyres" means vehicle tires. This type includes tires from trucks, automobiles,motorcycles, heavy equipment, and bicycles.38. "Furniture" means includes household and office furnishings not defined separately.This type includes all sizes and types of furniture, including mattresses, box springs,tables and chairs.39. “Ceramics” – includes domestics utensils such as cups, saucers, plates etc. …40. "Other” means material that cannot be put in any of the categories listed above. Thiscategory includes mixed residue that cannot be further sorted.<strong>Municipal</strong> solid waste composition analysis study – <strong>Juba</strong>, South Sudan 27
ATTACHMENT 3Results of <strong>Waste</strong> Characterisation Exercise<strong>Municipal</strong> solid waste composition analysis study – <strong>Juba</strong>, South Sudan 28
<strong>Municipal</strong> solid waste composition analysis study – <strong>Juba</strong>, South Sudan 29
More technical information available at:http://www.unep.org/SouthSudan/or: postconflict@unep.org