GIS-Integrated Agent-Based Model of Residential Solar PV Diffusion
GIS-Integrated Agent-Based Model of Residential Solar PV Diffusion
GIS-Integrated Agent-Based Model of Residential Solar PV Diffusion
- No tags were found...

You also want an ePaper? Increase the reach of your titles
YUMPU automatically turns print PDFs into web optimized ePapers that Google loves.
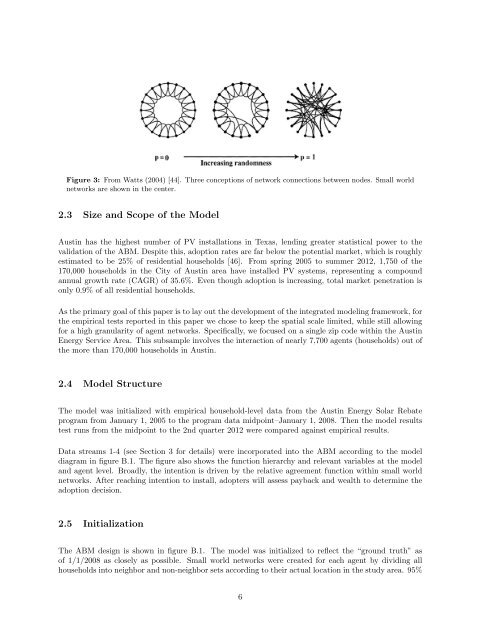
Figure 3: From Watts (2004) [44]. Three conceptions <strong>of</strong> network connections between nodes. Small worldnetworks are shown in the center.2.3 Size and Scope <strong>of</strong> the <strong>Model</strong>Austin has the highest number <strong>of</strong> <strong>PV</strong> installations in Texas, lending greater statistical power to thevalidation <strong>of</strong> the ABM. Despite this, adoption rates are far below the potential market, which is roughlyestimated to be 25% <strong>of</strong> residential households [46]. From spring 2005 to summer 2012, 1,750 <strong>of</strong> the170,000 households in the City <strong>of</strong> Austin area have installed <strong>PV</strong> systems, representing a compoundannual growth rate (CAGR) <strong>of</strong> 35.6%. Even though adoption is increasing, total market penetration isonly 0.9% <strong>of</strong> all residential households.As the primary goal <strong>of</strong> this paper is to lay out the development <strong>of</strong> the integrated modeling framework, forthe empirical tests reported in this paper we chose to keep the spatial scale limited, while still allowingfor a high granularity <strong>of</strong> agent networks. Specifically, we focused on a single zip code within the AustinEnergy Service Area. This subsample involves the interaction <strong>of</strong> nearly 7,700 agents (households) out <strong>of</strong>the more than 170,000 households in Austin.2.4 <strong>Model</strong> StructureThe model was initialized with empirical household-level data from the Austin Energy <strong>Solar</strong> Rebateprogram from January 1, 2005 to the program data midpoint–January 1, 2008. Then the model resultstest runs from the midpoint to the 2nd quarter 2012 were compared against empirical results.Data streams 1-4 (see Section 3 for details) were incorporated into the ABM according to the modeldiagram in figure B.1. The figure also shows the function hierarchy and relevant variables at the modeland agent level. Broadly, the intention is driven by the relative agreement function within small worldnetworks. After reaching intention to install, adopters will assess payback and wealth to determine theadoption decision.2.5 InitializationThe ABM design is shown in figure B.1. The model was initialized to reflect the “ground truth” as<strong>of</strong> 1/1/2008 as closely as possible. Small world networks were created for each agent by dividing allhouseholds into neighbor and non-neighbor sets according to their actual location in the study area. 95%6