32‣ Settlement DensityNatural features determine settlement densities in <strong>Port</strong> <strong>St</strong>. John‟s. Owing to this, mixeddensities are found throughout the area. In some areas which are developable, densitiesare very high. These areas have the following characteristics:More than 20 residential units per hectares (Average)Residential site sizes of less than 400m² (normally 300m²)These are found in low income areas, informal settlements and other un<strong>plan</strong>ned settlementsSpecific reference is made to Mtumbane and the informal settlementsDue to the rural character, topography and natural vegetation in the area, high-density residential areas arenot prevalent. Low-density residential settlements are found, i.e. Rural Villages, <strong>Port</strong> <strong>St</strong>. John‟s town,Second beach. Residential sites are in access of 400m². In rural villages, they even go as much as 1500m²2.1.5 ResidentialThe residential component occupies 0,28% of the land within <strong>Port</strong> <strong>St</strong>. John‟s Municipality. Mostresidential developments are found in the rural areas (villages). Topography and other naturalfeatures are the major limitation in the development of residential areas.2.2 Socio-Economic AnalysisSocio-economic data for the <strong>Port</strong> <strong>St</strong>. John‟s region is derived from the 1996 Census figures andthe demarcation board. A single source of data (Census 1996) is used for the study area to ensureconsistency and a uniform base of comparison. It should be noted that large discrepancies existbetween the latest central statistical services (Census 1996) data and other sources of statisticsavailable. The data reflected in this report should be updated with 2001 Census data whenavailable.2.2.1 PopulationTable 2 depicts the population in each individual ward.Table 2: Population in each WardWard 1 2 3 4 5 6 7 8 9 10 11 12 13Population 7,1 6,9 4,1 9,2 9,1 8,3 7,3 10,3 6,1 5,1 4,5 11,3 10,5The urban area (Ward 3) has got the lowest population (4,1). The biggest population is found inWard 12.According to Pimss. Idea, 2001, <strong>Port</strong> <strong>St</strong>. John‟s comprises of 141 356 people. Most people arelocated in rural areas<strong>Port</strong> <strong>St</strong>. John‟s Integrated <strong>Development</strong> PlanChapter 2: Analysis
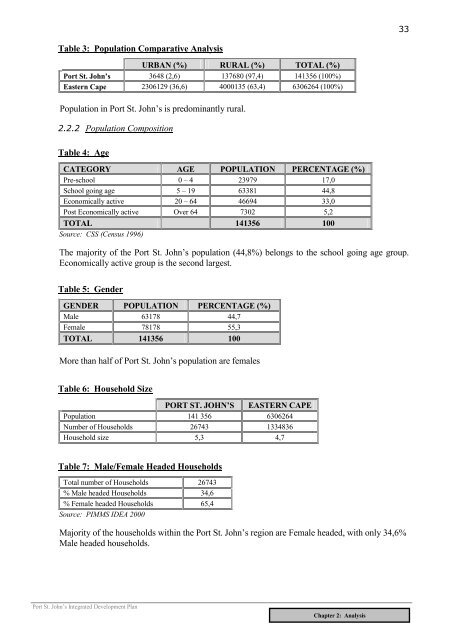
33Table 3: Population Comparative AnalysisURBAN (%) RURAL (%) TOTAL (%)<strong>Port</strong> <strong>St</strong>. John’s 3648 (2,6) 137680 (97,4) 141356 (100%)Eastern Cape 2306129 (36,6) 4000135 (63,4) 6306264 (100%)Population in <strong>Port</strong> <strong>St</strong>. John‟s is predominantly rural.2.2.2 Population CompositionTable 4: AgeCATEGORY AGE POPULATION PERCENTAGE (%)Pre-school 0 – 4 23979 17,0School going age 5 – 19 63381 44,8Economically active 20 – 64 46694 33,0Post Economically active Over 64 7302 5,2TOTAL 141356 100Source: CSS (Census 1996)The majority of the <strong>Port</strong> <strong>St</strong>. John‟s population (44,8%) belongs to the school going age group.Economically active group is the second largest.Table 5: GenderGENDER POPULATION PERCENTAGE (%)Male 63178 44,7Female 78178 55,3TOTAL 141356 100More than half of <strong>Port</strong> <strong>St</strong>. John‟s population are femalesTable 6: Household SizePORT ST. JOHN’S EASTERN CAPEPopulation 141 356 6306264Number of Households 26743 1334836Household size 5,3 4,7Table 7: Male/Female Headed HouseholdsTotal number of Households 26743% Male headed Households 34,6% Female headed Households 65,4Source: PIMMS IDEA 2000Majority of the households within the <strong>Port</strong> <strong>St</strong>. John‟s region are Female headed, with only 34,6%Male headed households.<strong>Port</strong> <strong>St</strong>. John‟s Integrated <strong>Development</strong> PlanChapter 2: Analysis