342.2.3 Population Growth TrendsEstimated population growth trends for the country are derived from IDEA 2000 (Information on<strong>Development</strong> and Economic Activity) released by the Department of Housing and the CSIR. Thestudy on short and longer term growth trends was commissioned by the Department of WaterAffairs and Forestry (1999), taking into account a number of factors, i.e. historical growth trends,urbanisation, immigration HIV/AIDS and existing population. These figures must be seen asestimates.Table 8: Short Term Population Growth (1996 to 2000)MAGISTERIAL DISTRICTPOPULATION1996 ANNUAL GROWTH RATE (%) 2000<strong>Port</strong> <strong>St</strong>. John‟s 68137 1,6 72632Eastern Cape 6306264 1,6 6709641Source: IDEA 2000Table 9: Long Term Population Growth (1996 to 2025)MAGISTERIAL DISTRICTPOPULATION1996 ANNUAL GROWTH RATE (%) 2025<strong>Port</strong> <strong>St</strong>. John‟s 68137 -0,37 61420Eastern Cape 6306264 -0,1 6139659Given the estimates in Table 8 and Table 9 and adopting a high growth scenario, the followingassumptions are made.MAGISTERIAL POPULATION GROWTH RATE POPULATION GROWTH RATE POPULATIONDISTRICT 19961996 – 200020001996 – 20252025<strong>Port</strong> <strong>St</strong>. John’s 68137 1,61 72632 -0,37 61 420Between Year 1996 and 2000 there has been positive population growth of approximately 1,6 %annually. A negative population growth of –0,37 is however predicted over 30 years from 1996 -2025. This is due to factors such as HIV/AIDS epidemic and out migration.2.2.4 Employment, Occupation and IncomeTable 10: EmploymentFORMALINFORMAL EMPLOYMENTMAGISTERIAL DISTRICTEMPLOYMENTUNEMPLOYMENT1990 2000 1990 2000 1990 2000<strong>Port</strong> <strong>St</strong>. John‟s 4,9 4,9 29,6 14,6 65,4 80,5Eastern Cape 6,9 8,7 52,5 36,8 40,6 54,5R.S.A. 7,2 9,6 65,4 50,2 27,4 40,1Source: PIMMS IDEA 2000For the period between 1990 and 2000 there has been a decrease in the number of peopleemployed in the formal sector. However, employment in the informal sector increased. Thedecrease in the number of people employed in formal sector led to an increase in unemploymentrate.<strong>Port</strong> <strong>St</strong>. John‟s Integrated <strong>Development</strong> PlanChapter 2: Analysis
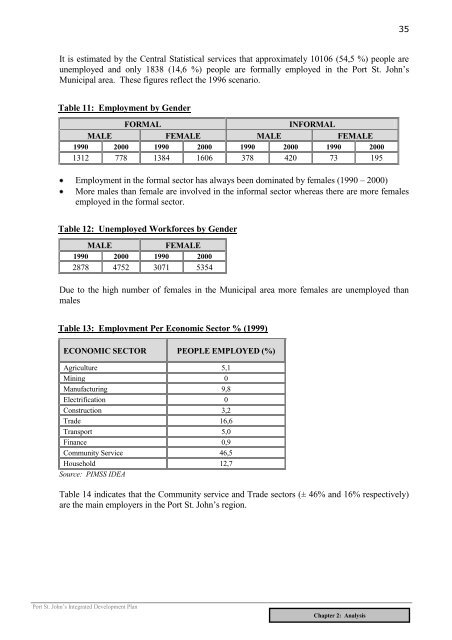
35It is estimated by the Central <strong>St</strong>atistical services that approximately 10106 (54,5 %) people areunemployed and only 1838 (14,6 %) people are formally employed in the <strong>Port</strong> <strong>St</strong>. John‟sMunicipal area. These figures reflect the 1996 scenario.Table 11: Employment by GenderFORMALINFORMA<strong>LM</strong>ALE FEMALE MALE FEMALE1990 2000 1990 2000 1990 2000 1990 20001312 778 1384 1606 378 420 73 195Employment in the formal sector has always been dominated by females (1990 – 2000)More males than female are involved in the informal sector whereas there are more femalesemployed in the formal sector.Table 12: Unemployed Workforces by GenderMALEFEMALE1990 2000 1990 20002878 4752 3071 5354Due to the high number of females in the Municipal area more females are unemployed thanmalesTable 13: Employment Per Economic Sector % (1999)ECONOMIC SECTOR PEOPLE EMPLOYED (%)Agriculture 5,1Mining 0Manufacturing 9,8Electrification 0Construction 3,2Trade 16,6Transport 5,0Finance 0,9Community Service 46,5Household 12,7Source: PIMSS IDEATable 14 indicates that the Community service and Trade sectors (± 46% and 16% respectively)are the main employers in the <strong>Port</strong> <strong>St</strong>. John‟s region.<strong>Port</strong> <strong>St</strong>. John‟s Integrated <strong>Development</strong> PlanChapter 2: Analysis