Resting Stages and the Population Dynamics of Harmful Algae in ...
Resting Stages and the Population Dynamics of Harmful Algae in ...
Resting Stages and the Population Dynamics of Harmful Algae in ...
- No tags were found...

Create successful ePaper yourself
Turn your PDF publications into a flip-book with our unique Google optimized e-Paper software.
<strong>Rest<strong>in</strong>g</strong> <strong>Stages</strong> <strong>and</strong> <strong>the</strong> <strong>Population</strong><strong>Dynamics</strong> <strong>of</strong> <strong>Harmful</strong> <strong>Algae</strong> <strong>in</strong> BatchCultures <strong>and</strong> ChemostatsWilber Ventura, Tyler R<strong>and</strong>olphJayce Rodriguez, Alicia Prieto LangaricaBetty Scarbrough, Hristo KojouharovJames GroverTechnical Report 2011-19http://www.uta.edu/math/prepr<strong>in</strong>t/
<strong>Rest<strong>in</strong>g</strong> <strong>Stages</strong> <strong>and</strong> <strong>the</strong> <strong>Population</strong> <strong>Dynamics</strong> <strong>of</strong><strong>Harmful</strong> <strong>Algae</strong> <strong>in</strong> Batch Cultures <strong>and</strong> Chemostats ∗Wilber Ventura † Tyler R<strong>and</strong>olph † Jayce Rodriguez ‡Alicia Prieto Langarica † Betty Scarbrough ‡Hristo Kojouharov † James Grover ‡September 7, 2011AbstractThe unicellular species Prymnesium parvum, known as golden algae,releases potenttox<strong>in</strong>s<strong>in</strong>toitsenvironment,whichcangreatlyupsetaquaticpopulation dynamics. P. parvum are understood to have a motile statewhich produces tox<strong>in</strong> <strong>and</strong> a much less metabolically active state whichdoes not produce much tox<strong>in</strong>, which may be a cyst. Our research attemptsto provide a ma<strong>the</strong>matical model for <strong>the</strong> conversion between <strong>the</strong>motile <strong>and</strong> non-motile states <strong>of</strong> P. parvum, <strong>in</strong> two different cultures. Inour model, population growth is a saturat<strong>in</strong>g function <strong>of</strong> nutrient concentration.For both <strong>the</strong> batch <strong>and</strong> chemostat cultures, we used systems <strong>of</strong>differential equations to fur<strong>the</strong>r underst<strong>and</strong> <strong>the</strong> population dynamics <strong>of</strong>P. parvum. Specifically, we observed <strong>the</strong> steady states <strong>of</strong> both cell populations(motile <strong>and</strong> non-motile) <strong>and</strong> <strong>the</strong> stability <strong>of</strong> those equilibria toshow how conversion rates <strong>in</strong>fluence overall population dynamics.1 IntroductionPrymnesium parvum are flagellates that are ovoid <strong>in</strong> shape (Green et al., 1982).They havealsobeen observedasamixotrophicspecies, both photosyn<strong>the</strong>tic<strong>and</strong>heterotrophic (Tillman, 2003). P. parvum are euryhal<strong>in</strong>e <strong>and</strong> eu<strong>the</strong>rmic, <strong>the</strong>reforetolerant <strong>of</strong> a wide range <strong>of</strong> temperatures <strong>and</strong> sal<strong>in</strong>ity (Larsen <strong>and</strong> Bryant1998). Certa<strong>in</strong> environmental conditions <strong>and</strong> <strong>the</strong>ir effect on bloom dynamicshave also been studied. Results <strong>of</strong> previous research have provided <strong>the</strong> optimalgrowth conditions <strong>in</strong> lab media <strong>and</strong> established parameters for our research∗ This research was supported by an NSF UBM-Institutional grant DUE#0827136 as part<strong>of</strong> <strong>the</strong> UTTER Program at UT Arl<strong>in</strong>gton (http://www.uta.edu/math/utter/).† Department <strong>of</strong> Ma<strong>the</strong>matics, The University <strong>of</strong> Texas at Arl<strong>in</strong>gton, P.O. Box 19408,Arl<strong>in</strong>gton, TX 76019-0408‡ Department <strong>of</strong> Biology, The University <strong>of</strong> Texas at Arl<strong>in</strong>gton, P.O. Box 19498, Arl<strong>in</strong>gton,TX 76019-04981
(Baker et al., 2007). It was discoveredthat P. parvum have <strong>the</strong> ability to deploya poison that paralyzes prey, prevents graz<strong>in</strong>g, <strong>and</strong> reduces competition especiallydur<strong>in</strong>g nutrient limited environments (Tillman, 2003; Roelke et al., 2007;Graneli et al., 2008; Brooks et al., 2010). This poison was found to be not one,but multiple poisons that are released simultaneously whose chemical structureshave yet to be clearly def<strong>in</strong>ed (Igarashi et al., 1999). These tox<strong>in</strong>s can have verypotent effects on non-planktonic species, especially fish, caus<strong>in</strong>g massive fishkills number<strong>in</strong>g over 30 million <strong>in</strong> total (Southard et al., 2010). Toxic eventsdur<strong>in</strong>g w<strong>in</strong>ter may be especially severe s<strong>in</strong>ce temperature <strong>and</strong> sal<strong>in</strong>ity are farfrom optimal for P. parvum, which appears to enhance its toxicity (Baker etal. 2007, 2009). P. parvum have also shown that, dur<strong>in</strong>g certa<strong>in</strong> stressful conditions,it can assume a markedly reduced metabolic state. In this paper thisstate is referred to as <strong>the</strong> non-motile state, which may possibly be a cyst formation(Green et al., 1982). Therefore, for analytical purposes, we assume thatthis non-motile state has negligible rates <strong>of</strong> reproduction, nutrient consumption,tox<strong>in</strong> release, <strong>and</strong> mean<strong>in</strong>gful movement compared to those <strong>of</strong> <strong>the</strong> active, motilestate. Thus, a better underst<strong>and</strong><strong>in</strong>g <strong>of</strong> this non-motile state may shed light onharmful algal bloom cycles <strong>and</strong> environment-dependent tox<strong>in</strong> release <strong>of</strong> <strong>the</strong> P.parvum algae.It has been established that <strong>the</strong> success <strong>of</strong> a newly <strong>in</strong>troduced organismdepends on its ability to reproduce successfully. S<strong>in</strong>ce environmental factorsplay a large role <strong>in</strong> P. parvum bloom dynamics, our study attempts to modelcerta<strong>in</strong> environments to observe motile <strong>and</strong> non-motile cell transitions. The twoenvironments used for <strong>the</strong> model are batch <strong>and</strong> chemostat cultures. The batchculture allows an organism to be isolated <strong>in</strong> a controlled environment with alimited source <strong>of</strong> a specific nutrient. S<strong>in</strong>ce <strong>the</strong> batch is a closed system, neworganisms <strong>and</strong> nutrient cannot be added. The chemostat model was establishedto show <strong>the</strong> rate <strong>of</strong> successful multiplication <strong>of</strong> a newly <strong>in</strong>troduced organism<strong>in</strong> an open system (Powell, 1965). Fur<strong>the</strong>r, this chemostat model <strong>in</strong>cludes adilution <strong>of</strong> a vessel <strong>in</strong> which both cell <strong>and</strong> nutrient populations are <strong>in</strong>troduced<strong>and</strong> evacuated <strong>in</strong> equal amounts (Monod, 1950; Johansson <strong>and</strong> Graneli, 1999).We have proposed a <strong>the</strong>oretical model that can demonstrate <strong>the</strong> impact <strong>of</strong> cellconversion rates on population dynamics.2 Batch Culture ModelThe batchculture model uses<strong>the</strong> variables<strong>and</strong> parameterslisted <strong>in</strong> Table1. Werepresent <strong>the</strong> population dynamics by <strong>the</strong> follow<strong>in</strong>g three differential equations:2
Table 1: NotationVariables Mean<strong>in</strong>g UnitsM Motile algae cells/mLN Non-motile algae cells/mLR Nutrient concentration µmol/LParameters Mean<strong>in</strong>gUnitsK Half-saturation constant for algal growth µmol/Lµ max maximal growth rate <strong>of</strong> motile algae day −1δ Rate <strong>of</strong> conversion from motile to non-motile day −1γ Rate <strong>of</strong> conversion from non-motile to motile day −1q Nutrient quota <strong>of</strong> algae µmol/cellR <strong>in</strong> Nutrient supply µmol/LdMdt= µ maxRMK +R−δM +γN,dNdtdRdt= δM −γN,= − µ maxRMK +R q. (1)Each differential equation represents <strong>the</strong> factors we assume to impact <strong>the</strong>change <strong>in</strong> populations <strong>and</strong> toxicity. We assume that only motile algae (M) cantake up <strong>the</strong> nutrient (R) <strong>and</strong> reproduce; <strong>the</strong>refore <strong>the</strong>re exists a relationshipbetween <strong>the</strong> growth <strong>of</strong> <strong>the</strong> motile population <strong>and</strong> <strong>the</strong> nutrient. It has been wellestablished that <strong>the</strong> growth<strong>of</strong> <strong>the</strong> algae is limited by <strong>the</strong> nutrient concentration,<strong>and</strong> <strong>the</strong> Monod function,µ max RMK +R ,has repeatedly been used to represent <strong>the</strong> <strong>in</strong>teraction between <strong>the</strong> tak<strong>in</strong>g up <strong>of</strong>nutrient <strong>and</strong> <strong>the</strong> growth <strong>of</strong> P. parvum [3]. In our model µ max (day −1 ) is <strong>the</strong>maximal growth rate <strong>of</strong> <strong>the</strong> motile algae <strong>and</strong> K (µmol/L) is <strong>the</strong> half saturationconstant. The consumption <strong>of</strong> <strong>the</strong> nutrient represented <strong>in</strong> dR is proportional todt<strong>the</strong> growth rate <strong>of</strong> <strong>the</strong> motile algae <strong>in</strong> dM with coefficient q (µmol/cell), whichdtconverts <strong>the</strong> units from cells to nutrients (µmol). We also assume that motilealgae converts to non-motile algae (N) at a constant rate, δ (day −1 ), <strong>and</strong> thatnon-motile algae converts to motile algae at a constant rate, γ (day −1 ).2.1 Reduction <strong>of</strong> OrderThe system is changed from three differential equations to a much simpler system<strong>of</strong> only two differential equations. T is <strong>the</strong> total nutrients <strong>in</strong> <strong>the</strong> system3
<strong>and</strong> <strong>the</strong>refore it is <strong>the</strong> summation <strong>of</strong> R, Mq, <strong>and</strong> Nq. The units convert bothM <strong>and</strong> N <strong>in</strong>to units <strong>of</strong> nutrients by multiply<strong>in</strong>g by q. Thus<strong>and</strong>T = R+Mq +Nq,dTdt = dRdt + dM dt q + dN dt q.Direct substitution <strong>in</strong> System (1) yields dT = 0, which implies that T is constant.Therefore, us<strong>in</strong>gdtthatR = T −Mq −Nq<strong>the</strong> equation for R can be elim<strong>in</strong>ated <strong>and</strong> System (1) is simplified todMdtdNdt= µ maxM(T −Mq −Nq)K +T −Mq −Nq= δM −γN.−δM +γN,(2)2.2 Equilibrium EvaluationWe set <strong>the</strong> right-h<strong>and</strong> sides <strong>of</strong> all differential equations <strong>in</strong> System (2) equal tozero <strong>and</strong> solve for <strong>the</strong> equilibrium values <strong>of</strong> M <strong>and</strong> N. We obta<strong>in</strong> <strong>the</strong> solutions:E 0 B = (M0 B ,N0 B ) = (0,0)E ∗ B( ) (3)γT= (M∗ B ,N∗ B ) = (δ +γ)q , δT(δ +γ)qAlthough R is not represented <strong>in</strong> <strong>the</strong> system, it is a population <strong>of</strong> <strong>in</strong>terest,with R = R 0 B = T at E0 B , <strong>and</strong> R = R∗ B = 0 at E∗ B .2.3 Equilibrium AnalysisIn <strong>the</strong> batch culture model <strong>the</strong> equilibria are always feasible. This is because<strong>the</strong> equilibria represent populations, which cannot be negative. The Jacobianmatrix evaluated at EB 0 for <strong>the</strong> simple batch culture model is:⎛−δ + Tµ ⎞maxγ⎜J =K +T ⎟⎝ ⎠ . (4)δThe determ<strong>in</strong>ant <strong>of</strong> <strong>the</strong> Jacobian matrix (4) evaluated at E 0 B is −γTµ maxK +T .The outcome <strong>of</strong> <strong>the</strong> determ<strong>in</strong>ant alone, because it is negative, implies that E 0 Bis unstable.−γE 0 B4
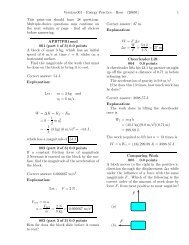
76Batchmotil cells (M)non−motil cells (N)nutrients (R)<strong>Population</strong> densities5432100 50 100 150 200 250 300Time (t)Figure 1: Batch culture: stable non-trivial equilibrium E ∗ B .The Jacobian matrix evaluated at EB ∗ for <strong>the</strong> simple batch culture model is:⎛−δ − γTµ max(δ +γ)K γ − γTµ ⎞max(δ +γ)KJ =⎜⎝δ−γ⎟⎠E ∗ B. (5)The determ<strong>in</strong>ant for <strong>the</strong> Jacobian matrix (5) is γTµ max, <strong>and</strong> <strong>the</strong> trace is −δ−KγTµ max− γ. Thus <strong>the</strong> determ<strong>in</strong>ant is positive <strong>and</strong> <strong>the</strong> trace is negative.(δ +γ)KTherefore <strong>the</strong> equilibrium is stable. Figure 1 shows that EB 0 is an unstableequilibrium <strong>and</strong> that EB ∗ is a stable equilibrium.3 Chemostat Culture ModelThe same dynamics from <strong>the</strong> batch culture model are at work <strong>in</strong> <strong>the</strong> chemostatsett<strong>in</strong>g. The only difference <strong>in</strong> <strong>the</strong> models is <strong>the</strong> <strong>in</strong>flows <strong>and</strong> outflows <strong>of</strong> <strong>the</strong>system. The rate <strong>of</strong> <strong>the</strong> dilution D, represents <strong>the</strong> <strong>in</strong>flows <strong>and</strong> outflows <strong>of</strong> <strong>the</strong>system. In <strong>the</strong> <strong>in</strong>flow only nutrients come <strong>in</strong>to <strong>the</strong> system thus we <strong>in</strong>clude apositive term DR <strong>in</strong> <strong>in</strong> dR . We assume that populations <strong>and</strong> nutrients are welldtmixed so that <strong>the</strong> outflow <strong>of</strong> each population is accord<strong>in</strong>g to its density <strong>in</strong> <strong>the</strong>system. From <strong>the</strong> biological assumptions mentioned we develop <strong>the</strong> system5
dMdt= µ maxRMK +R−DM −δM +γN,dNdtdRdt= δM −γN −DN,= D(R <strong>in</strong> −R)− µ maxRMqK +R . (6)3.1 Reduction <strong>of</strong> OrderWe obta<strong>in</strong> a reduction <strong>of</strong> order <strong>of</strong> <strong>the</strong> system, evaluated as time goes towards<strong>in</strong>f<strong>in</strong>ity. Simplification <strong>of</strong> <strong>the</strong> model, by reduc<strong>in</strong>g <strong>the</strong> system <strong>of</strong> three differentialequations to a system <strong>of</strong> two differential equations, helps ease <strong>the</strong> stabilityanalysis.As <strong>in</strong> <strong>the</strong> batch model, we first def<strong>in</strong>e T as <strong>the</strong> total nutrients<strong>and</strong> <strong>the</strong>refore <strong>the</strong> rate <strong>of</strong> change <strong>of</strong> T isT = R+Mq +Nq,dTdt = dRdt + dM dt q + dN dt q.By direct substitution from System (6) we obta<strong>in</strong>:dTdt = D(R <strong>in</strong> −T).After solv<strong>in</strong>g <strong>the</strong> above differential equation we obta<strong>in</strong> T as a function <strong>of</strong> time:T(t) = (T(0)−R <strong>in</strong> )e −Dt +R <strong>in</strong> . (7)As t goes to <strong>in</strong>f<strong>in</strong>ity, <strong>in</strong> Equation (7), T approaches <strong>the</strong> nutrient supply concentrationR <strong>in</strong> . This implies that as t approaches <strong>in</strong>f<strong>in</strong>ityR <strong>in</strong> = R+Mq +Nq.We <strong>the</strong>n elim<strong>in</strong>ate <strong>the</strong> equation for R <strong>and</strong> replace R with its asymptotic valueR <strong>in</strong> −Mq −Nq. Thus System (6) is simplified todMdtdNdt= µ maxM(R <strong>in</strong> −Mq −Nq)K +R <strong>in</strong> −Mq −Nq= −DN +δM −γN.−δM +γN −DM,(8)6
3.2 Equilibrium EvaluationTo determ<strong>in</strong>e <strong>the</strong> equilibria <strong>of</strong> System (8) we set both dM dtzero <strong>and</strong> solve for M <strong>and</strong> N. Our solutions are:<strong>and</strong> dN dtequal toEc 0 = (M0 c ,N0 c ) = (0,0), (9)⎧⎪ M ⎨c ∗ = (D(D +δ +γ)(K +R <strong>in</strong>)(D +γ))−((D +γ) 2 R <strong>in</strong> µ max ))(D +δ +γ)q(D(D +δ +γ)−(µ max (D +γ)))Ec ∗ = ⎪ ⎩N ∗ c = δ(D(D +δ +γ)(K +R <strong>in</strong>)−((D +γ)R <strong>in</strong> µ max ))(D+δ +γ)q(D(D +δ +γ)−(µ max (D +γ)))3.3 Equilibrium Analysis.(10)The equilibria representpopulation sizes thus <strong>the</strong>y must be non-negativevalues.Ec 0 is always feasible because M0 c = 0 <strong>and</strong> ( N0 c = 0. ) Some algebra is needed toδf<strong>in</strong>d conditions for feasibility <strong>of</strong> Ec. ∗ Nc ∗ = Mc ∗ thus if Nc ∗ is positiveD +γM ∗ c must be positive becauseδD +γ is positive. If N∗ c is negative M ∗ c must benegativeas well. Thus if N ∗ c is feasible <strong>the</strong>n M ∗ c must also be feasible. Thereforewe will only need to prove that N ∗ c is feasible by prov<strong>in</strong>g that it is positive. N∗ cis expressed as a fraction; <strong>the</strong>refore N ∗ c is feasible if <strong>the</strong> numerator:<strong>and</strong> <strong>the</strong> denom<strong>in</strong>ator:δ(D(D +δ +γ)(K +R <strong>in</strong> )−((D +γ)R <strong>in</strong> µ max ))(D +δ +γ)q(D(D +δ +γ)−(µ max (D +γ)))arebothpositive(Case1)orbothnegative(Case2). If<strong>in</strong>anycase<strong>the</strong>numerator<strong>and</strong> denom<strong>in</strong>ator are not both positive or both negative <strong>the</strong>n Ec ∗ is not feasible.The two cases <strong>of</strong> feasibility have <strong>the</strong> follow<strong>in</strong>g conditions.(C1) The first condition for Case 1 is a positive numerator. Thuswhich impliesD(D +δ +γ)(K +R <strong>in</strong> ) > (D+γ)R <strong>in</strong> µ max ,D(D +δ +γ)D+γ> R <strong>in</strong>µ maxK +R <strong>in</strong>. (11)7
The second condition for Case 1 is to have a positive denom<strong>in</strong>ator. Thuswhich impliesD(D +δ +γ) > (D +γ)µ max ,D(D +δ +γ)(D +γ)> µ max . (12)Condition (12) implies Condition (11). Therefore if Condition (12) is met <strong>the</strong>nCase 1 <strong>of</strong> feasability is obta<strong>in</strong>ed.(C2) The first condition for Case 2 is to have a negative numerator. Thuswhich impliesD(D +δ +γ)(K +R <strong>in</strong> ) < (D+γ)R <strong>in</strong> µ max ,D(D +δ +γ)D+γ< R <strong>in</strong>µ maxK +R <strong>in</strong>. (13)The second condition for Case 2 is to have a negative denom<strong>in</strong>ator. Thuswhich impliesD(D +δ +γ) < (D +γ)µ max ,D(D +δ +γ)(D +γ)< µ max . (14)Condition (14) is implied by Condition (13). Therefore if Condition (13) is metCase 2 <strong>of</strong> feasability is obta<strong>in</strong>ed. In both cases Nc ∗ is postive, thus <strong>in</strong> both casesEc ∗ is feasible.In order to analyze <strong>the</strong> stability <strong>of</strong> <strong>the</strong> equilibria <strong>in</strong> System (8) we letrhs 1rhs 2= µ maxM(R <strong>in</strong> −Mq −Nq)K +R <strong>in</strong> −Mq −Nq= −DN +δM −γN.−δM +γN −DM,(15)We <strong>the</strong>n obta<strong>in</strong> <strong>the</strong> partial derivatives, <strong>of</strong> Equations (15), with respect to M<strong>and</strong> N:8
∂rhs 1∂M= µ max(R <strong>in</strong> −2Mq−Nq)K +R <strong>in</strong> −Mq −Nq+ qµ maxM(R <strong>in</strong> −Mq −Nq)(K +R <strong>in</strong> −Mq −Nq) 2 −D −δ,∂rhs 1∂N=µ max MqK +R <strong>in</strong> −Mq −Nq + qµ maxM(R <strong>in</strong> −Mq −Nq)(K +R <strong>in</strong> −Mq −Nq) 2 +γ,∂rhs 2∂M = δ,∂rhs 2∂N= −D −γ.After sett<strong>in</strong>g <strong>the</strong> Jacobian matrix⎛∂rhs 1∂MJ = ⎜⎝ ∂rhs 2∂M∂rhs 1∂N∂rhs 2∂N⎞⎟⎠(16)(17)we evaluate it at E 0 c <strong>and</strong> E ∗ c. Then we analyze its determ<strong>in</strong>ant <strong>and</strong> trace todeterm<strong>in</strong>e stability <strong>of</strong> <strong>the</strong> equilibria.3.3.1 Stability Analysis - Case 1The Jacobian matrix (17) evaluated at E 0 cJ =⎛⎜⎝−D−δ + R <strong>in</strong>µ maxK +R <strong>in</strong>The determ<strong>in</strong>ant <strong>of</strong> <strong>the</strong> Jacobian matrix (18) isδfor <strong>the</strong> chemostat model isγ−D−γ⎞⎟⎠D 2 +Dδ +Dγ − DR <strong>in</strong>µ maxK +R <strong>in</strong>− γR <strong>in</strong>µ maxK +R <strong>in</strong>.Therefore <strong>the</strong> condition for <strong>the</strong> determ<strong>in</strong>ant to be positive isD 2 +Dδ +Dγ > DR <strong>in</strong>µ maxK +R <strong>in</strong>+ γR <strong>in</strong>µ maxK +R <strong>in</strong>.E 0 c. (18)By do<strong>in</strong>g some algebraic simplifications <strong>and</strong> rearrang<strong>in</strong>g terms <strong>the</strong> condition issimplified toD(D +δ +γ)(D +γ)> R <strong>in</strong>µ maxK +R <strong>in</strong>. (19)9
So if we are <strong>in</strong> Case 1 <strong>of</strong> feasibility <strong>the</strong>n Condition (12) is met which impliesCondition (19) is also met. Therefore <strong>in</strong> Case 1 <strong>the</strong> determ<strong>in</strong>ant <strong>of</strong> <strong>the</strong> Jacobianmatrix (18) must be positive. The trace <strong>of</strong> <strong>the</strong> Jacobian matrix (18) is−2D−δ + R <strong>in</strong>µ maxK +R <strong>in</strong>−γ.Thus <strong>the</strong> condition for <strong>the</strong> trace to be negative is2D+δ +γ > R <strong>in</strong>µ maxK +R <strong>in</strong>. (20)Us<strong>in</strong>g <strong>the</strong> fact thatD(D+δ +γ)2D+δ +γ > ,(D +γ)Condition (11), <strong>and</strong> <strong>the</strong> transitivity property we know that if we are <strong>in</strong> Case1 <strong>the</strong>n Condition (20) has been met. Therefore we can say that <strong>in</strong> Case 1 <strong>of</strong>feasibility <strong>the</strong> trace <strong>of</strong> <strong>the</strong> Jacobian matrix (18) is negative. Fur<strong>the</strong>rmore wecan say that Ec 0 is stable <strong>in</strong> Case 1.The Jacobianmatrix (17) is evaluated at Ec ∗ for <strong>the</strong> chemostat model. Aga<strong>in</strong>we want to f<strong>in</strong>d conditions for a positive determ<strong>in</strong>ant <strong>and</strong> a negative trace. Thecondition for a positive determ<strong>in</strong>ant isD(D +γ) . (23)K +R <strong>in</strong> D+γSo for Case 1 <strong>of</strong> feasibility <strong>the</strong> equilibrium Ec ∗ is unstable, because Condition(11) is directly contradicted by Condition (23), mean<strong>in</strong>g that <strong>the</strong> determ<strong>in</strong>ant isnotpositive <strong>and</strong><strong>the</strong> traceis notnegative. In Case1<strong>of</strong>feasibility <strong>the</strong> equilibriumEc 0 is stable <strong>and</strong> <strong>the</strong> equilibrium E∗ c is unstable. This is shown <strong>in</strong> Figure 2.10
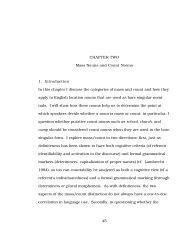
0.250.2Case 1 <strong>of</strong> Chemostatmotil cells (N)non−motil cells (M)nutrients (R)<strong>Population</strong> densities0.150.10.05010 −2 10 0 10 2Time (t)10 4 10 6Figure 2: Chemostat culture (Case 1): stable trivial equilibrium E 0 c .3.3.2 Stability Analysis - Case 2In <strong>the</strong> previous section we established <strong>the</strong> conditions for stability <strong>of</strong> both equilibriaEc 0 <strong>and</strong> Ec. ∗ Us<strong>in</strong>g those same conditions we can determ<strong>in</strong>e <strong>the</strong> stability<strong>of</strong> Ec 0 <strong>and</strong> E∗ c <strong>in</strong> Case 2. Condition (19) for stability <strong>of</strong> E0 c directly contradictsCondition (13), which is needed for feasibilty <strong>in</strong> Case 2. So for Case 2 <strong>of</strong> feasibility<strong>the</strong> equilibrium Ec 0 is unstable. For Case 2 <strong>of</strong> feasibility <strong>the</strong> equilibriumEc ∗ is stable, because Condition (13) implies Condition (23). This is shown <strong>in</strong>Figure 3.4 Discussion <strong>and</strong> ConclusionThe aim <strong>of</strong> this research was to establish a relationship between motile <strong>and</strong>non-motile states. These transitions are characterized as certa<strong>in</strong> rates (γ <strong>and</strong>δ) <strong>in</strong> which one state converts to <strong>the</strong> o<strong>the</strong>r. In addition, our model <strong>in</strong>cluded<strong>the</strong> rate at which P. parvum cells are reproduced. Toge<strong>the</strong>r <strong>the</strong>se rates give abetter underst<strong>and</strong><strong>in</strong>g <strong>of</strong> <strong>the</strong> total cell population. Both batch <strong>and</strong> chemostatma<strong>the</strong>matical models produced mean<strong>in</strong>gful results <strong>and</strong> are discussed below.4.1 Batch CultureThe batch culture model was analyzed <strong>and</strong> gave two equilibrium solutions. Thetrivial equilibrium, which is unstable accord<strong>in</strong>g to our stability analysis, had littlebiological significance because it represents a non-exist<strong>in</strong>g <strong>in</strong>itial population.Hav<strong>in</strong>g a zero <strong>in</strong>itial population is not useful for our research. Our non-trivial11
10.90.8Case 2 <strong>of</strong> Chemostatmotil cells (N)non−motil cells (M)nutrients (R)<strong>Population</strong> densities0.70.60.50.40.30.20.1010 −1 10 0 10 1 10 2 10 3Time (t)10 4 10 5 10 6Figure 3: Chemostat culture (Case 2): stable non-trivial equilibrium E ∗ c .equilibrium did provide biologically mean<strong>in</strong>gful results. Accord<strong>in</strong>g to our stabilityanalysis, if <strong>the</strong>re is an <strong>in</strong>itial cell population, it will approach our non-trivialequilibrium over time. We can see that populations N <strong>and</strong> M monotonicallyapproached EB. ∗ We observed that both cell populations approached equilibriumas nutrient was depleted to near zero values. In a typical batch culture,one would observe a plateau where <strong>the</strong> sample reaches its unique maximumconsumption rate, ma<strong>in</strong>ta<strong>in</strong>s <strong>the</strong> rate, <strong>and</strong> <strong>the</strong>n beg<strong>in</strong>s <strong>the</strong> death phase <strong>of</strong> <strong>the</strong>growth cycle. Because our model does not account for death, it shows only <strong>the</strong>time at which both P. parvum cell populations reach EB.∗The ratio <strong>of</strong> <strong>the</strong>se equilibrium populations gives us an idea as to how <strong>the</strong>algae will react <strong>in</strong> a limited nutrient environment. Adjust<strong>in</strong>g <strong>the</strong> amount <strong>of</strong>total nutrient will only affect <strong>the</strong> total population size <strong>of</strong>equilibrium(MB+N ∗ B).∗BecauseMB∗NB∗ = γ δ ,total nutrient has no effect on <strong>the</strong> M ∗ B <strong>and</strong> N ∗ B proportion. This means thatonly <strong>the</strong> conversion rates, δ <strong>and</strong> γ, govern <strong>the</strong> M <strong>and</strong> Nsteady state populationproportion. Our model demonstrates <strong>the</strong> impact <strong>of</strong> δ <strong>and</strong> γ on populationdynamics despite be<strong>in</strong>g given an elementary constant value. We make thisassumption for simplicity <strong>of</strong> <strong>the</strong> model although it may not represent <strong>the</strong> actualdynamics <strong>of</strong> <strong>the</strong> conversion rates.12
4.2 Chemostat CultureThe chemostat model represents a somewhat novel approach for analysis <strong>of</strong>algal species with transitions to rest<strong>in</strong>g stages. From <strong>the</strong> ma<strong>the</strong>matical modelwe deduced thatMB∗NB∗ = 1 δ D + γ δ .Thus our model suggests that if <strong>the</strong> transition rates are constant, <strong>the</strong>n <strong>the</strong>y canbe calculated by know<strong>in</strong>g <strong>the</strong> steady state population values <strong>and</strong> <strong>the</strong> dilutionrate.References[1] Clodong, S. <strong>and</strong> Blasius, B., 2004.Chaos <strong>in</strong> a periodically forced chemostatwith algal mortality. Proceed<strong>in</strong>gs <strong>of</strong> <strong>the</strong> Royal Society <strong>of</strong> London B 271,1617-1624.[2] Green, J. C., Hibberd, D. J. <strong>and</strong> Pienaar, R. N., 1982. The taxonomy<strong>of</strong> Prymnesium (Prymnesiophyceae) <strong>in</strong>clud<strong>in</strong>g a description <strong>of</strong> a new cosmopolitanspecies, P. patellifera sp. nov., <strong>and</strong> fur<strong>the</strong>r observations on P.parvum (N. Carter). British Phycological Journal 17:4, 363-382.[3] Grover, J.P., Crane, K.W., Baker, J.W., Brooks, B. W., <strong>and</strong> Roelke, D.L., 2011. Spatial variation <strong>of</strong> harmful algae <strong>and</strong> <strong>the</strong>ir tox<strong>in</strong>s <strong>in</strong> flow<strong>in</strong>gwaterhabitats: a <strong>the</strong>oretical exploration. Journal <strong>of</strong> Plankton Research,33, 211-227.[4] Jordan, R.W. <strong>and</strong> Chamberla<strong>in</strong>, A.H.L., 1997. Biodiversity among haptophytealgae. Biodiversity <strong>and</strong> Conservation 6:1, 131-152.[5] Southard, G.M., Fries, L.T. <strong>and</strong> Barkoh, A., 2010. Prymnesium parvum:<strong>the</strong> Texas experience. Journal <strong>of</strong> American Water Resources Association46:1, 14-23.[6] Larsen, A., <strong>and</strong> S. Bryant. 1998. Growth rate <strong>and</strong> toxicity <strong>of</strong> Prymnesiumparvum <strong>and</strong> Prymnesium patelliferum (Haptophyta) <strong>in</strong> response to changes<strong>in</strong> sal<strong>in</strong>ity, light <strong>and</strong> temperature. Sarsia 83: 409-418.[7] Roelke, D. L., R. M. Errera, R. Kiesl<strong>in</strong>g, B. W. Brooks, J. P. Grover, L.Schwierzke, F. Urena-Boeck, J. Baker, <strong>and</strong> J. L. P<strong>in</strong>ckney. 2007. Effects<strong>of</strong> nutrient enrichment on Prymnesium parvum population dynamics <strong>and</strong>toxicity: Results from field experiments, Lake Possum K<strong>in</strong>gdom, USA.Aquatic Microbial Ecology 46: 125-140.[8] Igarashi, T., Satake, M., Yasumoto, T., 1999.Structural <strong>and</strong> partial stereochemicalassignmentsfromprymnes<strong>in</strong>-1<strong>and</strong>prymnes<strong>in</strong>-2:poten<strong>the</strong>molytic<strong>and</strong> ichthyotoxic glycosides isolated from <strong>the</strong> red tide alga Prymnesiumparvum. Journal <strong>of</strong> <strong>the</strong> American Chemical Society 121, 8499-8511.13
[9] Brooks, B.W., James, S.V., Valenti, T.W., Urena-Boeck, F., Serrano, C.,Schwierzke, L., Mydlarz, L.D., Grover, J.P., Roelke, D.L., 2010. Comparativetoxicity <strong>of</strong> Prymnesium parvum <strong>in</strong> <strong>in</strong>l<strong>and</strong> waters. Journal <strong>of</strong> <strong>the</strong> AmericanWater Resources Association 46, 45-62.[10] Tillmann, U., 2003. Kill <strong>and</strong> eat your predator: a w<strong>in</strong>n<strong>in</strong>g strategy <strong>of</strong> <strong>the</strong>planktonic flagellate Prymnesium parvum. Aquatic Microbial Ecology 32,73-84.14