

School-Related Indicators 242-306 Facilities in Schools 307 ... - DISE
School-Related Indicators 242-306 Facilities in Schools 307 ... - DISE
School-Related Indicators 242-306 Facilities in Schools 307 ... - DISE
- No tags were found...

You also want an ePaper? Increase the reach of your titles
YUMPU automatically turns print PDFs into web optimized ePapers that Google loves.
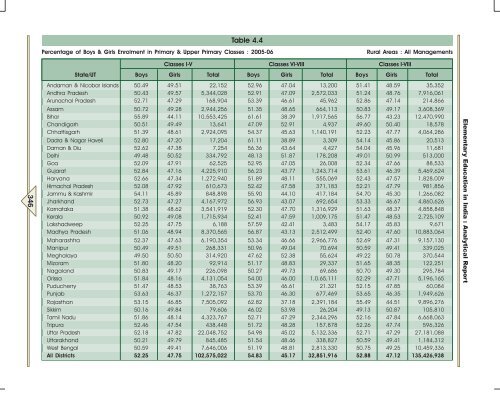
Table 4.4Percentage of Boys & Girls Enrolment <strong>in</strong> Primary & Upper Primary Classes : 2005-06Rural Areas : All ManagementsClasses I-V Classes VI-VIII Classes I-VIIIState/UT Boys Girls Total Boys Girls Total Boys Girls Total346Andaman & Nicobar Islands 50.49 49.51 22,152 52.96 47.04 13,200 51.41 48.59 35,352Andhra Pradesh 50.43 49.57 5,344,028 52.91 47.09 2,572,033 51.24 48.76 7,916,061Arunachal Pradesh 52.71 47.29 168,904 53.39 46.61 45,962 52.86 47.14 214,866Assam 50.72 49.28 2,944,256 51.35 48.65 664,113 50.83 49.17 3,608,369Bihar 55.89 44.11 10,553,425 61.61 38.39 1,917,565 56.77 43.23 12,470,990Chandigarh 50.51 49.49 13,641 47.09 52.91 4,937 49.60 50.40 18,578Chhattisgarh 51.39 48.61 2,924,095 54.37 45.63 1,140,191 52.23 47.77 4,064,286Dadra & Nagar Haveli 52.80 47.20 17,204 61.11 38.89 3,309 54.14 45.86 20,513Daman & Diu 52.62 47.38 7,254 56.36 43.64 4,427 54.04 45.96 11,681Delhi 49.48 50.52 334,792 48.13 51.87 178,208 49.01 50.99 513,000Goa 52.09 47.91 62,525 52.95 47.05 26,008 52.34 47.66 88,533Gujarat 52.84 47.16 4,225,910 56.23 43.77 1,243,714 53.61 46.39 5,469,624Haryana 52.66 47.34 1,272,940 51.89 48.11 555,069 52.43 47.57 1,828,009Himachal Pradesh 52.08 47.92 610,673 52.42 47.58 371,183 52.21 47.79 981,856Jammu & Kashmir 54.11 45.89 848,898 55.90 44.10 417,184 54.70 45.30 1,266,082Jharkhand 52.73 47.27 4,167,972 56.93 43.07 692,654 53.33 46.67 4,860,626Karnataka 51.38 48.62 3,541,919 52.30 47.70 1,316,929 51.63 48.37 4,858,848Kerala 50.92 49.08 1,715,934 52.41 47.59 1,009,175 51.47 48.53 2,725,109Lakshadweep 52.25 47.75 6,188 57.59 42.41 3,483 54.17 45.83 9,671Madhya Pradesh 51.06 48.94 8,370,565 56.87 43.13 2,512,499 52.40 47.60 10,883,064Maharashtra 52.37 47.63 6,190,354 53.34 46.66 2,966,776 52.69 47.31 9,157,130Manipur 50.49 49.51 268,331 50.96 49.04 70.694 50.59 49.41 339,025Meghalaya 49.50 50.50 314,920 47.62 52.38 55,624 49.22 50.78 370,544Mizoram 51.80 48.20 92,914 51.17 48.83 29,337 51.65 48.35 122,251Nagaland 50.83 49.17 226,098 50.27 49.73 69,686 50.70 49.30 295,784Orissa 51.84 48.16 4,131,054 54.00 46.00 1,0.65,111 52.29 47.71 5,196,165Puducherry 51.47 48.53 38,763 53.39 46.61 21.321 52.15 47.85 60,084Punjab 53.63 46.37 1,272,157 53.70 46.30 677,469 53.65 46.35 1,949,626Rajasthan 53.15 46.85 7,505,092 62.82 37.18 2,391,184 55.49 44.51 9,896,276Sikkim 50.16 49.84 79,606 46.02 53.98 26,204 49.13 50.87 105,810Tamil Nadu 51.86 48.14 4,323,767 52.71 47.29 2,344,296 52.16 47.84 6,668,063Tripura 52.46 47.54 438,448 51.72 48.28 157,878 52.26 47.74 596,326Uttar Pradesh 52.18 47.82 22,048,752 54.98 45.02 5,132,336 52.71 47.29 27,181,088Uttarakhand 50.21 49.79 845,485 51.54 48.46 338,827 50.59 49.41 1,184,312West Bengal 50.59 49.41 7,646,006 51.19 48.81 2,813,330 50.75 49.25 10,459,336All Districts 52.25 47.75 102,575,022 54.83 45.17 32,851,916 52.88 47.12 135,426,938Elementary Education <strong>in</strong> India : Analytical Report


