- Page 2: Number of Schools by Category : 200
- Page 7 and 8: Percentage of Schools by Category &
- Page 9 and 10: Table 2.6Distance of Schools from t
- Page 11 and 12: Table 2.6Distance of Schools from t
- Page 13 and 14: Table 2.7Distance of Schools from t
- Page 15 and 16: Table 2.7Distance of Schools from t
- Page 17 and 18: Table 2.7Distance of Schools from t
- Page 19 and 20: 259Schools Inspected by Category :
- Page 21 and 22: Percentage of Schools by Management
- Page 23 and 24: Percentage of Schools by Management
- Page 25 and 26: Percentage of Schools by Management
- Page 27 and 28: Table 2.12Ratio of Primary to Upper
- Page 29 and 30: Table 2.12Ratio of Primary to Upper
- Page 31 and 32: 271Percentage of Schools Establishe
- Page 33 and 34: Percentage Distribution of Schools
- Page 35 and 36: Percentage Distribution of Schools
- Page 37 and 38: Percentage Distribution of Schools
- Page 39 and 40: Percentage Distribution of Schools
- Page 41: 281Table 2.16Average Number of Clas
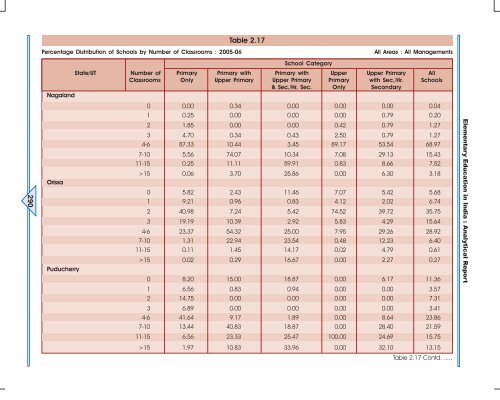
- Page 44 and 45: Table 2.17Percentage Distribution o
- Page 46 and 47: Table 2.17Percentage Distribution o
- Page 48 and 49: Table 2.17Percentage Distribution o
- Page 52 and 53: Table 2.17Percentage Distribution o
- Page 54 and 55: 294Table 2.18Percentage Distributio
- Page 56 and 57: 296Table 2.18Percentage Distributio
- Page 58 and 59: 298Table 2.18Percentage Distributio
- Page 60 and 61: 300Student-Classroom Ratio : 2005-0
- Page 62 and 63: 302Percentage Distribution of Schoo
- Page 64 and 65: Average Enrolment by Schools Catego
- Page 66 and 67: Average Number of Instructional Day
- Page 68 and 69: 308Table 3.2Percentage Distribution
- Page 70 and 71: 310Table 3.4Percentage Distribution
- Page 72 and 73: Percentage Distribution of Schools
- Page 74 and 75: Percentage Distribution of Schools
- Page 76 and 77: Percentage Distribution of Schools
- Page 78 and 79: Percentage Distribution of Schools
- Page 80 and 81: 320Percentage of Schools having Dri
- Page 82 and 83: Percentage of Schools by Type of Dr
- Page 84 and 85: Percentage of Schools by Type of Dr
- Page 86 and 87: Percentage of Schools by Type of Dr
- Page 88 and 89: Percentage of Schools by Type of Dr
- Page 90 and 91: 330Percentage of Schools having Gir
- Page 92 and 93: 332Percentage of Schools without Bl
- Page 94 and 95: 334Percentage of Schools having Com
- Page 96 and 97: 336Percentage of Schools having Ram
- Page 98 and 99: Percentage of Schools having Playgr
- Page 100 and 101:
340Percentage of Schools Utilised S
- Page 102 and 103:
342Table 3.22Percentage of Schools
- Page 104 and 105:
Enrolment in Primary & Upper Primar
- Page 106 and 107:
Table 4.4Percentage of Boys & Girls
- Page 108 and 109:
Table 4.6Percentage of Boys & Girls
- Page 110 and 111:
Percentage of SC & ST Enrolment to
- Page 112 and 113:
Table 4.10Enrolment of Children wit
- Page 114 and 115:
Table 4.11Percentage Share of Enrol
- Page 116 and 117:
356Percentage of Enrolment in Singl
- Page 118 and 119:
358Percentage of Enrolment in Schoo
- Page 120 and 121:
Table 4.16Enrolment in Classes I to
- Page 122 and 123:
Table 4.16Enrolment in Classes I to
- Page 124 and 125:
Table 4.16Enrolment in Classes I to
- Page 126 and 127:
Table 4.17Percentage Distribution o
- Page 128 and 129:
Table 4.19Percentage Distribution o
- Page 130 and 131:
Table 4.21Examination Results : 200
- Page 132 and 133:
Table 4.23Examination Results : 200
- Page 134 and 135:
Table 5.2Percentage Distribution of
- Page 136 and 137:
Average Number of Teachers per Scho
- Page 138 and 139:
Percentage of Female Teachers by Sc
- Page 140 and 141:
380Percentage of School having Pupi
- Page 142 and 143:
382Table 5.10Teachers by Academic Q
- Page 144 and 145:
384Table 5.10Teachers by Academic Q
- Page 146 and 147:
386Table 5.10Teachers by Academic Q
- Page 148 and 149:
388Table 5.10Teachers by Academic Q
- Page 150 and 151:
390Table 5.10Teachers by Academic Q
- Page 152 and 153:
392Table 5.10Teachers by Academic Q
- Page 154 and 155:
Table 5.11Percentage of Teachers Re
- Page 156 and 157:
Percentage of Para-Teachers by Scho
- Page 158 and 159:
Table 5.14Percentage of Para-Teache
- Page 160 and 161:
Table 5.14Percentage of Para-Teache
- Page 162 and 163:
Table 5.14Percentage of Para-Teache
- Page 164 and 165:
Table 5.14Percentage of Para-Teache
- Page 166 and 167:
Table 5.14Percentage of Para-Teache
- Page 168 and 169:
Percentage of Para-Teachers by Acad
- Page 170 and 171:
Percentage of Teachers by Caste : 2
- Page 172 and 173:
Percentage of Teachers by Caste : 2
- Page 174 and 175:
Percentage of Teachers by Caste : 2
- Page 176 and 177:
Percentage of Teachers by Caste : 2
- Page 178 and 179:
Percentage of Teachers by Caste : 2
- Page 180 and 181:
Percentage of Teachers by Caste : 2
- Page 182:
Number of Working Days Spent on Non