2001-2002 VTEA Student Survey - East Los Angeles College
2001-2002 VTEA Student Survey - East Los Angeles College
2001-2002 VTEA Student Survey - East Los Angeles College
- No tags were found...

You also want an ePaper? Increase the reach of your titles
YUMPU automatically turns print PDFs into web optimized ePapers that Google loves.
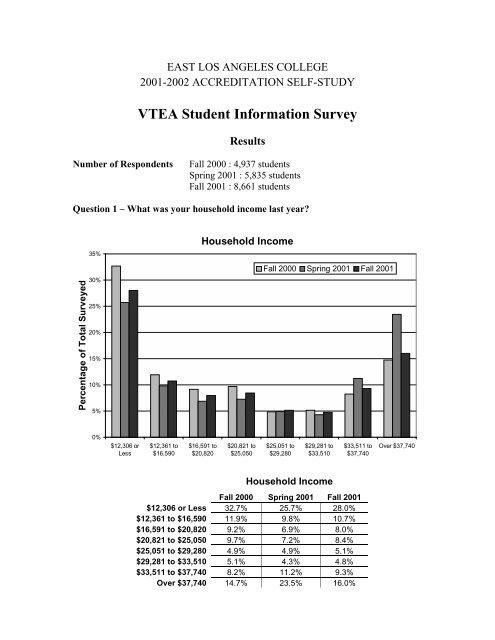
EAST LOS ANGELES COLLEGE<strong>2001</strong>-<strong>2002</strong> ACCREDITATION SELF-STUDY<strong>VTEA</strong> <strong>Student</strong> Information <strong>Survey</strong>ResultsNumber of RespondentsFall 2000 : 4,937 studentsSpring <strong>2001</strong> : 5,835 studentsFall <strong>2001</strong> : 8,661 studentsQuestion 1 – What was your household income last year?Percentage of Total <strong>Survey</strong>ed35%30%25%20%15%10%5%Household IncomeFall 2000 Spring <strong>2001</strong> Fall <strong>2001</strong>0%$12,306 orLess$12,361 to$16,590$16,591 to$20,820$20,821 to$25,050$25,051 to$29,280$29,281 to$33,510$33,511 to$37,740Over $37,740Household IncomeFall 2000 Spring <strong>2001</strong> Fall <strong>2001</strong>$12,306 or Less 32.7% 25.7% 28.0%$12,361 to $16,590 11.9% 9.8% 10.7%$16,591 to $20,820 9.2% 6.9% 8.0%$20,821 to $25,050 9.7% 7.2% 8.4%$25,051 to $29,280 4.9% 4.9% 5.1%$29,281 to $33,510 5.1% 4.3% 4.8%$33,511 to $37,740 8.2% 11.2% 9.3%Over $37,740 14.7% 23.5% 16.0%
Question 2 – How many individuals are in your household?30%Number of Individuals in HouseholdFall 2000 Spring <strong>2001</strong> Fall <strong>2001</strong>25%Percentage of Total <strong>Survey</strong>ed20%15%10%5%0%1 2 3 4 5 6 7 8 or moreNumber of IndividualsNumber of Individuals in HouseholdFall 2000 Spring <strong>2001</strong> Fall <strong>2001</strong>1 14.0% 12.3% 15.0%2 18.5% 26.4% 19.3%3 19.6% 19.2% 20.8%4 19.8% 17.4% 17.0%5 12.8% 10.4% 13.0%6 6.6% 5.2% 6.3%7 3.1% 2.5% 2.8%8 or more 1.8% 1.6% 1.6%
Economic Status of <strong>Student</strong>s70%Economic StatusPercentage of Total <strong>Survey</strong>ed60%50%40%30%20%Fall 2000 Spring <strong>2001</strong> Fall <strong>2001</strong>10%0%Economically DisadvantagedNot Economically DisadvantagedEconomic StatusFall 2000 Spring <strong>2001</strong> Fall <strong>2001</strong>Economically Disadvantaged 42.1% 33.9% 27.7%Not Economically Disadvantaged 45.3% 56.0% 66.7%
Questions 3, 4, 5 – Are you currently receiving benefits from…(3) …TANF/CalWORKs (Temporary Assistance for NeedyFamilies)?(4) …SSI/SSP (Supplemental Security Income)?(5) …GA (General Assistance)?8%<strong>Student</strong>s Currently Receiving BenefitsPercentage of Total <strong>Survey</strong>ed7%6%5%4%3%2%Fall 2000 Spring <strong>2001</strong> Fall <strong>2001</strong>1%0%TANF/CalWORKs SSI/SSP General AssistanceBenefit Program<strong>Student</strong>s Receiving BenefitsFall 2000 Spring <strong>2001</strong> Fall <strong>2001</strong>TANF/CalWORKs 7.5% 5.2% 5.5%SSI/SSP 2.6% 2.5% 2.7%General Assistance 2.5% 1.9% 2.4%
Question 6 – What is your goal for being in college? Now? Eventually?Current GoalsPercentage of Total <strong>Survey</strong>ed40%35%30%25%20%15%10%5%0%Get a new jobKeep/advance in current job/careerMaintain certificate or licenseEarn community college degree or certificateEarn Bachelor's degreeImprove basic skills in English, reading, or mathFall 2000 Spring <strong>2001</strong> Fall <strong>2001</strong>Complete credits for HS diploma or GEDPersonal developmentDiscover/develop career interests, plans & goalsUndecidedCurrent GoalsFall 2000 Spring <strong>2001</strong> Fall <strong>2001</strong>Get a new job 17.6% 13.8% 16.4%Keep/advance in current job/career 28.8% 32.8% 24.7%Maintain certificate or license 10.4% 14.4% 13.7%Earn community college degree or certificate 28.6% 35.5% 27.0%Earn Bachelor's degree 14.3% 11.5% 13.0%Improve basic skills in English, reading, or math 25.2% 21.4% 23.8%Complete credits for HS diploma or GED 5.3% 4.8% 4.5%Personal development 27.6% 23.3% 27.6%Discover/develop career interests, plans & goals 26.4% 20.9% 28.7%Undecided 6.6% 5.6% 7.2%
Question 6 – What is your goal for being in college? Now? Eventually?Percentage of Total <strong>Survey</strong>ed45%40%35%30%25%20%15%10%5%0%Eventual GoalsGet a new jobKeep/advance in current job/careerMaintain certificate or licenseEarn community college degree or certificateEarn Bachelor's degreeImprove basic skills in English, reading, or mathFall 2000 Spring <strong>2001</strong> Fall <strong>2001</strong>Complete credits for HS diploma or GEDPersonal developmentDiscover/develop career interests, plans & goalsUndecidedEventual GoalsFall 2000 Spring <strong>2001</strong> Fall <strong>2001</strong>Get a new job 33.5% 29.7% 35.0%Keep/advance in current job/career 22.3% 19.6% 21.5%Maintain certificate or license 19.0% 17.1% 17.4%Earn community college degree or certificate 27.4% 23.4% 27.5%Earn Bachelor's degree 43.5% 36.0% 42.4%Improve basic skills in English, reading, or math 10.1% 9.2% 10.3%Complete credits for HS diploma or GED 3.4% 3.6% 3.5%Personal development 10.5% 8.9% 10.0%Discover/develop career interests, plans & goals 15.4% 13.1% 16.5%Undecided 3.2% 3.5% 4.1%
Question 7 – If you are working, are you taking any courses that are helping youadvance in your current job or obtain a better job?<strong>Student</strong>s Taking Courses for Job Improvement70%60%Percentage of Total <strong>Survey</strong>ed50%40%30%20%10%0%Fall 2000 Spring <strong>2001</strong> Fall <strong>2001</strong>Job ImprovementFall 2000 Spring <strong>2001</strong> Fall <strong>2001</strong>Yes 66.4% 61.1% 61.4%No 33.6% 38.9% 38.6%