LAI determination in forestry ecosystem by LiDAR data analysis
LAI determination in forestry ecosystem by LiDAR data analysis
LAI determination in forestry ecosystem by LiDAR data analysis
- No tags were found...

You also want an ePaper? Increase the reach of your titles
YUMPU automatically turns print PDFs into web optimized ePapers that Google loves.
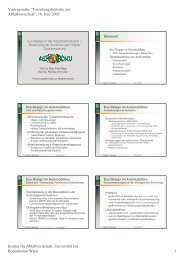
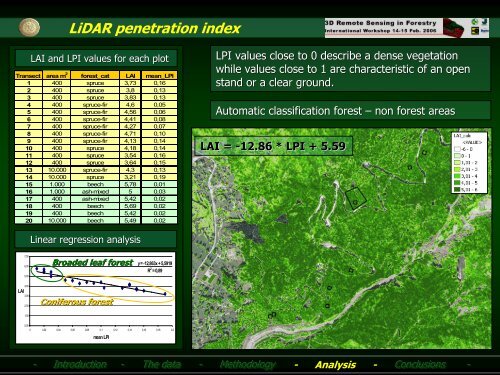
<strong>LiDAR</strong> penetration <strong>in</strong>dex<strong>LAI</strong> and LPI values for each plotTransect area m 2 forest_cat <strong>LAI</strong> mean_LPI1 400 spruce 3,73 0,162 400 spruce 3,8 0,133 400 spruce 3,83 0,134 400 spruce-fir 4,6 0,055 400 spruce-fir 4,56 0,066 400 spruce-fir 4,41 0,087 400 spruce-fir 4,27 0,078 400 spruce-fir 4,71 0,109 400 spruce-fir 4,13 0,1410 400 spruce 4,18 0,1411 400 spruce 3,54 0,1612 400 spruce 3,64 0,1513 10.000 spruce-fir 4,3 0,1314 10.000 spruce 3,21 0,1915 1.000 beech 5,78 0,0116 1.000 ash-mixed 5 0,0317 400 ash-mixed 5,42 0,0218 400 beech 5,69 0,0219 400 beech 5,42 0,0220 10.000 beech 5,49 0,02LPI values close to 0 describe a dense vegetationwhile values close to 1 are characteristic of an openstand or a clear ground.Automatic classification forest – non forest areas<strong>LAI</strong> = -12.86 * LPI + 5.59L<strong>in</strong>ear regression <strong>analysis</strong>7,006,005,00Broaded leaf foresty = -12,863x + 5,5919R 2 = 0,89<strong>LAI</strong>4,003,002,00Coniferous forest1,000,000 0,02 0,04 0,06 0,08 0,1 0,12 0,14 0,16 0,18 0,2mean LPI100 m-- Introduction -- The <strong>data</strong> --Methodology - Analysis - Conclusions --