LAI determination in forestry ecosystem by LiDAR data analysis
LAI determination in forestry ecosystem by LiDAR data analysis
LAI determination in forestry ecosystem by LiDAR data analysis
- No tags were found...

Create successful ePaper yourself
Turn your PDF publications into a flip-book with our unique Google optimized e-Paper software.
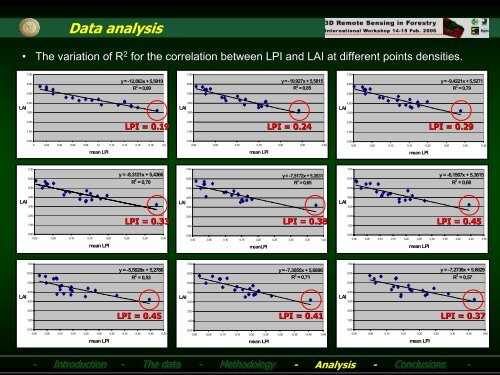
Data <strong>analysis</strong>• The variation of R 2 for the correlation between LPI and <strong>LAI</strong> at different po<strong>in</strong>ts densities.7,007,007,006,00y = -12,863x + 5,5919R 2 = 0,896,00y = -10,927x + 5,5815R 2 = 0,856,00y = -9,4221x + 5,5271R 2 = 0,795,005,005,00<strong>LAI</strong>4,003,00<strong>LAI</strong>4,003,00<strong>LAI</strong>4,003,002,001,00LPI = 0.192,001,00LPI = 0.242,001,00LPI = 0.290,000 0,02 0,04 0,06 0,08 0,1 0,12 0,14 0,16 0,18 0,2mean LPI0,000,00 0,05 0,10 0,15 0,20 0,25 0,30mean LPI0,000,00 0,05 0,10 0,15 0,20 0,25 0,30 0,35mean LPI7,006,00y = -8,3121x + 5,4366R 2 = 0,707,006,00y = -7,5172x + 5,3531R 2 = 0,657,006,00y = -6,1567x + 5,3615R 2 = 0,685,005,005,00<strong>LAI</strong>4,003,00<strong>LAI</strong>4,003,00<strong>LAI</strong>4,003,002,001,00LPI = 0.332,001,00LPI = 0.382,001,00LPI = 0.450,000,00 0,05 0,10 0,15 0,20 0,25 0,30 0,35mean LPI0,000,00 0,05 0,10 0,15 0,20 0,25 0,30 0,35 0,40meanLPI0,000,00 0,05 0,10 0,15 0,20 0,25 0,30 0,35 0,40 0,45 0,50mean LPI7,006,005,00y = -5,5628x + 5,2786R 2 = 0,537,006,005,00y = -7,3055x + 5,6896R 2 = 0,717,006,005,00y = -7,2738x + 5,6629R 2 = 0,57<strong>LAI</strong>4,003,00<strong>LAI</strong>4,003,00<strong>LAI</strong>4,003,002,001,00LPI = 0.452,001,00LPI = 0.412,001,00LPI = 0.370,000,00 0,05 0,10 0,15 0,20 0,25 0,30 0,35 0,40 0,45 0,50mean LPI0,000,00 0,05 0,10 0,15 0,20 0,25 0,30 0,35 0,40 0,45mean LPI0,000,00 0,05 0,10 0,15 0,20 0,25 0,30 0,35 0,40mean LPI-- Introduction -- The <strong>data</strong> --Methodology - Analysis - Conclusions --