The Global Financial Centres Index - 1 - Z/Yen
The Global Financial Centres Index - 1 - Z/Yen
The Global Financial Centres Index - 1 - Z/Yen
- No tags were found...
You also want an ePaper? Increase the reach of your titles
YUMPU automatically turns print PDFs into web optimized ePapers that Google loves.
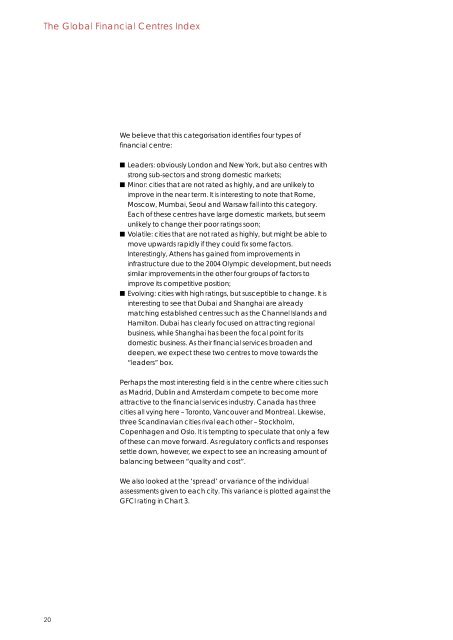
<strong>The</strong> <strong>Global</strong> <strong>Financial</strong> <strong>Centres</strong> <strong>Index</strong>We believe that this categorisation identifies four types offinancial centre:■ Leaders: obviously London and New York, but also centres withstrong sub-sectors and strong domestic markets;■ Minor: cities that are not rated as highly, and are unlikely toimprove in the near term. It is interesting to note that Rome,Moscow, Mumbai, Seoul and Warsaw fall into this category.Each of these centres have large domestic markets, but seemunlikely to change their poor ratings soon;■ Volatile: cities that are not rated as highly, but might be able tomove upwards rapidly if they could fix some factors.Interestingly, Athens has gained from improvements ininfrastructure due to the 2004 Olympic development, but needssimilar improvements in the other four groups of factors toimprove its competitive position;■ Evolving: cities with high ratings, but susceptible to change. It isinteresting to see that Dubai and Shanghai are alreadymatching established centres such as the Channel Islands andHamilton. Dubai has clearly focused on attracting regionalbusiness, while Shanghai has been the focal point for itsdomestic business. As their financial services broaden anddeepen, we expect these two centres to move towards the“leaders” box.Perhaps the most interesting field is in the centre where cities suchas Madrid, Dublin and Amsterdam compete to become moreattractive to the financial services industry. Canada has threecities all vying here – Toronto, Vancouver and Montreal. Likewise,three Scandinavian cities rival each other – Stockholm,Copenhagen and Oslo. It is tempting to speculate that only a fewof these can move forward. As regulatory conflicts and responsessettle down, however, we expect to see an increasing amount ofbalancing between “quality and cost”.We also looked at the ‘spread’ or variance of the individualassessments given to each city. This variance is plotted against theGFCI rating in Chart 3.20


