The Global Financial Centres Index - 1 - Z/Yen
The Global Financial Centres Index - 1 - Z/Yen
The Global Financial Centres Index - 1 - Z/Yen
- No tags were found...

Create successful ePaper yourself
Turn your PDF publications into a flip-book with our unique Google optimized e-Paper software.
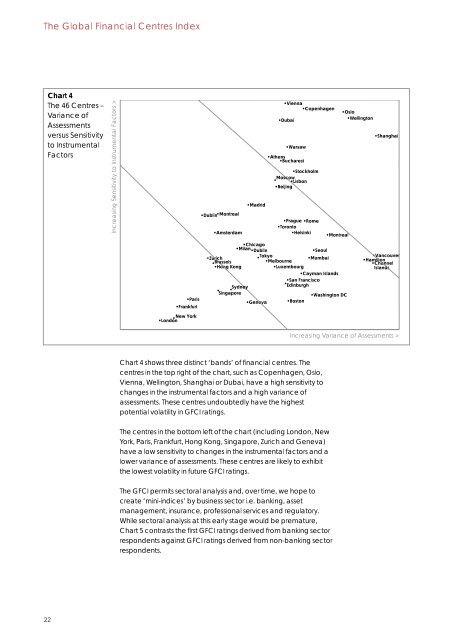
<strong>The</strong> <strong>Global</strong> <strong>Financial</strong> <strong>Centres</strong> <strong>Index</strong>Chart 4<strong>The</strong> 46 <strong>Centres</strong> –Variance ofAssessmentsversus Sensitivityto InstrumentalFactorsIncreasing Sensitivity to Instrumental Factors >•Dublin•Montreal•Amsterdam•Madrid•Vienna•Copenhagen•Dubai•Warsaw•Athens•Bucharest•StockholmMoscow• •Lisbon•Beijing•Prague •Rome•Toronto•Helsinki•Montreal•Oslo•Wellington•Shanghai•Chicago•Milan•Dublin•Seoul•Zurich•Tokyo•Mumbai• Brussels•Melbourne•Hong Kong•Luxembourg•LondonNew York•Cayman Islands•San Francisco•SydneyEdinburgh• •Singapore•Washington DC•Paris•Geneva •Boston•Frankfurt•Vancouver•Hamilton•ChannelIslandsIncreasing Variance of Assessments >Chart 4 shows three distinct ‘bands’ of financial centres. <strong>The</strong>centres in the top right of the chart, such as Copenhagen, Oslo,Vienna, Wellington, Shanghai or Dubai, have a high sensitivity tochanges in the instrumental factors and a high variance ofassessments. <strong>The</strong>se centres undoubtedly have the highestpotential volatility in GFCI ratings.<strong>The</strong> centres in the bottom left of the chart (including London, NewYork, Paris, Frankfurt, Hong Kong, Singapore, Zurich and Geneva)have a low sensitivity to changes in the instrumental factors and alower variance of assessments. <strong>The</strong>se centres are likely to exhibitthe lowest volatility in future GFCI ratings.<strong>The</strong> GFCI permits sectoral analysis and, over time, we hope tocreate ‘mini-indices’ by business sector i.e. banking, assetmanagement, insurance, professional services and regulatory.While sectoral analysis at this early stage would be premature,Chart 5 contrasts the first GFCI ratings derived from banking sectorrespondents against GFCI ratings derived from non-banking sectorrespondents.22