The Global Financial Centres Index - 1 - Z/Yen
The Global Financial Centres Index - 1 - Z/Yen
The Global Financial Centres Index - 1 - Z/Yen
- No tags were found...

Create successful ePaper yourself
Turn your PDF publications into a flip-book with our unique Google optimized e-Paper software.
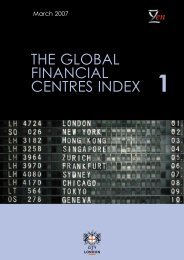
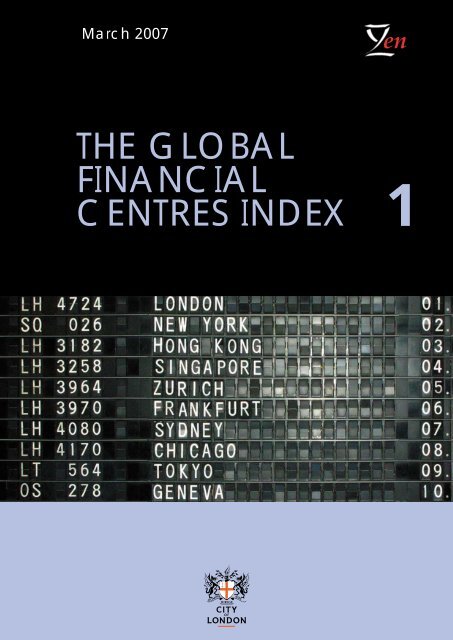
March 2007enTHE GLOBALFINANCIALCENTRES INDEX1
<strong>The</strong> <strong>Global</strong> <strong>Financial</strong> <strong>Centres</strong> <strong>Index</strong> is published by the City ofLondon. <strong>The</strong> authors of the report are Michael Mainelli andMark Yeandle of Z/<strong>Yen</strong> Group Limited.This report is intended as a basis for discussion only. Whilstevery effort has been made to ensure the accuracy andcompleteness of the material in this report, the authors, Z/<strong>Yen</strong>Group Limited, and the City of London, give no warranty inthat regard and accept no liability for any loss or damageincurred through the use of, or reliance upon, this report orthe information contained herein.March 2007© City of LondonPO Box 270, GuildhallLondonEC2P 2EJwww.cityoflondon.gov.uk/economicresearch
<strong>The</strong> <strong>Global</strong><strong>Financial</strong><strong>Centres</strong> <strong>Index</strong>March 2007ContentsForeword 31. Executive Summary 82. Background 103. <strong>The</strong> GFCI 124. Analysis of <strong>Financial</strong> <strong>Centres</strong> 185. Instrumental Factors 245a. People Factors 255b. Business Environment Factors 295c. Market Access Factors 355d. Infrastructure Factors 395e. General Competitiveness Factors 436. Overview of Survey Results 477. Conclusion 508. Appendices 52Appendix A. Methodology 52Appendix B. <strong>The</strong> Online Surveys 56Appendix C. <strong>The</strong> Instrumental Factors 58Bibliography 63
<strong>The</strong> <strong>Global</strong> <strong>Financial</strong> <strong>Centres</strong> <strong>Index</strong>2
<strong>The</strong> <strong>Global</strong> <strong>Financial</strong> <strong>Centres</strong> <strong>Index</strong>ForewordMichael SnyderChairman, Policy and Resources Committee, City of LondonIn a globalised and interdependent world economy thedynamics of international competitiveness have becomeincreasingly important for domestic policy makers. Cities thatare financial centres face greater competitive forces thanmost, for the financial services industry is at the heart of theglobal economy, acting as the facilitator of world trade andinvestment. Those of us charged with the delivery of effectivepublic policy need to understand the complex ingredientsof success to ensure that our financial centres remain globallycompetitive. Moreover, we need to know how theworld’s financial centres rank relative to each other on anongoing basis.This research, by Z/<strong>Yen</strong> Ltd, is the first to report on a newbiannual index of competitiveness for 46 world financialcentres. <strong>The</strong> first <strong>Global</strong> <strong>Financial</strong> <strong>Centres</strong> <strong>Index</strong> (GFCI)presented here ranks London and New York as the leadingcentres, followed by Hong Kong, Singapore and Zurich.London has a narrow lead over New York, but the twotogether are significantly ahead of the rest of the field to bethe only true global financial centres. Overtime the GFCI willbecome a more powerful tool as we expand the number ofcentres and we further develop the <strong>Index</strong> to allow increasingsophistication in analysing changes in the relative strengthsof financial centres.I welcome the GFCI findings, which clearly identifyLondon’s global strengths relative to its major competitors.London’s prime position is a reflection of the unrivalledtalent pool clustered here; our firm but fair principles-based3
<strong>The</strong> <strong>Global</strong> <strong>Financial</strong> <strong>Centres</strong> <strong>Index</strong>regulation supported by good market access; and anexcellent business environment.<strong>The</strong>re is no doubt, however, that the real merit of the GFCI isthe identification of changing priorities and concerns. Whenwe published our report <strong>The</strong> Competitive Position of Londonas a <strong>Global</strong> <strong>Financial</strong> Centre back in November 2005, theavailability of skilled personnel was regarded as the mostimportant factor of competitiveness. Almost 18 months on, itis regulatory and tax issues that have come to be seen as thebiggest contributors to overall competitiveness. <strong>The</strong> latter is aparticular concern for London, as anxieties about thecorporate tax regime relative to our major competitors arewidespread among respondents.<strong>The</strong> GFCI will prove to be an invaluable tool for trackingchanging fortunes and perceptions of financial centres,and I encourage industry professionals to participate in ourongoing survey.Michael SnyderLondonMarch 20074
<strong>The</strong> <strong>Global</strong> <strong>Financial</strong> <strong>Centres</strong> <strong>Index</strong>5
<strong>The</strong> <strong>Global</strong> <strong>Financial</strong> <strong>Centres</strong> <strong>Index</strong>Chart 1<strong>The</strong> GFCI WorldVancouverSan FranciscoChicagoMontrealTorontoNew YorkWashington DCHamiltonCayman Islands6
<strong>The</strong> <strong>Global</strong> <strong>Financial</strong> <strong>Centres</strong> <strong>Index</strong>StockholmHelsinkiEdinburghOsloCopenhagenDublinAmsterdamLondonBrussels WarsawFrankfurtChannelPragueParis LuxembourgIslands Zurich BudapestGeneva ViennaMilanRomeLisbon MadridAthensMoscowBeijingSeoulShanghaiTokyoDubaiMumbaiHong KongSingaporeSydneyMelbourneWellington7
<strong>The</strong> <strong>Global</strong> <strong>Financial</strong> <strong>Centres</strong> <strong>Index</strong>1. Executive Summary<strong>The</strong> City of London Corporation’s <strong>Global</strong> <strong>Financial</strong> <strong>Centres</strong> <strong>Index</strong>(GFCI) evaluates the competitiveness of 46 financial centresworldwide. It is updated regularly to identify changes in financialcentre competitiveness.<strong>The</strong> GFCI currently shows that London and New York are the two leadingfinancial centres globally, with London ahead of New York by 5 ratingpoints. London and New York are well ahead of the two strongest Asiancentres of Hong Kong and Singapore which occupy 3rd and 4th placesrespectively. It is interesting to observe that Zurich, a financial centrestrongly focused on the two niche sectors of private banking and assetmanagement, is in 5th place just ahead of Frankfurt in 6th place.It is worthwhile noting that London leads New York in all five areas ofcompetitiveness, i.e. people, business environment, market access,infrastructure and general competitiveness. It is also notable that inthe most recent of the two online surveys, London is further ahead ofNew York than it was in the previous study. In November 2005 the gapbetween the two cities was very small. Taking the city assessmentsfrom the most recent study in isolation, London is ahead of New Yorkby 37 points.In the 2005 study, there was no clear leader amongst the Asian centres.It is now clear that Hong Kong (3rd in the GFCI) leads the way fromSingapore (4th). <strong>The</strong>se two financial centres are well ahead of Tokyo(9th), and the two Chinese centres of Shanghai (24th) and Beijing (36th).Paris is now just outside the top ten in 11th place, only three pointsbehind Geneva. Toronto is in 12th position, perhaps higher than onemight expect. Toronto, however, is the national financial centre ofCanada and acts as a major international centre. Toronto is rated withinthe top ten on people and business environment factors and Canada isvery highly placed on the general competitiveness instrumental factorsused in the GFCI model. Two US cities follow Toronto: San Francisco andBoston are in 13th and 14th place respectively and are strong regionalcentres which benefit from the sheer size of the US economy.<strong>The</strong> research involved in producing the GFCI has revealed a change inemphasis of the areas of competitiveness. In 2005, people and skillsissues were rated as the most important factors of competitivenessfollowed by regulatory issues. In this research, people factors have beenreplaced as the most important factor by the regulatory and taxenvironments. Concerns about the level and quality of regulation in theUSA and about the increasing levels of corporate taxation in the UK arewidespread amongst our respondents. GFCI ratings will change asinstrumental factors and financial centre assessments change. Weintend to publish results twice a year.8
<strong>The</strong> <strong>Global</strong> <strong>Financial</strong> <strong>Centres</strong> <strong>Index</strong>Table 1<strong>The</strong> Top 10<strong>Financial</strong> <strong>Centres</strong>ComparedLondon 1 765 Most key success areas are excellent – London is in the topquartile in over 80% of its instrumental factors. Especially strongon people, market access and regulation. <strong>The</strong> main negativecomments concern corporate tax rates, transportinfrastructure and operational costs.New York 2 760 Most areas are very strong – New York is also in the top quartilein over 80% of its instrumental factors. People and marketaccess are particular strengths. Our respondents citedregulation (particularly Sarbanes-Oxley) as the main negativefactor.Hong Kong 3 684 Hong Kong is a thriving regional centre. It performs well in allof the key competitiveness areas, especially in regulation.Headline costs are high but this does not detract from overallcompetitiveness. Hong Kong is a real contender to become agenuinely global financial centre.Singapore 4 660 Most areas are very good and banking regulation is oftencited as being excellent. It performs well in four of the keycompetitiveness areas but falls to 9th place on generalcompetitiveness factors alone. Definitely the second Asiancentre just behind Hong Kong.Zurich 5 656 A very strong niche centre. Private banking and assetmanagement provide a focus. Zurich performs well in three ofthe key competitiveness areas but loses out slightly in peoplefactors and in general competitiveness.Frankfurt 6 647 Despite a strong banking focus, suffers from inflexible labourlaws and skilled staff shortages. Market access, infrastructureand business environment are strong but Frankfurt falls outsidethe top ten GFCI rankings for people and generalcompetitiveness.Sydney 7 639 A strong national centre with good regulation, offering aparticularly good quality of life. Sydney is strong in four of thekey competitiveness areas but falls outside the top ten forpeople – many financial professionals leave for larger Englishspeakingcentres.Chicago 8 636 Number two centre in the US. Hampered by the sameregulatory regime as New York. It scores highly for people butis let down by its infrastructure and market access rankings.Unlikely to overtake New York, it remains a powerful regionaland specialist centre.Tokyo 9 632 Does not fare well in terms of regulation and businessenvironment, but the size of the Japanese economy meansTokyo has good liquidity. It fares poorly on people but hasgood infrastructure and market access.Geneva 10 628 A strong niche centre similar to Zurich. Private banking andasset management continue to thrive. Geneva is strong inbusiness environment and general competitiveness but letdown by infrastructure.<strong>The</strong> theoretical maximum GFCI rating is 1,000Please participate in the GFCI by rating the financial centres youare familiar with at: www.cityoflondon.gov.uk/GFCI9
<strong>The</strong> <strong>Global</strong> <strong>Financial</strong> <strong>Centres</strong> <strong>Index</strong>2. Background<strong>The</strong> City of London Corporation regularly commissions research oncompetitiveness. Two pieces of research in 2003 1 and 2005 2evaluated London’s competitiveness as a financial centrecompared to New York, Paris and Frankfurt. Both reports showedthat London and New York are the two key global financialcentres while there are many other international, specialist(niche), national and regional financial centres.<strong>The</strong> GFCI is designed to extend the City of London Corporation’sresearch by providing an ongoing ranking system for a muchwider range of financial centres, starting with 46 instead of theprevious four. <strong>The</strong> advantages of an index over the previousstudies are:■ the wider range of cities permits analysis of financial subsectors,e.g. insurance or banking, and not just “finance”because a greater number of assessments allow for statisticallyvalid comparisons;■ shorter, and more direct, questionnaires leads to moreauthoritative comparisons by asking senior figures to rate justthe cities with which they are familiar;■ use of a wide range of instrumental factors (initially 47) enablesbetter analysis of the factors of competitiveness;■ the continuous nature of an index provides more frequent andmore timely information than a snapshot survey, as well as easycomparisons over time.<strong>Financial</strong> services is an attractive business sector for cities seekingto develop because it has been a successful, high growth, sectorfor the past quarter of a century, and because it is a highly mobilesector, which can be directly influenced by policy and planning.For this reason, the competitiveness of financial centres is of greatrelevance to government officials and regulators as can be seenin this excerpt from a HM Treasury Report:<strong>Global</strong>isation creates new competitive pressures forLondon’s financial sector. <strong>The</strong> integration of theglobal economy means that easily replicable‘commoditised’ jobs will tend to shift to the lowestcost locations in emerging markets. In thisenvironment, the challenge for London is to ensurethat it remains the world’s most attractive andcompetitive environment from which to providesophisticated and high value-added financialservices to the rest of the world. 3Previous research has indicated that there are many factors ofcompetitiveness. We group these into five key areas. <strong>The</strong> first four1 Centre for the Study of<strong>Financial</strong> Innovation,Sizing up the City –London’s Ranking as a<strong>Financial</strong> Centre,Corporation of London(June 2003).2 Z/<strong>Yen</strong> Limited, <strong>The</strong>Competitive Position ofLondon as a <strong>Global</strong><strong>Financial</strong> Centre,Corporation of London(November 2005).3 HM Treasury, <strong>Financial</strong>Services in London:<strong>Global</strong> Opportunitiesand Challenges, (March2006).10
<strong>The</strong> <strong>Global</strong> <strong>Financial</strong> <strong>Centres</strong> <strong>Index</strong>of these are: People; the Business Environment; Market Accessand Infrastructure. When a financial centre is strong in these fourareas this creates a critical mass which we term GeneralCompetitiveness.Each of the key indicators covers several aspects ofcompetitiveness:■ People considers the availability of good personnel, the flexibilityof the labour market, business education and the developmentof ‘human capital’. Previous research highlighted this factor asthe single most important factor in financial centrecompetitiveness;■ Business Environment looks at regulation and also tax rates,levels of corruption, economic freedom and the ease of doingbusiness. Regulation, a major component of the businessenvironment, is currently cited as a decisive factor in thecompetitiveness of London and New York. Our online surveyposes a question about the most important competitive factorsfor financial centres and regulation was mentioned by more ofour survey respondents than any other factor. Too onerous aregulatory environment can directly affect the competitivenessof a financial centre. A recent report by McKinsey & Companyargues that Sarbanes-Oxley has had a detrimental effect onNew York’s competitiveness. 4 London is considered heavilyregulated but overall the regulatory environment is morecompetitive than in New York, although there is increasingconcern on the tax front;■ Market Access examines the levels of securitisation, volume andvalue of trading in equities and bonds as well as the clusteringeffect of having many firms involved in the financial servicessector together in one centre;■ Infrastructure is mainly concerned with the cost and availabilityof buildings and office space, although we are seeking reliableindicators to broaden its scope;■ General Competitiveness, the concept that the whole is‘greater than the sum of the parts’ considers overallcompetitiveness levels of cities and how cities are perceived asplaces to live.4 McKinsey & Co.,Sustaining New York’sand the US’ <strong>Global</strong><strong>Financial</strong> ServicesLeadership, (January2007).11
<strong>The</strong> <strong>Global</strong> <strong>Financial</strong> <strong>Centres</strong> <strong>Index</strong>3. <strong>The</strong> GFCI<strong>The</strong> GFCI provides ratings for financial centres calculated by a‘factor assessment model’ built using two distinct sets of input:■ instrumental factors – drawn from external sources. For example,infrastructure competitiveness for a financial centre is indicatedby ‘instrumental factors’ including a cost of property survey andan occupancy costs index; a fair and just business environmentis indicated by ratings such as a corruption perception indexand an opacity index. Objective evidence of competitivefactors has been sought in instrumental factors drawn from awide variety of comparative sources – 47 instrumental factorswere used to construct this first set of GFCI ratings. <strong>The</strong>se include,for example, Mercer’s Quality of Living Survey, UBS’s WageComparison <strong>Index</strong>, Transparency International’s CorruptionPerceptions <strong>Index</strong>, and Anholt’s City Brands <strong>Index</strong>. Not allcentres have data for all instrumental factors and the statisticalmodel takes account of these gaps;■ financial centre assessments – to construct the first set of GFCIratings we used 491 responses to two online surveys (detailed inSection 6 of this report). Each respondent assessed the financialcentres they knew. We received 3,992 individual financialcentre assessments. <strong>The</strong> second online survey is runningcontinuously to keep the GFCI up-to-date with people’schanging assessments.<strong>Financial</strong> centres are assessed in terms of five key competitivenessareas: people, business environment, market access, infrastructureand general competitiveness.At the outset of this project, a number of guidelines were set out toensure that financial centre assessments and instrumental factorswere selected and used in a reliable and consistent manner. Forexample, indices used as instrumental factors should, whereverpossible, be readily available, regularly updated, provided by areputable body and derived using a sound methodology.<strong>The</strong> financial centre assessments and instrumental factors werecombined using statistical techniques to build a predictive modelof financial centre competitiveness using support vector machinemathematics. <strong>The</strong> predictive model was used to answer questionssuch as “If an investment banker gives Singapore a certainassessment, then, based on the instrumental factors for Singaporeand Paris, how would that person assess Paris?” This predictivemodel produced competitiveness ratings for 46 financial centres.Full details of the methodology behind the GFCI can be found inAppendix A. <strong>The</strong> results are shown in Table 2:12
<strong>The</strong> <strong>Global</strong> <strong>Financial</strong> <strong>Centres</strong> <strong>Index</strong>Table 2<strong>The</strong> GFCI<strong>Financial</strong> CentreRatings<strong>Financial</strong> Centre Rank RatingLondon 1 765New York 2 760Hong Kong 3 684Singapore 4 660Zurich 5 656Frankfurt 6 647Sydney 7 639Chicago 8 636Tokyo 9 632Geneva 10 628Paris 11 625Toronto 12 611San Francisco 13 611Boston 14 609Edinburgh 15 605Cayman Islands 16 604Hamilton (Bermuda) 17 603Melbourne 18 603Channel Islands 19 600Washington D.C. 20 594Montreal 21 580Dublin 22 579Amsterdam 23 577Shanghai 24 576Dubai 25 570Luxembourg 26 570Vancouver 27 558Madrid 28 558Stockholm 29 558Milan 30 546Brussels 31 540Helsinki 32 537Oslo 33 529Copenhagen 34 525Vienna 35 518Beijing 36 513Wellington 37 508Rome 38 474Mumbai 39 460Warsaw 40 460Prague 41 453Lisbon 42 453Seoul 43 434Budapest 44 425Moscow 45 421Athens 46 39513
<strong>The</strong> <strong>Global</strong> <strong>Financial</strong> <strong>Centres</strong> <strong>Index</strong>Successful financial centres fulfil one or more of five different roles:■ <strong>Global</strong> financial centres – there are two cities that can claim tofulfil this role, London and New York;■ International financial centres such as Hong Kong that conducta significant volume of cross-border transactions;■ Niche financial centres that are worldwide leaders in one sector,for example Zurich in private banking;■ National financial centres that act as the main centre forfinancial services within one country. Toronto, for example, is thenational financial centre of Canada;■ Regional financial centres that conduct a large proportion ofregional business within one country. Chicago, as well as beingan international centre is also a regional one.<strong>The</strong> GFCI emphasises a point made in other studies, London andNew York are the two leading financial centres. In the GFCI, thetwo top-rated cities, London (765) and New York (760), are fivepoints apart on a scale of 1,000. <strong>The</strong> third highest-rated city is HongKong (684), 76 points lower. <strong>The</strong> next largest gap is betweenWellington (508) at 37th place and Rome (474) at 38th place, a 34point difference. London and New York are distinct – these areglobal financial centres.International activity involves, at its simplest, at least two locationsin different jurisdictions. <strong>Global</strong> deals increase the number ofinvolved parties markedly, e.g. lawyers, accountants, exchangesand analysts. While a direct foreign exchange deal between aretail bank in Korea and a Tokyo investment bank is international,the addition of a third party, e.g. backing with a credit derivative,is likely to make the deal global. <strong>Global</strong> financial centres comeinto their own when there are two or more parties or a need fordeep liquidity.Several centres score highly on the basis of being strong in oneparticular niche of financial services, e.g. Zurich for private bankingor Hamilton for reinsurance. While these niche financial centres willalmost certainly never rival London or New York as global financialcentres, they are as strong as London or New York within their ownsector.A national financial centre conducts a significant proportion of aparticular country’s financial business. Where there are multiplefinancial centres in a country, e.g. Canada, Australia and the USA,the situation is complicated. In Canada, for instance, the GFCIcovers Toronto (ranked 12th), Montreal (ranked 21st) andVancouver (ranked 27th). All three are sizeable financial centres,but Toronto is the national centre. In countries where there are14
<strong>The</strong> <strong>Global</strong> <strong>Financial</strong> <strong>Centres</strong> <strong>Index</strong>multiple financial centres, the national centre is frequently tied withforeign exchange connections.A regional financial centre is one that conducts most of its businesswithin one region of one country. In addition to its role as aninternational financial centre, Chicago is a regional financialcentre for the American Midwest.A few examples of the roles that financial centres can play areshown in Table 3.Table 3<strong>The</strong> DifferentRoles of <strong>Financial</strong><strong>Centres</strong>Centre <strong>Global</strong> International Niche National RegionalLondon ■ ■ ■ ■ ■Hong Kong ■ ■Chicago ■ ■ ■Hamilton ■ ■Sydney ■ ■ ■<strong>The</strong> GFCI helps our understanding of the complexity ofinternational financial arrangements. In the 1970’s and 1980’s,studies assumed that financial centres developed following a“hub-and-spoke” or “central-regional-store-distribution” retailmodel. Much of the literature of the 1980’s assumed that Tokyowould become an international centre because of its largedomestic economy. International finance was assumed to growout of domestic finance. Nowadays, international finance hasbecome so complex that this assumption may not be valid.In contrast to earlier studies in the 1980’s and 1990’s, the domesticmarkets affiliated with London and New York did not come up as adominant factor in the GFCI. <strong>The</strong> US economy is at least five timesthat of Britain’s, yet London and New York are roughly level ininternational finance.London or New York often connect regional participants directly,without using national or regional financial centres as hubs. AKorean mortgage bank may well be working on regional financialdeals and be located in Seoul, but the bank’s internationaldealings could be direct with counter-parties in London or NewYork, not via a sub-hub or international expert in Seoul.<strong>The</strong>re has been considerable speculation as to whetherShanghai, Hong Kong, Tokyo or Singapore will emerge as aglobal centre. It may be that no single Asian centre emerges as15
<strong>The</strong> <strong>Global</strong> <strong>Financial</strong> <strong>Centres</strong> <strong>Index</strong>a third global centre and that the liquidity generated by thegrowth of the main Asian economies is split between two ormore centres. Shanghai was the most commented-upon Asiancity in the 2005 City of London study but, with the GFCI askingrespondents to compare a number of Asian financial centres,now Hong Kong is clearly 3rd and Singapore 4th to London andNew York. Current thinking seems to be that Shanghai andTokyo are unlikely to become truly global centres. Hong Kongseems the most likely Asian city to emerge – it has a strongregulatory system and a well skilled financial services workforce.Singapore is a close second behind Hong Kong.Recent research on complexity and networks at the Santa FeInstitute 5 and elsewhere has been contrasting the growth ofcities with biological growth. While this research is at an earlystage, there is clear evidence emerging of the importance of‘laws of scale’:■ decreasing returns to scale, such as vulnerability to thespread of disease or over-density preventing distribution, doexist for cities. Decreasing returns to scale hold cities backfrom growing too large;■ increasing, but diminishing, returns to scale, such as masstransportation, permit cities to be more efficient but ‘tail off’above a certain point.<strong>The</strong>re are, however, examples of increasing, and accelerating,returns to scale. Examples of increasing, and accelerating,returns to scale include a number of network effects such astelephone usage or internet connections. <strong>The</strong> Santa Fe Institutehas found some early evidence of increasing returns to scale incity inventiveness and creativity.Cities are networks, and financial centres are located in cities.Increasing returns to scale come from obvious sources amongthe GFCI’s key success areas. People improve their skills andmarketability by making connections, which is easier in cities.<strong>The</strong> Business Environment improves where trust is high and thecosts of oversight are reduced. In cities, more firms can be seen,compared and evaluated in less time. Market Access benefitsare clear. It is good to be where your customers are, andcustomers gain from being able to make purchase selectionsrapidly. Infrastructure in cities is more efficient.Telecommunications, education and health services are allmore easily delivered where people are concentrated.General Competitiveness shows that a financial centre needsto be good at most things to be a leading centre – successbreeds success and clustering is of vital importance. <strong>The</strong> five5 Pumain, Denise, ScalingLaws and Urban Systems,Santa Fe InstituteWorking Paper – 04-02-002, (August 2003).16
<strong>The</strong> <strong>Global</strong> <strong>Financial</strong> <strong>Centres</strong> <strong>Index</strong>key success factors are discussed in more detail later inthis report.Each respondent to the online surveys only assessed the cities withwhich they were familiar. In order to build the GFCI, the factorassessment model made predictions of how each respondentwould assess the cities they did not know, based on theassessments they gave to cities that they knew.<strong>The</strong> top financial centres, such as London and New York, havelower sensitivity to instrumental factors and narrower variances intheir assessments than other cities, therefore their future GFCIratings are likely to be fairly stable. Other centres, such asWellington and Helsinki, though poorly ranked today, have greatsensitivity to instrumental factors and a wide variance inassessments, thus they may change position significantly.Whether it is pride of ‘ownership’ or ‘regret avoidance’, it is clearthat residents give better city assessments for their home cities thannon-residents do. If we exclude residents’ assessments of their owncities, then on average the score for all cities is 3.4% lower. Somecities, such as Frankfurt and Hong Kong, are significantly boostedby ‘home town’ support while the more ‘international’ centresseem to have a more stable ranking. For example:■ Frankfurt – Non-resident predictions are 7.4% lower thanassessments made by residents;■ Hong Kong – Non-resident predictions are 11.1% lower;■ London – Non-resident predictions are 2.8% lower;■ New York – Non-resident predictions are 2.2% lower;■ Paris – Non-resident predictions are 2.2% lower.Some of the home bias might be explained by specialisation.<strong>Financial</strong> cities other than London or New York are either strong in asector or have a strong domestic market that they represent. Forexample, Hamilton is strong in certain insurance sectors and Zurichis strong in asset management and private banking. Some of thehome bias might be explained by nationalism or a local view of astrong economy meeting international finance. Frankfurt, Sydneyand Paris all represent strong domestic markets on theinternational stage.17
<strong>The</strong> <strong>Global</strong> <strong>Financial</strong> <strong>Centres</strong> <strong>Index</strong>4. Analysis of <strong>Financial</strong> <strong>Centres</strong>Participants seem to choose to place their transactions and theirbusiness based on multiple criteria, so any taxonomic approachhas difficulties. It is a combination of factors that makes a financialcentre successful, not just a single factor.<strong>The</strong> GFCI shows that you need to be good at most things to be aleading centre. London and New York are in top quartile of over80% of the instrumental factors in which they feature. Looking atLondon specifically, it is in the top quartile in 36 out of the 43instrumental factors. So far, where London is weak, for exampleoperating costs, these factors can be seen as problems of success.Commercial and domestic property prices are high and rising inLondon because demand exceeds supply. If people did not wantto locate in London, property prices would fall. It should beremembered that property costs are only one element of overalloperational cost and the commercial property prices in Londonare not currently hindering competitiveness in financial services.In order to explore the GFCI ratings, we examined the correlationof each instrumental factor with the GFCI rating. <strong>The</strong> R2 values (awidely used measure of correlation) were calculated and the tenmost closely correlated instrumental factors are shown in Table 4:Table 4InstrumentalFactorCorrelationwith GFCIInstrumental FactorR2 with GFCI<strong>Financial</strong> Markets <strong>Index</strong> 0.583European Cities Monitor 0.541Capital Access <strong>Index</strong> 0.484<strong>Global</strong> Competitiveness <strong>Index</strong> 0.469World Competitiveness Scoreboard 0.427Price Comparison <strong>Index</strong> 0.405Ease of Doing Business <strong>Index</strong> 0.404Happiness Scores 0.404Opacity <strong>Index</strong> 0.400Nation Brands <strong>Index</strong> 0.384Further analysis of instrumental factor correlation with the GFCIshows that R2 in excess of 80% is achieved using two variables – forexample, the <strong>Financial</strong> Markets <strong>Index</strong> and the <strong>Global</strong>Competitiveness <strong>Index</strong>, both fairly broad measures ofcompetitiveness (for European cities, the European Cities Monitoralso provides very strong correlation with GFCI when modelledwith the <strong>Financial</strong> Markets <strong>Index</strong>). Similarly, R2 results of 90% areachieved using three variables – the <strong>Financial</strong> Markets <strong>Index</strong>, the<strong>Global</strong> Competitiveness Scoreboard and the Nation Brands <strong>Index</strong>.18
<strong>The</strong> <strong>Global</strong> <strong>Financial</strong> <strong>Centres</strong> <strong>Index</strong>We examined how stable the rankings might be in the future. Inorder to do this we needed to contrast the overall ranking withits sensitivity to changes in instrumental factors. Our approachwas to remove one of the five groups of key success factors, andthen re-rank the cities. We looked at how much removing agroup of factors changed city rankings. We then looked at thevariance among the five new scores, which we termed“sensitivity”. If a city’s ranking changed markedly by removingany of the five groups of factors, we anticipated that it had a lotof potential to improve, or decline. If a city’s ranking remainedstable despite removal of each of the groups of factors, we feltthat the city was more likely to remain near its current position.Chart 2 is an overall diagram that contrasts GFCI ratings withincreasing sensitivity.Chart 2<strong>The</strong> 46 <strong>Centres</strong> –GFCI Ratingversus Sensitivityto InstrumentalFactors<strong>Global</strong> <strong>Financial</strong> <strong>Centres</strong> <strong>Index</strong> Rating >LeadersLondon• • New York•Hong Kong•Singapore•Zurich•Frankfurt•SydneyChicago•Geneva••Paris• •San Francisco Tokyo•Boston •Hamilton Edinburgh •Toronto•• • Melbourne•Channel IslandsWashington DC•Cayman Islands •Dublin•Montreal•Luxembourg •Amsterdam•Vancouver•Madrid•Milan•Brussels •Helsinki•Beijing•StockholmEvolving•Shanghai•Dubai•Oslo•Copenhagen ••Wellington Vienna•MumbaiMinor•Seoul•Rome•Prague•Warsaw•Lisbon•Bucharest•Moscow•AthensVolatileSensitivity to Instrumental Factors >19
<strong>The</strong> <strong>Global</strong> <strong>Financial</strong> <strong>Centres</strong> <strong>Index</strong>We believe that this categorisation identifies four types offinancial centre:■ Leaders: obviously London and New York, but also centres withstrong sub-sectors and strong domestic markets;■ Minor: cities that are not rated as highly, and are unlikely toimprove in the near term. It is interesting to note that Rome,Moscow, Mumbai, Seoul and Warsaw fall into this category.Each of these centres have large domestic markets, but seemunlikely to change their poor ratings soon;■ Volatile: cities that are not rated as highly, but might be able tomove upwards rapidly if they could fix some factors.Interestingly, Athens has gained from improvements ininfrastructure due to the 2004 Olympic development, but needssimilar improvements in the other four groups of factors toimprove its competitive position;■ Evolving: cities with high ratings, but susceptible to change. It isinteresting to see that Dubai and Shanghai are alreadymatching established centres such as the Channel Islands andHamilton. Dubai has clearly focused on attracting regionalbusiness, while Shanghai has been the focal point for itsdomestic business. As their financial services broaden anddeepen, we expect these two centres to move towards the“leaders” box.Perhaps the most interesting field is in the centre where cities suchas Madrid, Dublin and Amsterdam compete to become moreattractive to the financial services industry. Canada has threecities all vying here – Toronto, Vancouver and Montreal. Likewise,three Scandinavian cities rival each other – Stockholm,Copenhagen and Oslo. It is tempting to speculate that only a fewof these can move forward. As regulatory conflicts and responsessettle down, however, we expect to see an increasing amount ofbalancing between “quality and cost”.We also looked at the ‘spread’ or variance of the individualassessments given to each city. This variance is plotted against theGFCI rating in Chart 3.20
<strong>The</strong> <strong>Global</strong> <strong>Financial</strong> <strong>Centres</strong> <strong>Index</strong>Chart 3<strong>The</strong> 46 <strong>Centres</strong> –GFCI Ratingversus Varianceof Assessments<strong>Global</strong> <strong>Financial</strong> <strong>Centres</strong> <strong>Index</strong> >London••New York•Frankfurt•Paris•Hong Kong••SingaporeZurich•Sydney• •Tokyo• ChicagoGenevaBoston• •San Francisco Montreal Hamilton•Melbourne •Edinburgh•••Channel•Washington DCIslands•Amsterdam •Dublin •Dubai•Cayman Islands •Luxembourg••PragueShanghai•Madrid•Toronto •Stockholm•Vancouver•Milan•Brussels•Helsinki•Copenhagen •Oslo•Beijing•Vienna•Wellington•Rome•Mumbai•Lisbon•Warsaw•Seoul•Bucharest•Moscow•AthensIncreasing Variance of Assessments >This chart shows that certain centres tend to receive a far broaderrange of assessments than others. On the far right are centres suchas Hamilton, Montreal, Shanghai, Vancouver and the ChannelIslands. <strong>The</strong> assessments given to these centres had a significantlyhigher variance (i.e. some respondents assessed them highly andother respondents assessed them poorly). <strong>The</strong>se centres have themost to gain or lose in future GFCI ratings. <strong>The</strong> centres on the far leftof the chart received far more consistent assessments. In the caseof London and New York, these assessments were consistentlyhigh. In the case of centres such as Frankfurt, Paris, Zurich, HongKong and Singapore, assessments were fairly consistent but lowerthan for London and New York.In Chart 4 we have contrasted the sensitivity and variance ofassessments:21
<strong>The</strong> <strong>Global</strong> <strong>Financial</strong> <strong>Centres</strong> <strong>Index</strong>Chart 4<strong>The</strong> 46 <strong>Centres</strong> –Variance ofAssessmentsversus Sensitivityto InstrumentalFactorsIncreasing Sensitivity to Instrumental Factors >•Dublin•Montreal•Amsterdam•Madrid•Vienna•Copenhagen•Dubai•Warsaw•Athens•Bucharest•StockholmMoscow• •Lisbon•Beijing•Prague •Rome•Toronto•Helsinki•Montreal•Oslo•Wellington•Shanghai•Chicago•Milan•Dublin•Seoul•Zurich•Tokyo•Mumbai• Brussels•Melbourne•Hong Kong•Luxembourg•LondonNew York•Cayman Islands•San Francisco•SydneyEdinburgh• •Singapore•Washington DC•Paris•Geneva •Boston•Frankfurt•Vancouver•Hamilton•ChannelIslandsIncreasing Variance of Assessments >Chart 4 shows three distinct ‘bands’ of financial centres. <strong>The</strong>centres in the top right of the chart, such as Copenhagen, Oslo,Vienna, Wellington, Shanghai or Dubai, have a high sensitivity tochanges in the instrumental factors and a high variance ofassessments. <strong>The</strong>se centres undoubtedly have the highestpotential volatility in GFCI ratings.<strong>The</strong> centres in the bottom left of the chart (including London, NewYork, Paris, Frankfurt, Hong Kong, Singapore, Zurich and Geneva)have a low sensitivity to changes in the instrumental factors and alower variance of assessments. <strong>The</strong>se centres are likely to exhibitthe lowest volatility in future GFCI ratings.<strong>The</strong> GFCI permits sectoral analysis and, over time, we hope tocreate ‘mini-indices’ by business sector i.e. banking, assetmanagement, insurance, professional services and regulatory.While sectoral analysis at this early stage would be premature,Chart 5 contrasts the first GFCI ratings derived from banking sectorrespondents against GFCI ratings derived from non-banking sectorrespondents.22
<strong>The</strong> <strong>Global</strong> <strong>Financial</strong> <strong>Centres</strong> <strong>Index</strong>Chart 5<strong>The</strong> Top 10<strong>Financial</strong><strong>Centres</strong> –BankingRespondentsversusNon-BankingRespondents<strong>Global</strong> <strong>Financial</strong> <strong>Centres</strong> <strong>Index</strong> >800750700650600550500LondonNewYorkHongKongSingaporeZurichFrankfurtSydneyChicagoTokyoGenevaGFCI Banking Sector OnlyGFCI Non-Banking SectorsCity >Chart 5 is an initial indication of how a sectoral split of the GFCImight look. Based on the relatively small sample, it can be seenthat financial centres are seen more favourably by people notinvolved in banking. This might indicate that bankers operate in amore global market place and are less concerned with thecompetitiveness of individual financial centres.23
<strong>The</strong> <strong>Global</strong> <strong>Financial</strong> <strong>Centres</strong> <strong>Index</strong>5. Instrumental FactorsIn this section we examine the five key areas of financial centrecompetitiveness and how these combine to contribute to thecompetitiveness of centres. <strong>The</strong> GFCI factor assessment modelwas run with one set of factors at a time and the results comparedto identify which factors influence which centres.This approach does identify one issue with the instrumental factorsthat have been used. Instrumental factors are used as proxies forsomething that is not directly measurable. A number of theinstrumental factors we used are based on rankings derived at anational level (i.e. country by country). <strong>The</strong>re are clearly regionalvariations within countries and taking a national ‘average’ is likelyto skew the results. When the GFCI model is used with allinstrumental factors there are sufficient city rankings to give anaccurate reflection but when the model is run only using one set offactors (as in the following sections) some of the ratings are undulyinfluenced by the use of these nationally based factors.24
<strong>The</strong> <strong>Global</strong> <strong>Financial</strong> <strong>Centres</strong> <strong>Index</strong>5a. People Factors<strong>The</strong> people factors used in the GFCI (details of these are shown inAppendix C) are:■ Executive MBA <strong>Global</strong> Rankings, <strong>Financial</strong> Times■ European Human Capital <strong>Index</strong>, Lisbon Council■ Human Development <strong>Index</strong>, UNDP■ Labour Productivity, OECD■ Education Expenditure, OECD■ Quality of Living Survey, Mercer HR■ Happiness Scores, NationMaster■ World’s Top Tourism Destination, World Tourism OrganisationChart 6 shows the top ten cities by GFCI rating when only using thepeople related factors in the prediction model.Chart 6<strong>The</strong> Top 10<strong>Financial</strong><strong>Centres</strong> Usingonly PeopleRelatedInstrumentalFactorsCity >LondonNew YorkSan FranciscoChicagoHong KongTorontoSingaporeZurichMontrealBoston500 550 600 650 700 750 800Rating >London and New York occupy 1st and 2nd positions respectivelyon people factors. It is no coincidence that they are consistentlyassessed as having the best people. Several comments from therecent online survey conducted for the GFCI testify to this:What’s important is to make it easy to find the bestemployees from around the world. English speakingcities such as London and New York have a hugeadvantage here.25
<strong>The</strong> <strong>Global</strong> <strong>Financial</strong> <strong>Centres</strong> <strong>Index</strong>Frankfurt, which only a few years ago hadambitions to overturn London as Europe’s keyfinancial centre, now has a dearth of talent – a lotof the good banking people now work in London.Interestingly San Francisco rises by nine places to 3rd, Chicago hasmoved up four places and Boston has also risen. This is largelybecause six of the eight people related instrumental factors arenationally based (compiled on a country by country basis ratherthan being based on specific cities). American cities benefit fromsharing the same values in national indices as New York.Toronto and Montreal have also climbed up the rankings.Canadian cities benefit from the fact that they score well in theQuality of Living survey, NationMaster’s Happiness Scores and theHuman Development <strong>Index</strong>.Hong Kong is in 5th place in the GFCI using people factors. It hasdeveloped strong expertise in professional services. <strong>The</strong> number ofChartered <strong>Financial</strong> Analysts, for example, has increased fromabout 200 in 1995 to more than 3,000. Indeed, Hong Kong has the4th largest number of Chartered <strong>Financial</strong> Analysts in the world afterthe US, Canada and the UK. <strong>The</strong> business cluster surrounding thefinancial services industry is well-developed with more than 5,000solicitors and about 1,000 barristers now practising in Hong Kong 6 .Frankfurt and Sydney have fallen just outside the top ten in thislisting, occupying 11th and 12th places, still above most otherregional and national centres.Earlier research ranked the availability of skilled personnel and theflexibility of the labour market as the most important factors in thecompetitiveness of a financial centre. <strong>The</strong> people who add realvalue in financial centres are often flexible about where they workand factors such as the quality of life, culture and language seemto play an increasingly significant part in their location decisions.Mercer HR assess 215 cities in their Quality of Living Surveyeach year. 39 criteria are used and New York is used as abenchmark with a score of 100. Selected scores of interest areshown in Table 5.266 Securities & FuturesCommission Hong Kong,Hong Kong as a Leading<strong>Financial</strong> Centre,(August 2006).
<strong>The</strong> <strong>Global</strong> <strong>Financial</strong> <strong>Centres</strong> <strong>Index</strong>Table 5Quality ofLiving <strong>Index</strong> –Selected Scores<strong>Financial</strong> CentreQuality of Living <strong>Index</strong>Zurich 108.2Geneva 108.1Vancouver 107.7Vienna 107.5Frankfurt 107.0Sydney 106.5Wellington 105.8Amsterdam 105.7Brussels 105.6Toronto 105.4Melbourne 105.0Luxembourg 104.8Stockholm 104.7Montreal 104.3Dublin 103.8San Francisco 103.2Helsinki 103.1Oslo 102.8Paris 102.7Singapore 102.5Tokyo 102.3Boston 101.9London 101.2Washington D.C. 100.4Chicago 100.4Madrid 100.1New York 100.0Although London appears well down this list of selected cities, it isabove New York and still within the top quartile of the 215 citiescovered. HM Treasury recently highlighted quality of life as one ofLondon’s competitive advantages. 7 <strong>The</strong> arts contribute to thequality of life in a city and London’s arts festivals and institutionsattracted over 10 million visitors in 2005.NationMaster produces a less broadly-based Happiness <strong>Index</strong>compiled simply by asking the question “Taking all things togetherwould you say that you are: very happy, quite happy, not veryhappy or not at all happy?”. <strong>The</strong> sum of the last two options issubtracted from the sum of the first two options to give a score.Sweden, Denmark and Australia are all within the top five, the UK isin 9th place and the US is in equal 13th place with France. Canadais in 17th place, Japan features in 19th and China in 29th. Whenlooking at these ‘national’ indices, it should of course beremembered that there will be regional variations within countries.7 HM Treasury, op. cit.,(March 2006).27
<strong>The</strong> <strong>Global</strong> <strong>Financial</strong> <strong>Centres</strong> <strong>Index</strong>Another instrumental factor used in the GFCI model to assess thepeople factors is the list of top International Tourist Destinationscompiled by the World Tourist Organisation. We used levels oftourism as an instrumental factor for quality of living. This list istopped by France which has a clear lead over Spain, the US andChina. <strong>The</strong> UK is in 6th place, Canada is 12th and Hong Kong 16th.<strong>The</strong> European Human Capital <strong>Index</strong> compiled by the LisbonCouncil, places the UK in 3rd place behind Sweden and Denmarkwith France in 8th place and Germany in 10th. <strong>The</strong> EuropeanHuman Capital <strong>Index</strong> seeks to measure the ability of countries todevelop their human capital through efficient development,deployment and utilisation. <strong>The</strong> UK’s placing backs up the widelyheld perception that the availability of skilled personnel is better inthe UK than in most other European countries.<strong>The</strong> UK fares less well in the Human Development <strong>Index</strong> (HDI) bythe UNDP which puts Australia in 3rd place, followed by Sweden,Canada, Japan and the US in that order. France is in 16th placeand the UK in 18th – still ahead of Germany and many othercountries represented in the GFCI. <strong>The</strong> HDI is a more generalmeasure of development and measures health, standard of livingand knowledge.Specific financial services education is often provided by postgraduatebusiness schools and the list of Executive MBA rankings,compiled by the <strong>Financial</strong> Times is another instrumental factorused in the GFCI model. This overall ranking is based on a detailedassessment of 20 different criteria. It is perhaps no surprise thatmany of the US business schools score very highly. Eight of the topten executive MBAs are from business schools based in the US.London Business School ranks 5th and Insead (headquartered inFrance but with international coverage) ranks 9th. In the UK,business schools attached to Oxford, Cambridge and Manchesteruniversities feature highly in this list as do Cass Business School,Ashridge and Imperial College London. Oxford EconomicForecasting recently highlighted that London benefits from thepresence of a number of world-class universities.Additionally London’s growth has been bolstered by stronginternational immigration – 126,000 people in 2005 (more than halfof the UK total). London benefits from large inflows of professionaland managerial workers. London attracts both skills and talentthrough immigration and allows people to develop those skills inhighly productive activities. In 2005, 32% of London’s workforcepossessed degrees or higher education qualifications (NVQ level 4and 5 or above) 8 , higher than the rest of the UK where thepercentage is 25%.8 Oxford EconomicForecasting, London’sPlace in the UK Economy2006-07, City of London(November 2006).28
<strong>The</strong> <strong>Global</strong> <strong>Financial</strong> <strong>Centres</strong> <strong>Index</strong>5b. Business Environment Factors<strong>The</strong> 15 business environment related instrumental factors (details ofthese are shown in Appendix C) used in the GFCI are:■ Administrative and Economic Regulation, OECD■ Business Environment, Economist Intelligence Unit■ Total Tax Rates, World Bank/PwC■ Corporate Tax Rates, OECD■ Employee Effective Tax Rates, PwC■ Wage Comparison <strong>Index</strong>, UBS■ Personal Tax Rates, OECD■ Total Tax Receipts (As a Percentage of GDP), OECD■ Ease of Doing Business <strong>Index</strong>, World Bank■ Opacity <strong>Index</strong>, Kurtzman Group■ Corruption Perceptions <strong>Index</strong>, Transparency International■ <strong>Index</strong> of Economic Freedom, Heritage Foundation■ Economic Freedom of the World <strong>Index</strong>, Fraser Institute■ <strong>Financial</strong> Markets <strong>Index</strong>, Maplecroft■ Political Risk Score, Exclusive AnalysisChart 7 shows the top ten cities by GFCI ranking when only usingthe business environment related factors in the prediction model.Chart 7<strong>The</strong> Top 10<strong>Financial</strong><strong>Centres</strong> Usingonly BusinessEnvironmentRelatedInstrumentalFactorsCity >LondonNew YorkChicagoHong KongSydneySingaporeZurichFrankfurtTorontoMontreal500 550 600 650 700 750 800Rating >29
<strong>The</strong> <strong>Global</strong> <strong>Financial</strong> <strong>Centres</strong> <strong>Index</strong>Again, London and New York are placed 1st and 2nd respectively.Previous research has indicated that the regulatory environment,a strong component of what we call the ‘business environment’is one of the most important competitiveness factors for afinancial centre.<strong>The</strong>re is however, a continuing debate in financial services as towhether lighter regulation will actually increase the scale of thebusiness. Both sides of this debate have invoked alternativeversions of Gresham’s Law – “good money drives out bad” and“bad money drives out good”. 9London and New York are seen as having generally goodregulatory environments although currently many people arecritical of the US because of what is seen as a ‘heavy-handed’approach to regulating financial services. One quote from theGFCI online survey is typical of a number of other similar comments:New York is becoming far too rules-based andis getting wrapped in red tape (but not as badas Tokyo).<strong>The</strong>re are two sides to the regulatory environment, the quantity andrigour of the regulations themselves and the way in which firms areexpected to comply. Many finance professionals perceive thatregulators, such as the Securities Exchange Commission (SEC),adopt a prescriptive ‘rules based’ approach whilst the <strong>Financial</strong>Services Authority (FSA) has a less prescriptive ‘principles based’approach.It appears that there are two major aspects of regulation that theUS needs to tackle. Firstly, the SEC is good at enforcing the existingregulations but is less strong at ensuring that the financial marketsrun efficiently. Secondly there are too many regulators, forexample, four separate banking regulators and a clash ofresponsibilities between state and federal regulators.<strong>The</strong>re has been much discussion recently about the effect that theSarbanes-Oxley legislation has had on the US financial centres andespecially on New York. It is claimed that London has benefittedfrom Sarbanes-Oxley with international firms preferring to list inLondon rather than in the US. Figures certainly indicate that agreater proportion of international listings are now being hosted byLondon than has been the case in recent history.It is possible to overstate the detrimental effect of one piece oflegislation and forget other sources of competitive disadvantage.A detailed study into the cost of raising capital in various markets9 Mundell, Robert,Uses and Abuses ofGresham’s Law inthe History of Money,Columbia University,(August 1998).30
<strong>The</strong> <strong>Global</strong> <strong>Financial</strong> <strong>Centres</strong> <strong>Index</strong>reported recently that, although significant, the cost of Sarbanes-Oxley compliance was not the biggest cost involved in raisingcapital. 10 <strong>The</strong> biggest cost was the high fees charged by Wall Streetbanks (6.5% to 7% of the value of shares offered against a typicallevel of 3% to 4% in Europe).Of the other leading cities in the GFCI the only other city that hasshown a major change by running the GFCI on businessenvironment factors alone is Chicago. This is because all thebusiness environment instrumental factors are based on nationalscores rather than on individual city scores. Chicago has benefittedfrom having similar values to New York. Toronto and Montreal havejust edged into the top ten, displacing Tokyo and Geneva –Canada does well on many of the regulatory based instrumentalfactors.<strong>The</strong> OECD produces an index of administrative and economicregulation and a selection of the scores is shown in Table 6 (a lowscore indicates more effective regulation).10 Oxera ConsultingLimited, <strong>The</strong> Costof Capital:An InternationalComparison, City ofLondon, (June 2006).Table 6Administrativeand EconomicRegulationCountry Administrative Regulation Economic RegulationUnited Kingdom 0.80 1.40Canada 0.80 1.40Australia 1.00 0.90Norway 1.00 2.30USA 1.10 1.30Denmark 1.10 1.40Ireland 1.10 1.50Sweden 1.10 1.70Finland 1.30 1.90New Zealand 1.40 1.10Portugal 1.50 2.20Luxembourg 1.60 1.50France 1.60 2.30Italy 1.60 2.60Japan 1.70 1.40Austria 1.90 1.50Netherlands 1.90 1.60Germany 1.90 1.80Belgium 1.90 1.80Greece 1.90 2.20Spain 2.00 2.10Switzerland 2.20 2.00Czech Republic 2.40 2.00Poland 2.90 2.7031
<strong>The</strong> <strong>Global</strong> <strong>Financial</strong> <strong>Centres</strong> <strong>Index</strong><strong>The</strong> UK and the US fare well in both of these indices, although onaverage both are behind Australia. Canada, New Zealand andthe Scandinavian countries also perform well. Whilst Hong Kongand Singapore do not feature in this index, several of our surveyrespondents perceive that Hong Kong is above Singapore (andwell ahead of Shanghai) due to more effective regulation.Another instrumental factor used in creating the GFCI is theBusiness Environment ranking compiled by the EconomistIntelligence Unit (this covers nine categories including the politicalenvironment, government policy towards enterprise and foreigninvestment, the foreign trade and tax regime and the taxationstructure of 82 countries). Denmark, Finland and Canada fill thetop three spaces and are followed by Singapore, with the UK in 7thplace, the US in 8th and Hong Kong in 9th.An alternative way of viewing the effect that regulation has on thecompetitiveness of a financial centre is the degree of ‘economicfreedom’ that a particular jurisdiction offers. <strong>The</strong> Fraser Instituteproduces an Economic Freedom indicator which is used in theGFCI model. This contains five components and shows broadlysimilar standings to the Heritage Foundation’s <strong>Index</strong> of EconomicFreedom, with Hong Kong and Singapore at the top and Chinanear the bottom. In this index the US is just ahead of the UK.A further factor for the Business Environment is the World Bank’sEase of Doing Business Indicator. This ranks countries on ten topicsincluding employing people, dealing with licences and otherregulation, paying taxes and enforcing contracts. Singapore topsthis list with the US, Canada, New Zealand, Hong Kong and the UKwithin the top 10 from over 170 countries.<strong>The</strong> GFCI model includes four instrumental factors which give anindication of how ‘fair and just’ a business environment is and howeasy it is for businesses to operate. <strong>The</strong> <strong>Index</strong> of EconomicFreedom, published by the Heritage Foundation, measures tenfactors of economic freedom for over 160 countries. A smallselection of country rankings is shown in Table 7 together withrankings from the Kurtzman Group’s Opacity <strong>Index</strong> and theCorruption Perceptions <strong>Index</strong> published by TransparencyInternational.32
<strong>The</strong> <strong>Global</strong> <strong>Financial</strong> <strong>Centres</strong> <strong>Index</strong>Table 7Country Rankingsin three of theBusinessEnvironmentInstrumentalFactorsCountry <strong>Index</strong> of Opacity CorruptionEconomic Freedom <strong>Index</strong> PerceptionsHong Kong 1 5 15Singapore 2 12 5Luxembourg 4 - 13United Kingdom 5 2 11Denmark 8 2 4New Zealand 9 - 2USA 9 6 17Canada 12 8 14Switzerland 15 8 7<strong>The</strong> Netherlands 16 12 11Austria 18 8 10Sweden 19 2 6Germany 19 14 16Japan 27 16 21Norway 30 - 8France 44 26 18China 111 44 78Russia 122 39 126<strong>The</strong> <strong>Index</strong> of Economic Freedom clearly demonstrates one of thereasons why many finance professionals believe that if there is tobe a third global financial centre in Asia, it is likely not to be on theChinese mainland but in Hong Kong or Singapore.A further aspect of the Business Environment is business culture.Although difficult to measure, this culture can be represented bysome instrumental factors. <strong>The</strong> Kurtzman Group attempt tomeasure one aspect of cultural behaviour in their Opacity <strong>Index</strong>.This is calculated from some 65 variables and examines factorssuch as corruption levels, detrimental economic policy andinadequate governance practices. <strong>The</strong> ratings from this index areshown alongside another, similar instrumental factor, the narrowerCorruption Perceptions <strong>Index</strong> published by TransparencyInternational. <strong>The</strong> UK does well in these indices, appearing abovethe USA in all three as shown in Table 7. In the Opacity <strong>Index</strong> the UKis joint 2nd whilst Hong Kong is 5th and New York is 6th.Another facet of the regulatory environment is the tax regime –both for corporate taxes and personal taxes. A number of therespondents to the GFCI survey believe that the UK is beginningto lose competitive advantage in this area. A typical quote fromour survey:<strong>The</strong> UK used to be a good place to be purely fortax reasons but I’m not sure that this is any longerthe case.33
<strong>The</strong> <strong>Global</strong> <strong>Financial</strong> <strong>Centres</strong> <strong>Index</strong>Several taxation indices were incorporated into the GFCI modelas instrumental factors. <strong>The</strong> first was an adaptation of DoingBusiness, a survey produced by PricewaterhouseCoopers (PwC)for the World Bank. PwC adapted their model to reflect a financialservices firm more accurately than the manufacturing companynorm used in the calculations for the World Bank. <strong>The</strong> model is notjust the ‘headline corporation tax’ rate (although this is also builtinto the GFCI model) but a combination of corporate income tax,social security or other labour taxes and also property andturnover taxes. <strong>The</strong> rates (rounded to the nearest percentagepoint) that apply in some countries are shown in Table 8 togetherwith Effective Employee Tax Rate – again using PwC methodologyand adapting their model to represent, more closely, a financialservices employee.Based on the Total Corporate Tax Rates, London is placedsignificantly ahead of New York, although behind Hong Kong andSingapore which are both well ahead in terms of personal tax rates.London also lags behind three European competitors: Zurich,Geneva and, significantly, Dublin – a city within the European Union.Table 8SelectedCountries –Corporate &Personal TaxRatesCity Total Corporate Tax Rate 2006 Effective Employee Tax Rate 2006Zurich 25% 22%Geneva 25% 28%Dublin 26% 37%Singapore 29% 15%Hong Kong 29% 16%London 35% 34%Warsaw 38% 41%Montreal 43% 39%New York 46% 31%Oslo 46% 38%Amsterdam 48% 44%Prague 49% 39%Sydney 52% 36%Tokyo 53% 29%Vienna 56% 40%Stockholm 57% 47%Frankfurt 57% 37%Budapest 59% 44%Athens 60% 40%Paris 68% 32%Milan 76% 45%Shanghai 77% 30%Mumbai 81% 32%34
<strong>The</strong> <strong>Global</strong> <strong>Financial</strong> <strong>Centres</strong> <strong>Index</strong>5c. Market Access Factors<strong>The</strong> Market Access related instrumental factors (details of theseare shown in Appendix C) used to build the GFCI are:■ Capital Access <strong>Index</strong>, Milken Institute■ Securitisation, IFSL■ Share and Bond Trading – value and volume statistics andinvestment fund trading volumes (5 separate factors), WorldFederation of Exchanges■ <strong>Global</strong> Banking Service <strong>Centres</strong>, GaWC Research■ <strong>Global</strong> Accountancy Service <strong>Centres</strong>, GaWC Research■ <strong>Global</strong> Legal Service <strong>Centres</strong>, GaWC ResearchChart 8 shows the top ten cities by GFCI ranking when only usingthe market access related factors in the prediction model.Chart 8<strong>The</strong> Top 10<strong>Financial</strong><strong>Centres</strong> Usingonly MarketAccess RelatedInstrumentalFactorsCity >LondonNew YorkHong KongSingaporeZurichFrankfurtTokyoSydneyParisChicago500 550 600 650 700 750 800Rating >Of the major financial centres, the top six do not changepositions. This is to be expected – major financial centres havegood access to financial markets. Tokyo moves up from 9th to 7thand Paris climbs into the top ten at the expense of Geneva. This isdue to the fact that Geneva is more of a niche financial centrewith strengths in private banking and asset management but isnot as strong in investment banking and the other major sectorsthat require access to financial markets.35
<strong>The</strong> <strong>Global</strong> <strong>Financial</strong> <strong>Centres</strong> <strong>Index</strong>One of the reasons that London is such a strong financial centre ismarket access – not just direct access to the financial markets butaccess to customers and suppliers of professional services. Tworepresentative quotes from our online survey are:London has huge advantages in terms of itsestablished base of financial institutions andassociated businesses.All the key players, both in banking andprofessional services are based here or at leasthave offices in London, making doing business heremuch easier.New York is similar to London in this respect – it has a wellestablished cluster of professional services organisations whichservice the financial services sector.<strong>The</strong> Capital Access <strong>Index</strong> compiled by the Milken Institute rankscountries on more than 50 measures, including the strength of theirbanking systems and the diversity and efficiency of financialmarkets to generate economic conditions. Table 9 shows thecapital access index of the top 20 countries.<strong>The</strong> UK holds 1st place, with a healthy lead over Hong Kong, withSingapore and the US following closely behind. It is interesting tonote that only two years ago the UK was in 8th position with the USin 1st place.<strong>The</strong> level of Securitisation Issuance (which in effect, givesorganisations chances to convert future cash flow into a lump sumadvance) is another instrumental factor used in the GFCI model.International <strong>Financial</strong> Services, London (IFSL) provides an annualcomparison of issuance values. <strong>The</strong> latest comparison shows theUS in 1st place, well ahead of the UK which is 2nd, with Japan 3rdand Australia 4th.Other trading statistics were built into the GFCI model asinstrumental factors for market access. <strong>The</strong>se statistics were takenfrom the World Federation of Exchange’s monthly Focus report.Figures for the value and volume of share trading, the volume oftrading investment funds, as well as the value and volume of bondtrading were entered into the GFCI model. New York is the leadingcity in terms of trading shares and investment funds, with London2nd and Tokyo in 3rd place in terms of the value of share trading.Tokyo’s high ranking is due to the large volume of domesticissuance whereas New York and London have a large componentof international issuance. Shanghai rates highly in terms of36
<strong>The</strong> <strong>Global</strong> <strong>Financial</strong> <strong>Centres</strong> <strong>Index</strong>Table 9<strong>The</strong> CapitalAccess <strong>Index</strong> –Top 20 CountriesCountryCapital Access <strong>Index</strong>United Kingdom 8.01Hong Kong 7.84Singapore 7.77USA 7.75Sweden 7.62Denmark 7.61Australia 7.60Norway 7.47Finland 7.46Canada 7.42Ireland 7.42Switzerland 7.39<strong>The</strong> Netherlands 7.20New Zealand 7.04Germany 6.93Malaysia 6.88Spain 6.80Chile 6.78Japan 6.76France 6.62investment fund trading, coming 2nd to New York and well aheadof any of the other financial centres.An instrumental factor focusing on access to customers is providedby Research <strong>Global</strong>ization and World Cities – Study Group &Network (GaWC) on <strong>Global</strong> Banking Service <strong>Centres</strong>. This usesdata from ten of the top 25 banks in the world concerning thelocation and size of their offices in different cities. Cities arecategorised into three groups – ‘prime’, ‘major’ and ‘minor’. <strong>The</strong>reare ten prime cities in total, including London, New York, Frankfurt,Paris, Hong Kong and Singapore. Zurich and Milan also appear inthe prime cities list, both of which appear to benefit fromeconomic clustering. Conversely, Vienna, Dublin and Chicago areall detrimentally affected by access factors and they are on the listof minor cities.GaWC also did some similar research into <strong>Global</strong> AccountancyService <strong>Centres</strong> and <strong>Global</strong> Legal Service <strong>Centres</strong>, which are thetwo instrumental factors used as indications of the access tosuppliers of professional services. For the Accountancy Service<strong>Centres</strong>, data from five of the largest accountancy firms in theworld was collected. Cities were rated based on the presence ofthese firms and classified as prime, major or minor centres foraccountancy. <strong>The</strong> prime cities include London, New York, Paris,Frankfurt and Tokyo. Minor cities include Helsinki, Dublin, Osloand Stockholm.37
<strong>The</strong> <strong>Global</strong> <strong>Financial</strong> <strong>Centres</strong> <strong>Index</strong><strong>The</strong> Legal Service <strong>Centres</strong> ratings are based on the number ofoffices that law firms have in a city. Cities were classified as prime,major or minor centres for legal services. All of the top four GFCIcities are included within the ‘prime’ list of cities.38
<strong>The</strong> <strong>Global</strong> <strong>Financial</strong> <strong>Centres</strong> <strong>Index</strong>5d. Infrastructure FactorsIn order to analyse the effect that infrastructure has on the GFCI,we ran the GFCI model using only the six infrastructure-relatedinstrumental factors (details of these are shown in Appendix C).<strong>The</strong> factors are:■ <strong>Global</strong> Office Occupancy Costs, DTZ■ Office Space Across <strong>The</strong> World, Cushman & Wakefield,Healey & Baker■ Competitive Alternatives Survey, KPMG■ Offices With Air Conditioning, Gardiner & <strong>The</strong>obald■ European Cities Monitor, Cushman & Wakefield, Healey & Baker■ <strong>Global</strong> Property <strong>Index</strong>, IPDChart 9 shows the top ten cities by GFCI ranking when only usingthe infrastructure related factors in the prediction model.Chart 9<strong>The</strong> Top 10<strong>Financial</strong><strong>Centres</strong>Using onlyInfrastructureRelatedInstrumentalFactorsCity >LondonNew YorkHong KongTokyoSingaporeZurichFrankfurtParisSydneyCayman Islands500 550 600 650 700 750 800Rating >Using only infrastructure related factors, London and New Yorkoccupy 1st and 2nd positions respectively and Hong Kong is in 3rd.Tokyo has jumped five positions to 4th and Paris has jumped to 8th.Both these cities are long established financial centres and havewell developed business infrastructures that have been built overthe years. <strong>The</strong> top four cities all share relatively high costs and yetare still ranked highly.39
<strong>The</strong> <strong>Global</strong> <strong>Financial</strong> <strong>Centres</strong> <strong>Index</strong>Previous research 11 indicates that the availability of businessinfrastructure is seen as an extremely important factor in thecompetitiveness of a financial centre. <strong>The</strong> quality and availabilityof commercial property is an important part of infrastructure for afinancial centre. <strong>The</strong> ability to travel easily around a city (i.e. thetransport infrastructure) is another key part of businessinfrastructure.A further instrumental factor is office occupancy costs. DTZ’s<strong>Global</strong> Office Occupancy Costs and Cushman & Wakefield,Healey & Baker’s Office Space Across <strong>The</strong> World report twodifferent measures. <strong>The</strong> Cushman & Wakefield, Healey & Bakerreport focuses on total costs of occupying office space, whereasthe DTZ report looks at the straightforward rental costs ofoccupying space. Both reports place London, Paris and Tokyo atthe more expensive end of the scale, with Prague, Melbourne andBudapest at the less expensive end. A selection of scorecomparisons for these two indices is given in Table 10.11 Z/<strong>Yen</strong> Limited, op.cit,(November 2005).Table 10Selected CityScores on OfficeOccupancyCostsCity <strong>Global</strong> Office Office Space AcrossOccupancy Costs<strong>The</strong> World($ per workstation per annum) (Euros per m 2 per annum)Paris 15,700 723London 15,083 1,130Frankfurt 14,071 471New York 10,980 509Tokyo 10,444 1,119Toronto 9,768 353Dublin 9,591 525Stockholm 9,552 388Milan 8,771 425Sydney 8,202 460Seoul 8,138 523Rome 7,929 393Athens 7,571 327Madrid 7,283 414Hong Kong 7,067 1,129Vienna 6,336 300Melbourne 5,102 370Budapest 4,908 314Prague 4,108 270Beijing 3,961 296Singapore 3,926 382Shanghai 3,628 39740
<strong>The</strong> <strong>Global</strong> <strong>Financial</strong> <strong>Centres</strong> <strong>Index</strong><strong>The</strong> figure for New York in the Office Space Across the Worldlisting seems low – it should be noted that this cost includesproperty in a wider area of the city than in London where onlythe West End and City are included. <strong>The</strong> high cost of office spaceis often cited as a problem for cities like London and New York.<strong>The</strong>re seem to be two factors that mitigate this problem:■ <strong>The</strong> cost of office space is only one element in the operationalcosts and efficiency equation. Recent studies by Z/<strong>Yen</strong> 12 showthat cost per person in primary locations are higher than inother locations. Efficiency, as measured by the number ofinvestment banking trades per person, is also much higher. Thisresults in fairly similar cost per trade figures;■ <strong>The</strong> cost of office space is a matter of supply and demandand a problem of success rather than anything else. Peoplemay feel that London, for example, is very expensive. Londonis expensive because people want to rent office space there.If the demand was less, the prices would fall.We used the European Cities Monitor, an index from Cushman &Wakefield, Healey & Baker. This puts London in 1st place, a longway ahead of Paris in 2nd, with Frankfurt in 3rd. Indeed, thepositions of these 3 cities have not changed since the indexstarted in 1990. It was only in 2005 when the top five changedfor the first time with Barcelona continuing its rise up the rankings,moving ahead of Amsterdam into 5th place, after being 11thin 1990.KPMG’s Competitive Alternatives Survey compares businesscosts in 128 cities across nine industrialised countries (Canada,France, Germany, Italy, Japan, Netherlands, Singapore, US andUnited Kingdom). <strong>The</strong> study measures the combined impact of27 significant business cost components that are most likely tovary by location. <strong>The</strong> index places New York 1st, three pointsahead of Frankfurt, which is just ahead of London. It is notablethat Canadian cities seem to fare poorly. Vancouver’s score of96.9 (compared with New York’s top score of 112.6) makes it thehighest placed Canadian city, with Toronto scoring 96.5 andMontreal 94.3.Despite being one of the world’s leading financial centres,London is falling behind other cities when it comes to thedevelopment of its transport network. Complexity in the system,overcrowding, high prices and delays are some of the biggestconcerns expressed by those using the system regularly andthese were highlighted by many comments in our most recentonline survey for the GFCI. One representative comment is that:12 Z/<strong>Yen</strong> Limited, Cost perTrade Surveys, (2003 –2006).41
<strong>The</strong> <strong>Global</strong> <strong>Financial</strong> <strong>Centres</strong> <strong>Index</strong>London suffers from horrendous transport links anda generally overpriced and unpleasantenvironment.In 2003 KPMG reported 13 that London’s record does not comparefavourably with Paris in respect of rail and metro infrastructureinvestment or the perceived effectiveness of these services.London’s record looks better in respect of light rail, rail rolling stockand buses. In 1970 London had a well-developed metro andsuburban rail network. Subsequent development has been verylimited. 38km of rail and metro has been added to the network,compared to 85km in Paris since 1970. London’s transportinfrastructure was built over a long period of time, often bycompeting companies, and much of the system is Victorian. <strong>The</strong>age and complexity of London’s rail networks, both undergroundand suburban heavy rail, inhibits their operational effectiveness ina manner not generally experienced in other cities.<strong>The</strong>re are reports that transport in London may improve. Eurostar isjoining forces with other European rail operators to offer muchfaster journey times between key European cities and with Londonset to host the Olympics in 2012, development of the transportsystem is viewed as essential by many.It is also worth noting that whilst many people complain aboutLondon’s transport infrastructure, it has been less efficient than inmany competing cities for several decades and this has notprevented London becoming a leading global financial centre. Itis interesting to note that people working in London rate thetransport infrastructure as poor but the international perspective isvery different. Cushman & Wakefield, Healey & Baker’s researchshows that the international visitor rates London’s transportinfrastructure as the best in Europe. Clearly people who do notcommute regularly but travel in London outside peak hours thinkthat the system is very good.13 KPMG, ComparativePublic TransportInvestment in MajorEuropean Cities,Corporation of London(November 2003).42
<strong>The</strong> <strong>Global</strong> <strong>Financial</strong> <strong>Centres</strong> <strong>Index</strong>5e. General Competitiveness FactorsIn some financial centres, many of the competitiveness factorscome together and form what might be described as acompetitive critical mass where the whole is greater than the sumof the parts. <strong>The</strong> top cities of the GFCI, especially London and NewYork, demonstrate this critical mass of general competitiveness.<strong>The</strong> GFCI model uses eight general competitiveness relatedinstrumental factors (details of these are shown in Appendix C).<strong>The</strong> factors are:■ Economic Sentiment Indicator, European Commission■ Super Growth Companies, Grant Thornton■ World Competitiveness Scoreboard, IMD■ Retail Price <strong>Index</strong>, <strong>The</strong> Economist■ Price Comparison <strong>Index</strong>, UBS■ Nation Brands <strong>Index</strong>, Anholt■ City Brands <strong>Index</strong>, Anholt■ <strong>Global</strong> Competitiveness <strong>Index</strong>, World Economic ForumChart 10 shows the top ten cities by GFCI ranking when only usingthe general competitiveness related factors in the predictionmodel.Chart 10<strong>The</strong> Top 10<strong>Financial</strong> <strong>Centres</strong>Using onlyGeneralCompetitivenessRelatedInstrumentalFactorsCity >LondonNew YorkChicagoHong KongTokyoMontrealTorontoSydneySingaporeZurich500 550 600 650 700 750 800Rating >43
<strong>The</strong> <strong>Global</strong> <strong>Financial</strong> <strong>Centres</strong> <strong>Index</strong>In this version of the GFCI, Chicago has climbed to 3rd placeand we see a significant jump in the rankings for the Canadiancities of Montreal and Toronto. This is due to Canada being wellranked in the World Competitiveness Scoreboard and the NationBrands <strong>Index</strong>.<strong>The</strong> World Economic Forum’s <strong>Global</strong> Competitiveness <strong>Index</strong>consists of a ranking of 125 world economies based on surveyresults (over 11,000 business leaders were polled). As can be seenin Table 10, the UK is ranked 10th, with six other European countriesahead of it. Switzerland, Finland and Sweden are the top three,with Switzerland climbing from 4th to 1st and Sweden from 7th to3rd in 2006. In 2005 the US was in 1st place but has fallen to 6thposition in 2006. France has also dropped. Table 11 also featuresthe IMD World Competitiveness Scoreboard – an alternativemeasure to the World Economic Forum’s index.Table 11<strong>The</strong> <strong>Global</strong>Competitiveness<strong>Index</strong>Country <strong>Global</strong> Competitiveness <strong>Index</strong> World Competitiveness ScoreboardSwitzerland 1 7Finland 2 9Sweden 3 13Denmark 4 4Singapore 5 3USA 6 1Japan 7 16Germany 8 20Netherlands 9 14UK 10 18Hong Kong 11 2Norway 12 11Canada 16 6Austria 17 12France 18 25Australia 19 5Belgium 20 21Ireland 21 10Luxembourg 22 8New Zealand 23 19Italy 42 32India 43 22Greece 47 29Poland 48 33China 54 1744
<strong>The</strong> <strong>Global</strong> <strong>Financial</strong> <strong>Centres</strong> <strong>Index</strong>Curiously, in both the World Economic Forum and the IMD studies,the UK is lower in the rankings than might be expected. It should,however, be noticed that both these indices are constructed bycountry rather than by city. <strong>The</strong>re are significant regionaldifferences within the UK with London being more competitive,certainly as a financial centre, than other UK cities.Two other General Competitiveness instrumental factors used inthe GFCI are the Nation and City Brand Indices produced byAnholt. <strong>The</strong> City Brand is a measure of how good a city is to live in.<strong>The</strong> index comprises a number of components including a city’sstatus, beauty, climate, economic opportunities, friendliness andlifestyle. Selected City Brand ranks are shown in Table 12.Table 12Selected CityBrand RanksCityCity Brand RankLondon 1Paris 2Sydney 3Rome 4Barcelona 5Amsterdam 6New York 7Los Angeles 8Madrid 9Berlin 10San Francisco 11Toronto 12Geneva 13Washington 14Brussels 15Milan 16Stockholm 17Edinburgh 18Tokyo 19Prague 20Hong Kong 21Singapore 22Rio de Janeiro 23Beijing 24Mexico 25Moscow 2645
<strong>The</strong> <strong>Global</strong> <strong>Financial</strong> <strong>Centres</strong> <strong>Index</strong><strong>The</strong> latest version of the City Brand <strong>Index</strong> shows London in 1st placefollowed by Paris in 2nd. New York is in 7th place and the otherNorth American cities Los Angeles, San Francisco, Toronto andWashington all feature in the top 15 whilst Tokyo, Hong Kong andSingapore are in 19th, 21st and 22nd places respectively. <strong>The</strong>Nation Brand is based on the sum of people’s perceptions of acountry across the following areas of national competence –tourism; exports; people; governance; culture and heritage; andinvestment and immigration. <strong>The</strong> UK is in 1st place, followed bySwitzerland in 2nd and Canada in 3rd. USA is in 10th.Nobody we spoke to believes that London or New York City willlose their positions as global financial centres within the next tenyears. If London and New York fall in popularity it will be due to afundamental, unforeseen, alteration in one or more of the factorsthat make financial centres attractive. Part of the continuingappeal of London to international companies reflects thecosmopolitan nature of London – it is a very international city.London, and to a slightly lesser extent, New York are characterisedby the best international firms doing business with each other –London provides an ideal environment. In an increasinglyinternational economy, London seems to have a solid future as aglobal financial centre.46
<strong>The</strong> <strong>Global</strong> <strong>Financial</strong> <strong>Centres</strong> <strong>Index</strong>6. Overview of Survey ResultsTwo online surveys have been conducted over the past fifteenmonths. Web links to the survey sites were emailed to seniorfinancial services professionals worldwide. 491 responses werereceived (providing 3,992 city assessments). During the last fourmonths of 2006 we averaged 758 city assessments per month.An outline of the responses is given in Tables 13 to 15.Table 13Survey Responsesby SectorSectorNumber of ResponsesBanking 141Asset Management 39Insurance 25Other <strong>Financial</strong> Services 119Professional Services 96Regulatory and Government 20Trade Associations 9Other 42TOTAL 491Table 14Survey Responsesby Number ofEmployees inOrganisationNumber of Employees WorldwideNumber of ResponsesFewer than 100 174100 to 500 68500 to 1,000 341,000 to 2,000 362,000 to 5,000 49More than 5,000 81Unspecified 49TOTAL 491Table 15Survey Responsesby LocationLocationNumber of ResponsesLondon 319Other UK 25Europe 67New York 33Other US 16Asia 19Multiple or Other 12TOTAL 49147
<strong>The</strong> <strong>Global</strong> <strong>Financial</strong> <strong>Centres</strong> <strong>Index</strong>Table 16Current Survey –AssessmentsCity Number of Average Standard DeviationAssessments Assessment of AssessmentsLondon 236 843 1.06New York 172 806 1.31Hong Kong 130 767 1.45Singapore 116 734 1.46Zurich 98 730 1.39Sydney 61 720 1.57Chicago 89 696 1.60Tokyo 90 680 1.80Geneva 73 670 1.68Boston 71 669 1.93San Francisco 65 665 1.92Frankfurt 111 650 1.37Paris 142 646 1.61Edinburgh 77 627 1.92Melbourne 45 627 1.75Dublin 90 618 1.70Amsterdam 81 617 1.45Toronto 58 607 1.87Hamilton 44 602 2.32Channel Islands 55 602 2.37Shanghai 50 598 2.39Dubai 45 596 1.88Cayman Islands 39 595 2.33Luxembourg 53 594 1.84Stockholm 47 577 1.97Madrid 58 571 1.69Montreal 44 570 2.14Brussels 78 563 1.43Milan 52 562 1.66Washington D.C. 62 552 2.06Beijing 44 527 1.86Vancouver 41 524 2.37Vienna 34 521 1.90Copenhagen 47 519 2.02Helsinki 40 508 1.95Rome 42 490 2.02Prague 40 480 1.91Oslo 33 476 2.25Wellington 26 469 2.22Warsaw 35 457 1.93Mumbai 40 455 2.05Lisbon 34 438 1.95Seoul 29 431 2.07Moscow 40 380 1.86Budapest 34 379 1.89Athens 41 366 1.8148
<strong>The</strong> <strong>Global</strong> <strong>Financial</strong> <strong>Centres</strong> <strong>Index</strong><strong>The</strong> results shown in Table 16 relate to the current survey only andrepresent the 251 responses during a four month period at the endof 2006.<strong>The</strong> questions asked in the current online survey are detailed inAppendix B. <strong>The</strong> responses to the open ended questions (numbers15 to 18) of the survey were analysed in some depth. We were ableto gain insight into which of the key areas of competitiveness arecurrently of greatest concern to respondents. Table 17 shows thepercentage of responses that mention the different areas.Table 17Key Areas ofCompetitivenessArea of CompetitivenessPercentage of responsesBusiness Environment 46.2%People 37.2%Infrastructure 29.5%Market Access 12.8%In the previous City of London research in 2003 and 2005,people issues were rated as the most important factors ofcompetitiveness followed by regulatory issues. In this research,people factors have been replaced as the most important factorby the business environment and specifically the regulatory andtax environments. Comments from our respondents show thatthere are two main factors behind this increased importance: first,concerns about the level and quality of financial servicesregulation in the USA and in particular the somewhat draconianmeasures within the Sarbanes-Oxley legislation; second, theconcerns about the increasing levels of corporate taxation in theUK which are beginning to drive companies away from Londontowards more advantageous tax regimes.People factors, specifically the pool of available talent in afinancial centre and the flexibility of the labour market, were thesecond most mentioned of the key areas of competitiveness andare still of great importance.49
<strong>The</strong> <strong>Global</strong> <strong>Financial</strong> <strong>Centres</strong> <strong>Index</strong>7. ConclusionIn this study, and in the 2005 study, London just beats New York tofirst place. In 2003, New York just beat London to first place. Ifcertain types of transaction need a global financial centre, thenLondon or New York are likely to be the obvious locations for theforeseeable future. As one respondent to our survey said:As a global investment bank we just have to havedealers in both New York and London – wewouldn’t be ‘global’ without them.<strong>Financial</strong> centres are where the liquidity is, and market liquidity ishard to move. Having said that, liquidity can occasionally moverapidly if a significant factor changes suddenly (e.g. the Eurobondmarket left the USA for London almost overnight).Once a global centre such as London or New York has beenestablished it is difficult to move. It would take either:■ a number of significant factors, acting over a number of years;■ a fairly dramatic alteration in the status quo.<strong>The</strong>re are not many competitive factors that can alter very quickly.It is most likely to be a change in the regulatory environment (e.g.Sarbanes–Oxley has had a negative impact on New Yorkrecently). <strong>The</strong> UK Government, HM Treasury and the FSA need tobe very careful when changing the regulatory environment. Taxlevels in the UK are currently causing some concern and severallarge companies are leaving the UK because of this. HM Treasuryneeds to ensure that a tax ‘tipping point’ is not reached.Several respondents to our survey raised another possibility thatmight affect the pre-eminence of London and New York. This isthat the ability to deal from anywhere electronically eliminates theneed for a physical location. We do not believe that this willbecome a significant threat to London and New York. <strong>The</strong> welldeveloped critical mass of financial services firms and thesupporting professional service companies, are a very importantfactor in the competitiveness of these global financial centres.What will happen in Asia is still the subject of much conjecture. <strong>The</strong>current GFCI rankings suggest that Hong Kong and Singapore willbecome the two major international centres and Tokyo andShanghai will stabilise as important national centres. In the futurethe GFCI will monitor the competitiveness of other national centresincluding Frankfurt and Sydney and of the major niche centres ofZurich and Geneva. We are likely to be adding at least a couple ofcities to the GFCI in the next update – if sufficient data is availablethen Sao Paulo and Johannesburg are likely contenders.50
<strong>The</strong> <strong>Global</strong> <strong>Financial</strong> <strong>Centres</strong> <strong>Index</strong>For the moment, the most competitive financial centres aregenerally those who exhibit good, and stable, regulation. In thefuture, we may see a return to the quality of the workforce andoperational costs as the most influential factors in financial centrecompetitiveness.Over time, the GFCI financial centre ratings will change. We hopethat in the future the GFCI will help us answer questions such as:■ how quickly can a financial centre gain or lose ground on itscompetitors? (e.g. due to missed opportunities, over-regulationor an unfavourable tax regime)■ can you build a major financial centre from scratch?(We believe that the development of Dubai as a financialcentre will be interesting to monitor)■ is it inevitable that a global financial centre will develop in Asiaas the economic power of the region grows?Please participate in the GFCI by rating the financial centres youare familiar with at: www.cityoflondon.gov.uk/GFCI51
<strong>The</strong> <strong>Global</strong> <strong>Financial</strong> <strong>Centres</strong> <strong>Index</strong>8. AppendicesAppendix A –Methodology<strong>The</strong> GFCI provides ratings for financial centrescalculated by a ‘factor assessment model’ builtusing two distinct sets of input:■ instrumental factors – drawn from externalsources. For example, infrastructurecompetitiveness for a financial centre isindicated by ‘instrumental factors’ includinga cost of property survey and an occupancycosts index; a fair and just businessenvironment is indicated by ratings such as aCorruption Perception <strong>Index</strong> and an Opacity<strong>Index</strong>. Objective evidence of competitivefactors has been sought in instrumentalfactors drawn from a wide variety ofcomparative sources – 47 instrumentalfactors were used to construct this first set ofGFCI ratings. Not all centres have data for allinstrumental factors and the statistical modeltakes account of these gaps;■ financial centre assessments – to constructthe first set of GFCI ratings we used 3,992financial centre assessments drawn from 491respondents to two online surveys.Respondents assessed the competitivenessof financial centres which they knew. <strong>The</strong>second online survey is running continuouslyto keep the GFCI up-to-date with people’schanging assessments.<strong>The</strong> 47 instrumental factors were selectedto reflect the 14 competitiveness factorsidentified in previous research. <strong>The</strong>se are shownin Table 18.At the outset of this project, a number ofguidelines were set out. <strong>The</strong>se guidelines are toensure that city assessments and instrumentalfactors were selected and used in a way thatwill generate a credible, dynamic rating of citycompetitiveness for financial servicesinstitutions.<strong>The</strong> guidelines for independent indices used asinstrumental factors are:■ Indices should come from a reputable bodyand be derived by a sound methodology;■ Indices should be readily available (ideally inthe public domain) and ideally be regularlyupdated (at least annually);Table 18CompetitivenessFactors and theirRelativeImportanceCompetitiveness Factors Rank Average Score<strong>The</strong> availability of skilled personnel 1 5.37<strong>The</strong> regulatory environment 2 5.16Access to international financial markets 3 5.08<strong>The</strong> availability of business infrastructure 4 5.01Access to customers 5 4.90A fair and just business environment 6 4.67Government responsiveness 7 4.61<strong>The</strong> corporate tax regime 8 4.47Operational costs 9 4.38Access to suppliers of professional services 10 4.33Quality of life 11 4.30Culture & language 12 4.28Quality / availability of commercial property 13 4.04<strong>The</strong> personal tax regime 14 3.89Source: Competitive Position of London as a <strong>Global</strong> <strong>Financial</strong> Centre, Corporation of London 200552
<strong>The</strong> <strong>Global</strong> <strong>Financial</strong> <strong>Centres</strong> <strong>Index</strong>■ Relevant indices can be added to the GFCImodel at any time;■ Updates to the indices are collected andcollated quarterly at the end of each quarter;■ No weightings are applied to indices;■ Indices are entered into the GFCI model asdirectly as possible, whether this is a rank, aderived score, a value, a distribution around amean or a distribution around a benchmark;■ If a factor is at a national level, the score willbe used for all cities in that country – nationbased factors will be avoided if city basedfactors are available;■ If an index has multiple values for a city ornation, the most relevant value is used (andthe method for judging relevance is noted);■ If an index is at a regional level, the mostrelevant allocation of scores to each city ismade (and the method for judging relevanceis noted);■ If an index does not contain a value for aparticular city, a blank is entered against thatcity (no average or mean is used). Onlyindices which have values for at least tencities will be included.Creating the GFCI does not involve totaling oraveraging instrumental factors. An approachinvolving totaling and averaging would involvea number of difficulties:■ Indices are published in a variety of differentforms: an average or base point of 100 withscores above and below this; a simpleranking; actual values (e.g. $ per square footof occupancy costs); a composite ‘score’;■ Indices would have to be normalised, e.g. insome indices a high score is positive while inothers a low score is positive;■ Not all cities are included in all indices;■ <strong>The</strong> indices would have to be weighted.<strong>The</strong> guidelines for financial centre assessmentsby respondents are:■ Responses are collected via an online surveywhich runs continuously. A link to this survey isemailed to the target list at regular intervals;■ <strong>The</strong> GFCI is compiled using all cityassessments from the previous 36 months,weighted dependent on when theassessment was made (see Chart 11 below);■ Initially all responses will be included in theGFCI model. As the GFCI becomes moreestablished, a semi-stable list or ‘club’ ofregular respondents (who are senior financialChart 11Log Scale forTime WeightingsLog Multiple >1.21.00.80.60.40.20.0-35 -34 -33 -32 -31 -30 -29 -28 -27 -26 -25 -24 -23 -22 -21 -20 -19 -18 -17 -16 -15 -14 -13 -12 -11 -10-9-8-7-6-5-4-3-2-10Month >53
<strong>The</strong> <strong>Global</strong> <strong>Financial</strong> <strong>Centres</strong> <strong>Index</strong>services professionals) will be developed;■ <strong>The</strong> number of assessments from any city willbe regulated to ensure good representationof all cities in the GFCI. <strong>The</strong> number ofassessments should reflect the followingguidelines:● 50% of the financial centre assessmentsfrom the top ten centres;● no more than 2% of financial centreassessments from any other single centre.<strong>Financial</strong> centre assessments will be includedin the GFCI model for 36 months after theyhave been received. <strong>Financial</strong> centreassessments from the month when the GFCI iscreated are given full weighting and earlierresponses are given a reduced weighting on alog scale as shown in Chart 11.<strong>The</strong> financial centre assessments andinstrumental factors are used to build apredictive model of centre competitivenessusing support vector machine (SVM)mathematics. <strong>The</strong> SVM used for the building ofthe GFCI is PropheZy – Z/<strong>Yen</strong>’s proprietarysystem. SVMs are based upon statisticaltechniques that classify and model complexhistoric data in order to make predictions onnew data. SVMs work well on discrete,categorical data but also handle continuousnumerical or time series data. <strong>The</strong> SVM used forthe GFCI provides information about theconfidence with which each specificclassification is made and the likelihoodof other possible classifications.<strong>The</strong> predictive model was used to answerquestions such as:If an investment banker givesSingapore a certain assessment then,basedon the instrumental factors forSingapore and Paris, how would thatperson assess Paris?OrIf a pension fund manager givesEdinburgh a certain assessment then,based on the instrumental factors forEdinburgh and Zurich, how would thatperson assess Zurich?<strong>Financial</strong> centre predictions from theSVM are combined with actualfinancial centre assessments toproduce the GFCI – a set of financialcentre ratings. This measure ofcompetitiveness is dynamicallyupdated by either an updatedinstrumental factor or new financialcentre assessments. <strong>The</strong>se updatespermit, for instance, a recentlychanged index of rental costs todynamically adjust the competitivenessrating of the centres. <strong>The</strong> process ofcreating the GFCI is outlineddiagrammatically in Chart 12.A few features of building the GFCI using bothinstrumental factors and city assessments areworth noting:■ Several instrumental factors can be used foreach competitive factor and there are likelyto be alternatives available once the GFCI isestablished;■ A strong international group of ‘raters’ canbe developed as the GFCI progresses;■ Sub-GFCI ratings can be developed by usingthe business sectors represented by surveyrespondents. This could make it possible torate London as competitive in Insurance (forinstance) while less competitive in AssetManagement (for instance);■ Over time, as confidence in the GFCI builds,the factor assessment model could bequeried in a ‘what if’ mode – “how muchwould London rental costs need to fall inorder to increase London’s ranking againstNew York?”Part of the process of building the GFCI wasextensive sensitivity testing to changes ininstrumental factors and financial centreassessments. We also tested the accuracy ofpredictions given by the SVM against actualassessments. Over 80% of the predictions madewere accurate to within 5%.<strong>The</strong> authors of this report would like to thankJeremy Horne of Z/<strong>Yen</strong> for all his assistance in54
<strong>The</strong> <strong>Global</strong> <strong>Financial</strong> <strong>Centres</strong> <strong>Index</strong>Chart 12<strong>The</strong> GFCI ProcessInstrumentalFactorInstrumentalFactorInstrumentalFactorInstrumentalFactorInstrumentalFactorCompetitivenessFactorCompetitivenessFactorCompetitivenessFactorCompetitivenessFactorCompetitivenessFactorInstrumentalFactor UpdateChange in <strong>Financial</strong>Centre AssessmentsRegular Online Surveyof <strong>Financial</strong> CentreAssessmentsInstrumental FactorPrediction Engine –PropheZyUpdated GFCI publishedcreating the GFCI. Additionally, a big thankyou goes to John Whiting, Tax Partner atPricewaterhouseCoopers, and Simon Sole,Chief Executive of Exclusive Analysis Limited,for providing unpublished data specifically forthe GFCI. Finally we would like to thank JohnMurray of DMAP Limited and Alan Helmore-Simpson for technical support.55
<strong>The</strong> <strong>Global</strong> <strong>Financial</strong> <strong>Centres</strong> <strong>Index</strong>Appendix B –<strong>The</strong> Online Surveys<strong>The</strong> current survey, with minor updates, runscontinuously and this allows for regular updatesof the GFCI. It is envisaged that approximately3,000 financial centre assessments will becollected each year. Ideally, a semi-stable‘club’ of respondents can be developed. This‘club’ would probably develop two tiers – aclose network of approximately 400 people whoare happy to respond regularly (at least once ayear) and a wider set of interested individuals.<strong>The</strong> key issue is that these respondents shouldprovide a good representation of industrysectors and cities. An emailed copy of theupdated report can be sent to all respondents.7 Approximately how many employees arethere at the headquarters of your organisation?Fewer than 100100 to 500500 to 1,0001,000 to 2,0002,000 to 5,000More than 5,0008 Approximately how many employees doesyour organisation have worldwide?Fewer than 100100 to 500500 to 1,0001,000 to 2,0002,000 to 5,000More than 5,000<strong>The</strong> questions in the most recent survey,launched in August 2006, are as follows:1 Your name.9 In which financial centre are you based?10 Please rate the city where you are based asa location in which to conduct your business(1 being Very Poor to 10 being Excellent).2 What is your job title/main area ofresponsibility?3 <strong>The</strong> name of your organisation.4 Your email address (this will only be used forsending you GFCI updates and will not bepassed to any third party).5 In which industry is your organisation?Investment BankingCommercial BankingRetail BankingInsuranceLegal ServicesAccounting ServicesTrade AssociationRegulatory Body/Central BankGovernmentOther – Please Specify6 In which centre are the headquarters of yourorganisation?11 If you are familiar with any of the followingEuropean centres, please rate them as locationsin which to conduct your business (1 being VeryPoor and 10 being Excellent):AmsterdamAthensBrusselsBudapestCopenhagenDublinEdinburghFrankfurtGenevaHelsinkiLisbonLondonLuxembourgMadridMilanMoscowOsloParisPragueRomeStockholmViennaWarsawZurich56
<strong>The</strong> <strong>Global</strong> <strong>Financial</strong> <strong>Centres</strong> <strong>Index</strong>indicators as a combined measure of bothforms of regulation.Source: www.oecd.orgBusiness Environment, Economist Intelligence Unit(March 2006) – A ranking model applied to theworld’s 82 largest economies (accounting formore that 98% of global output, trade and FDI).It measures the quality of their businessenvironment (adjusted for size) and itscomponents. <strong>The</strong> model is also used to generatescores and rankings for the last five years anda forecast for the next five years.Source: http://store.eiu.comTotal Tax Rates, World Bank/PwC (November2006) – <strong>The</strong> Total Tax Rate measures the amountof tax payable by the business in the second yearof operation, expressed as a share of commercialprofits. It is the sum of all the different taxespayable after accounting for deductions andexemptions. <strong>The</strong> taxes withheld (such as sales taxor value added tax) but not paid by thecompany are excluded. <strong>The</strong> GFCI uses figuresprovided by PwC for a fictional financial servicescompany, rather then for a manufacturingcompany as used for the World Bank.Source: www.doingbusiness.orgCorporate Tax Rates, OECD (September 2006) –<strong>The</strong> OECD provides annual figures of CentralGovernment Corporate Income Tax Rates. Weare using the basic rate (inclusive of surtax) andadjusted to show the net rate where the centralgovernment provides a deduction in respect ofsub-central income tax.Source: www.oecd.orgEmployee Effective Tax Rates, PwC (November2006) – <strong>The</strong> tax rates were calculated by dividingthe net compensation for each city by its grosscompensation. PwC provided specific figures forthe GFCI based on a more typical financialservice employee.Wage Comparison <strong>Index</strong>, UBS (September 2006)– A study comparing gross and net wages ofworkers across 71 cities, using New York as thebase city (with an index of 100). <strong>The</strong> indices werecreated using effective hourly wages for 14professions, weighted according to distribution,net after deductions of taxes and social security.<strong>The</strong> GFCI uses the gross wage index.Source: www.ubs.comPersonal Tax Rates, OECD (September 2006) –<strong>The</strong> OECD provides annual figures of averagepersonal income tax rates at average wages,by family type. For the purposes of our study, weused the all-in rate (a combination of centraland sub-central government income tax, plusemployee social security contribution, as apercentage of gross wage earnings) for a singleperson with no children.Source: www.oecd.orgTotal Tax Receipts (As a Percentage of GDP),OECD (November 2005) – <strong>The</strong> statistics aretaken from the taxation table in the OECD infigures report.Source: www.oecd.orgEase of Doing Business <strong>Index</strong>, World Bank(October 2006) – A ranking was given to 175economies based on their ease of doingbusiness, with a high ranking indicating that theregulatory environment is conducive to theoperation of business. <strong>The</strong> index averages thecountry's percentile rankings on ten topics,made up of a variety of indicators, giving equalweight to each topic.Source: www.doingbusiness.orgOpacity <strong>Index</strong>, Kurtzman Group (October 2004)– 65 objective variables from 41 sources areused to obtain the index, which is a scorebetween 0 and 100, calculated by averagingthe scores given to each of 5 sub indices(corruption, efficacy of legal system,deleterious economic policy, inadequateaccounting/governance practices anddetrimental regulatory structures).Source: www.opacityindex.comCorruption Perceptions <strong>Index</strong>, TransparencyInternational (October 2005) – Expertassessments and opinion surveys are used torank more than 150 countries by their perceivedlevels of corruption. Data is gathered fromsources spanning the last 3 years and wheremultiple years of the same survey are included,all annual data are included to provide asmoothing effect. For sources provided byexperts (which have little change from year to59
<strong>The</strong> <strong>Global</strong> <strong>Financial</strong> <strong>Centres</strong> <strong>Index</strong>year), only the most recent iteration is included.Source: www.transparency.orgmarkets to general economic conditions.Source: www.milkeninstitute.org<strong>Index</strong> of Economic Freedom, HeritageFoundation (January 2006) – A study of 161countries against a list of 50 independentvariables divided into 10 broad factors ofeconomic freedom. <strong>The</strong> higher the score on afactor, the greater the level of governmentinterference in the economy and the lesseconomic freedom a country enjoys.Source: www.heritage.orgSecuritisation, IFSL (March 2006) – A list ofcountries, ordered by their annual value ofsecuritisation issuance. Securitisation offers away for an organisation to convert a futurestable cash flow into a lump sum cashadvance. This is achieved by converting thefuture cash flows into tradable securities whichare sold as a means of raising capital.Source: www.ifsl.org.ukEconomic Freedom of the World <strong>Index</strong>, FraserInstitute (September 2004) – This is a jointventure involving seventy-one researchinstitutes in seventy-one countries around theworld. <strong>The</strong> index is divided into fivecomponents – size of government, legalstructure/security of property rights, access tosound money, freedom to trade internationallyand regulation of credit, labour and business.Source: www.freetheworld.com<strong>Financial</strong> Markets <strong>Index</strong>, Maplecroft(September 2006) – Scores were given tocountries based on their specific risks tofinancial system stability over a short-termfinancial investment time horizon. <strong>The</strong> indexfocuses on five different types of risk –economic, sovereign, banking system, stockmarket and corporate sector – with eachcontaining several different components.Source: http://maps.maplecroft.comPolitical Risk Score, Exclusive Analysis(November 2006) – Scores were given tospecific countries based on expert forecasts ofviolent and political risk worldwide. Forecastsdraw on the expertise of a team of over 200internationally located political risk experts.Source: www.exclusive-analysis.comInstrumental Factors for Market AccessCapital Access <strong>Index</strong>, Milken Institute(October 2005) – An study looking at 121countries representing 92% of global GDP, andranking them on more than 50 measurements,including the strength of their banking systemsand the diversity and efficiency of financialValue of Share Trading/Volume of ShareTrading/Volume of Trading InvestmentFunds/Value of Bond Trading/Volume of BondTrading, World Federation of Exchanges(September 2006) – <strong>The</strong> World Federation ofExchanges provides a monthly newslettercalled FOCUS, which contains monthlystatistics tables. For all of the indicators used,we took the latest available year-to-datefigures.Source: www.world-exchanges.org<strong>Global</strong> Banking Service <strong>Centres</strong>, GaWCResearch (July 1999) – Data for 10 of the top 25banks in the world were used to definesignificant presences. For each significantpresence a city had, it was awarded onepoint.Source: www.lboro.ac.uk<strong>Global</strong> Accountancy Service <strong>Centres</strong>, GaWCResearch (July 1999) – Data from 5 of the 6largest accountancy firms in the world wereused to define significant presences, with eachcity scoring one point for each significantpresence.Source: www.lboro.ac.uk<strong>Global</strong> Legal Service <strong>Centres</strong>, GaWC Research(July 1999) – Cities are scored based on thenumber of particular law branches theycontain. For the UK and the US, cities scorepoints according to the number of law firmswith foreign branches and for the rest of theworld, cities are scored based on the numberof UK/US law branches in the city.Source: www.lboro.ac.uk60
<strong>The</strong> <strong>Global</strong> <strong>Financial</strong> <strong>Centres</strong> <strong>Index</strong>Instrumental Factors for Infrastructure<strong>Global</strong> Office Occupancy Costs, DTZ (January2004) – A guide on accommodation costs inprime office locations, covering 111 businessdistricts in 43 countries worldwide, comparingthe occupancy costs per workstation asopposed to unit area, in order to better reflectthe true costs of accommodation. To facilitateranking on a global scale, total occupancycosts per workstation is expressed in USD.Source: www.propertyoz.com.auOffice Space Across <strong>The</strong> World, Cushman &Wakefield, Healey & Baker (February 2006) –A report focusing on occupancy costs acrossthe globe over the last 12 months, ranking themost expensive locations in which to occupyoffice space.Source: www.cushmanwakefield.comdetermine the overall city scores.Source: www.cushmanwakefield.comIPD <strong>Global</strong> <strong>Index</strong> (December 2006) – <strong>The</strong> IPDglobal property index is intended to measurethe combined performance of real estateinvestments held in mature investment marketsworldwide. This index represents IPD’s firstattempt to create a composite global indexwhich is properly rebalanced to accuratelyreflect national market sizes and reports globalreal estate investment performance in allmajor investor currencies back to the start ofthis decade. <strong>The</strong> index is based on the IPDindices for Austria, Canada, Denmark, France,Germany, Ireland, Italy, the Netherlands,Norway, Portugal, South Africa, Spain,Sweden, Switzerland and the UK.Source: www.ipdglobal.comCompetitive Alternatives Survey, KPMG(January 2006) – A measure of the combinedimpact of 27 cost components that are mostlikely to vary by location, as applied to specificindustries and business operations. <strong>The</strong> eightmonthresearch program covered 128 cities innine industrialised countries, examining morethan 2,000 individual business scenarios,analysing more than 30,000 items of data. <strong>The</strong>basis for comparison is the after-tax cost ofstart-up and operations, over 10 years.Source: www.competitivealternatives.comOffices With Air Conditioning, Gardiner &<strong>The</strong>obald (December 2006) – Using data fromthe International Construction Cost Survey. <strong>The</strong>GFCI uses the mid point of the lowest andhighest cost of an office with air conditioning(given in $ per square foot).Source: www.gardiner.comEuropean Cities Monitor, Cushman &Wakefield, Healey & Baker (September 2006) –An annual study examining the issuescompanies regard as important in decidingwhere to locate their business. <strong>The</strong>re are atotal of 12 issues and the overall scores arebased on survey responses from 507companies in 9 European countries, with eachrespondent ordering the 12 issues in terms ofimportance. A weighting system is then used toInstrumental Factors for GeneralCompetitivenessEconomic Sentiment Indicator, EuropeanCommission (October 2006) – An indicator ofoverall economic activity, based on 15 individualcomponents, split between 5 confidenceindicators, which are weighted in order tocalculate the final score. <strong>The</strong> confidenceindicators (and their weightings) are: industry(40%), services (30%), consumer (20%), retailtrade (5%) and construction (5%).Source: http://ec.europa.euSuper Growth Companies, Grant Thornton(March 2006) – A ranking of countries based onthe proportion of Super Growth Companies(companies which have grown considerablymore than the average measured against keyindicators including turnover and employment)within the country. <strong>The</strong> index is a unique researchproject, forming part of the Grant ThorntonInternational Business Owners Survey (IBOS),which surveys more than 7,000 business owners in30 different countries.Source: www.grantthorntonibos.comWorld Competitiveness Scoreboard, IMD(October 2006) – An overall competitivenessranking for the 61 countries and regionaleconomies covered by the World61
<strong>The</strong> <strong>Global</strong> <strong>Financial</strong> <strong>Centres</strong> <strong>Index</strong>Competitiveness Yearbook. <strong>The</strong> economies areranked from the most to the least competitiveand performance can be analysed on a timeseriesbasis.Source: www.imd.chRetail Price <strong>Index</strong>, Economist (November 2006) –<strong>The</strong> economist provides weekly economic andfinancial indicators, including a chart on pricesand wages. <strong>The</strong> GFCI uses the percentagechange in consumer prices over the last year asa measure of RPI.Source: www.economist.comPrice Comparison <strong>Index</strong>, UBS (September 2006)– Living costs across 71 metropolises arecompared using a basket of 95 goods and 27services. <strong>The</strong> results are used to compile twoindices, one including the costs of housing andenergy (which is the version used for the GFCI)and the other excluding such costs. New Yorkwas used as the base city, with an index of 100.Source: www.ubs.comCity Brands <strong>Index</strong>, Anholt (December 2005) – Ananalytical ranking of the world’s city brands,updated quarterly using survey responses fromnearly 20,000 consumers in 18 countries. <strong>The</strong>results determine how cities are perceived byothers in terms of six components – internationalstatus/standing, physical attributes, potential,pulse and basic qualities (which include hotels,schools, public transport and sports).Source: www.citybrandsindex.com<strong>Global</strong> Competitiveness <strong>Index</strong>, WorldEconomic Forum (September 2006) –A combination of publicly available hard dataand the results of the Executive Opinion Survey(a comprehensive annual survey conducted bythe World Economic Forum, together with itsnetwork of partner institutes in the countriescovered by the report) were used to createrankings of global competitiveness. <strong>The</strong> latestsurvey polled over 11,000 business leaders in125 economies worldwide.Source: www.weforum.orgNation Brands <strong>Index</strong>, Anholt (December 2005) –An analytical ranking of the world's nationbrands, updated each quarter using surveyresponses from 25,900 consumers in 35 nations.<strong>The</strong> survey measures the power and appeal ofa nation’s brand image, telling us howconsumers around the world see the characterand personality of the brand.Source: www.nationbrandindex.com62
<strong>The</strong> <strong>Global</strong> <strong>Financial</strong> <strong>Centres</strong> <strong>Index</strong>9. BibliographyCentre for the Study of <strong>Financial</strong> Innovation,Sizing up the City – London’s Ranking as a<strong>Financial</strong> Centre, Corporation of London,(June 2003).HM Treasury, <strong>Financial</strong> Services in London:<strong>Global</strong> Opportunities and Challenges,(March 2006).KPMG, Comparative Public TransportInvestment in Major European Cities,Corporation of London, (November 2003).McKinsey & Company, Sustaining New York’sand the US’ <strong>Global</strong> <strong>Financial</strong> ServicesLeadership, (January 2007).Mundell, Robert, Uses and Abuses of Gresham’sLaw in the History of Money, Columbia University,(August 1998)www.columbia.eduOxera Consulting Limited, <strong>The</strong> Cost of Capital:An International Comparison, City of London,(June 2006).Oxford Economic Forecasting, London’s Placein the UK Economy 2006-07, City of London,(November 2006).Pumain, Denise, Scaling Laws and UrbanSystems, Santa Fe Institute Working Paper –04-02-002, (August 2003)www.santafe.eduSecurities & Futures Commission Hong Kong,Hong Kong as a Leading <strong>Financial</strong> Centre,(August 2006).Z/<strong>Yen</strong> Limited, <strong>The</strong> Competitive Position ofLondon as a <strong>Global</strong> <strong>Financial</strong> Centre,Corporation of London, (November 2005).Z/<strong>Yen</strong> Limited, Cost Per Trade Survey(Annually – 2003 to 2006).63
<strong>The</strong> <strong>Global</strong> <strong>Financial</strong> <strong>Centres</strong> <strong>Index</strong>64
<strong>The</strong> City of London Corporation<strong>The</strong> City of London is exceptional in manyways, not least in that it has a dedicated localauthority committed to enhancing its status onthe world stage. <strong>The</strong> smooth running of theCity’s business relies on the web of highquality services that the City of LondonCorporation provides.Older than Parliament itself, the City of LondonCorporation has centuries of proven success inprotecting the City’s interests, whether it bepolicing and cleaning its streets or in identifyinginternational opportunities for economicgrowth. It is also able to promote the City in aunique and powerful way through the LordMayor of London, a respected ambassador forfinancial services who takes the City’scredentials to a remarkably wide andinfluential audience.Alongside its promotion of the businesscommunity, the City of London Corporationhas a host of responsibilities which extend farbeyond the City boundaries. It runs theinternationally renowned Barbican Arts Centre;it is the port health authority for the whole of theThames estuary; it manages a portfolio ofproperty throughout the capital, and it ownsand protects 10,000 acres of open space inand around it.<strong>The</strong> City of London Corporation, however,never loses sight of its primary role – thesustained and expert promotion of the ‘City’,a byword for strength and stability, innovationand flexibility – and it seeks to perpetuate theCity’s position as a global business leader intothe new century.