National Market Cow and Bull Beef Quality Audit - Dairy Cattle Edition
National Market Cow and Bull Beef Quality Audit - Dairy Cattle Edition
National Market Cow and Bull Beef Quality Audit - Dairy Cattle Edition
- No tags were found...

You also want an ePaper? Increase the reach of your titles
YUMPU automatically turns print PDFs into web optimized ePapers that Google loves.
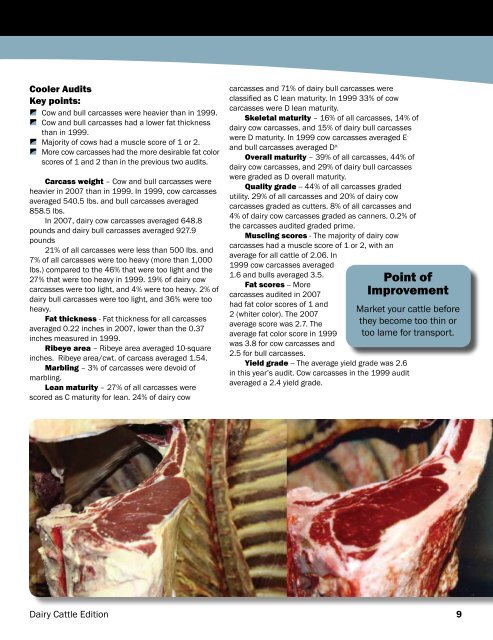
Cooler <strong>Audit</strong>sKey points:<strong>Cow</strong> <strong>and</strong> bull carcasses were heavier than in 1999.<strong>Cow</strong> <strong>and</strong> bull carcasses had a lower fat thicknessthan in 1999.Majority of cows had a muscle score of 1 or 2.More cow carcasses had the more desirable fat colorscores of 1 <strong>and</strong> 2 than in the previous two audits.Carcass weight – <strong>Cow</strong> <strong>and</strong> bull carcasses wereheavier in 2007 than in 1999. In 1999, cow carcassesaveraged 540.5 lbs. <strong>and</strong> bull carcasses averaged858.5 lbs.In 2007, dairy cow carcasses averaged 648.8pounds <strong>and</strong> dairy bull carcasses averaged 927.9pounds21% of all carcasses were less than 500 lbs. <strong>and</strong>7% of all carcasses were too heavy (more than 1,000lbs.) compared to the 46% that were too light <strong>and</strong> the27% that were too heavy in 1999. 19% of dairy cowcarcasses were too light, <strong>and</strong> 4% were too heavy. 2% ofdairy bull carcasses were too light, <strong>and</strong> 36% were tooheavy.Fat thickness - Fat thickness for all carcassesaveraged 0.22 inches in 2007, lower than the 0.37inches measured in 1999.Ribeye area – Ribeye area averaged 10-squareinches. Ribeye area/cwt. of carcass averaged 1.54.Marbling – 3% of carcasses were devoid ofmarbling.Lean maturity – 27% of all carcasses werescored as C maturity for lean. 24% of dairy cowcarcasses <strong>and</strong> 71% of dairy bull carcasses wereclassified as C lean maturity. In 1999 33% of cowcarcasses were D lean maturity.Skeletal maturity – 16% of all carcasses, 14% ofdairy cow carcasses, <strong>and</strong> 15% of dairy bull carcasseswere D maturity. In 1999 cow carcasses averaged E -<strong>and</strong> bull carcasses averaged D o.Overall maturity – 39% of all carcasses, 44% ofdairy cow carcasses, <strong>and</strong> 29% of dairy bull carcasseswere graded as D overall maturity.<strong>Quality</strong> grade -- 44% of all carcasses gradedutility. 29% of all carcasses <strong>and</strong> 20% of dairy cowcarcasses graded as cutters. 8% of all carcasses <strong>and</strong>4% of dairy cow carcasses graded as canners. 0.2% ofthe carcasses audited graded prime.Muscling scores - The majority of dairy cowcarcasses had a muscle score of 1 or 2, with anaverage for all cattle of 2.06. In1999 cow carcasses averagedPoint ofImprovement1.6 <strong>and</strong> bulls averaged 3.5.Fat scores -- Morecarcasses audited in 2007had fat color scores of 1 <strong>and</strong>2 (whiter color). The 2007average score was 2.7. Theaverage fat color score in 1999was 3.8 for cow carcasses <strong>and</strong>2.5 for bull carcasses.Yield grade -- The average yield grade was 2.6in this year’s audit. <strong>Cow</strong> carcasses in the 1999 auditaveraged a 2.4 yield grade.<strong>Market</strong> your cattle beforethey become too thin ortoo lame for transport.<strong>Dairy</strong> <strong>Cattle</strong> <strong>Edition</strong> 9