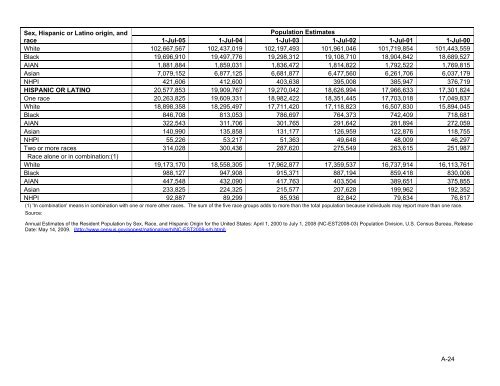
Sex, Hispanic or Latino origin, and<strong>Population</strong> Estimatesrace1-Jul-05 1-Jul-04 1-Jul-03 1-Jul-02 1-Jul-01 1-Jul-00White 102,667,567 102,437,019 102,197,493 101,961,046 101,719,854 101,443,559Black 19,696,910 19,497,776 19,298,312 19,108,710 18,904,842 18,689,527AIAN 1,881,884 1,859,031 1,836,472 1,814,822 1,792,522 1,769,815Asian 7,079,152 6,877,125 6,681,877 6,477,560 6,261,706 6,037,179NHPI 421,606 412,600 403,638 395,008 385,947 376,719HISPANIC OR LATINO 20,577,853 19,909,767 19,270,042 18,626,994 17,966,633 17,301,824One race 20,263,825 19,609,331 18,982,422 18,351,445 17,703,018 17,049,837White 18,898,358 18,295,497 17,711,420 17,118,823 16,507,830 15,894,045Black 846,708 813,053 786,697 764,373 742,409 718,681AIAN 322,543 311,706 301,765 291,642 281,894 272,059Asian 140,990 135,858 131,177 126,959 122,876 118,755NHPI 55,226 53,217 51,363 49,648 48,009 46,297Two or more races 314,028 300,436 287,620 275,549 263,615 251,987Race alone or in combination:(1)White 19,173,170 18,558,305 17,962,877 17,359,537 16,737,914 16,113,761Black 988,127 947,908 915,371 887,194 859,418 830,006AIAN 447,548 432,090 417,763 403,504 389,651 375,855Asian 233,825 224,325 215,577 207,628 199,962 192,352NHPI 92,887 89,299 85,936 82,842 79,834 76,817(1) 'In combination' means in combination <strong>with</strong> one or more o<strong>the</strong>r races. The sum of <strong>the</strong> five race groups adds to more than <strong>the</strong> total population because individuals may report more than one race.Source:Annual Estimates of <strong>the</strong> Resident <strong>Population</strong> by Sex, Race, and Hispanic Origin <strong>for</strong> <strong>the</strong> United States: April 1, 2000 to July 1, 2008 (NC-EST2008-03) <strong>Population</strong> Division, U.S. Census Bureau, ReleaseDate: May 14, 2009. (http://www.census.gov/popest/national/asrh/NC-EST2008-srh.html)A-24
Appendix A.4 Annual Estimates of <strong>the</strong> Resident <strong>Population</strong> by Sex, Race, and Hispanic Origin <strong>for</strong> <strong>the</strong> U.S.Table A.4.3 July 1, 1990 to July 1 1999Sex and<strong>Population</strong> EstimatesRace/Ethnicity 1-Jul-99 1-Jul-98 1-Jul-97 1-Jul-96 1-Jul-95 1-Jul-94 1-Jul-93 1-Jul-92 1-Jul-91 1-Jul-90ALL RACES 272,691,000 270,248,000 267,784,000 265,229,000 262,803,000 260,327,000 257,783,000 255,030,000 252,153,000 249,464,000Male 133,277,000 132,030,000 130,783,000 129,504,000 128,294,000 127,049,000 125,788,000 124,424,000 122,956,000 121,626,000Female 139,414,000 138,218,000 137,001,000 135,724,000 134,510,000 133,278,000 131,995,000 130,606,000 129,197,000 127,838,000WHITE 224,611,000 222,980,000 221,333,000 219,636,000 218,023,000 216,379,000 214,691,000 212,874,000 210,975,000 209,196,000Male 110,336,000 109,480,000 108,624,000 107,749,000 106,920,000 106,067,000 105,208,000 104,287,000 103,297,000 102,399,000Female 114,275,000 113,500,000 112,710,000 111,888,000 111,104,000 110,312,000 109,483,000 108,586,000 107,678,000 106,796,000WHITE, NON-HISPANIC 196,049,000 195,414,000 194,746,000 194,037,000 193,328,000 192,538,000 191,697,000 190,726,000 189,634,000 188,596,000Male 95,962,000 95,590,000 95,207,000 94,810,000 94,418,000 93,985,000 93,539,000 93,028,000 92,433,000 91,901,000Female 100,087,000 99,824,000 99,539,000 99,228,000 98,909,000 98,552,000 98,158,000 97,698,000 97,201,000 96,694,000BLACK 34,862,000 34,427,000 33,989,000 33,537,000 33,116,000 32,672,000 32,195,000 31,683,000 31,137,000 30,629,000Male 16,557,000 16,342,000 16,127,000 15,907,000 15,706,000 15,491,000 15,262,000 15,014,000 14,738,000 14,495,000Female 18,305,000 18,085,000 17,863,000 17,630,000 17,411,000 17,181,000 16,933,000 16,669,000 16,399,000 16,134,000BLACK, NON-HISPANIC 196,049,000 195,414,000 194,746,000 194,037,000 193,328,000 192,538,000 191,697,000 190,726,000 189,634,000 188,596,000Male 15,674,000 15,488,000 15,302,000 15,113,000 14,940,000 14,756,000 14,557,000 14,339,000 14,092,000 13,874,000Female 17,418,000 17,230,000 17,038,000 16,838,000 16,650,000 16,454,000 16,238,000 16,007,000 15,767,000 15,529,000AMERICANINDIAN 2,397,000 2,361,000 2,326,000 2,290,000 2,256,000 2,222,000 2,187,000 2,149,000 2,112,000 2,075,000Male 1,187,000 1,169,000 1,152,000 1,134,000 1,117,000 1,101,000 1,084,000 1,065,000 1,047,000 1,029,000Female 1,211,000 1,192,000 1,174,000 1,156,000 1,138,000 1,121,000 1,103,000 1,084,000 1,065,000 1,046,000AMERICANINDIAN, NON-HISPANIC 2,026,000 2,002,000 1,979,000 1,956,000 1,932,000 1,909,000 1,884,000 1,858,000 1,831,000 1,804,000Male 996,000 985,000 973,000 962,000 951,000 939,000 927,000 915,000 901,000 888,000Female 1,030,000 1,018,000 1,006,000 994,000 982,000 970,000 957,000 944,000 930,000 916,000ASIAN 10,820,000 10,479,000 10,135,000 9,765,000 9,408,000 9,054,000 8,710,000 8,324,000 7,929,000 7,564,000Male 5,196,000 5,039,000 4,881,000 4,714,000 4,551,000 4,390,000 4,234,000 4,057,000 3,874,000 3,703,000Female 5,624,000 5,441,000 5,254,000 5,051,000 4,857,000 4,664,000 4,476,000 4,267,000 4,055,000 3,861,000ASIAN, NON-HISPANIC 10,186,000 9,863,000 9,537,000 9,186,000 8,846,000 8,511,000 8,184,000 7,817,000 7,439,000 7,090,000Male 4,883,000 4,734,000 4,585,000 4,427,000 4,272,000 4,120,000 3,972,000 3,804,000 3,629,000 3,466,000Female 5,303,000 5,129,000 4,952,000 4,759,000 4,574,000 4,390,000 4,212,000 4,013,000 3,810,000 3,624,000HISPANIC 31,337,000 30,252,000 29,182,000 28,099,000 27,107,000 26,160,000 25,222,000 24,283,000 23,391,000 22,571,000A-25