Cost Projections for the Complementary Package of Activities - basics
Cost Projections for the Complementary Package of Activities - basics
Cost Projections for the Complementary Package of Activities - basics
You also want an ePaper? Increase the reach of your titles
YUMPU automatically turns print PDFs into web optimized ePapers that Google loves.
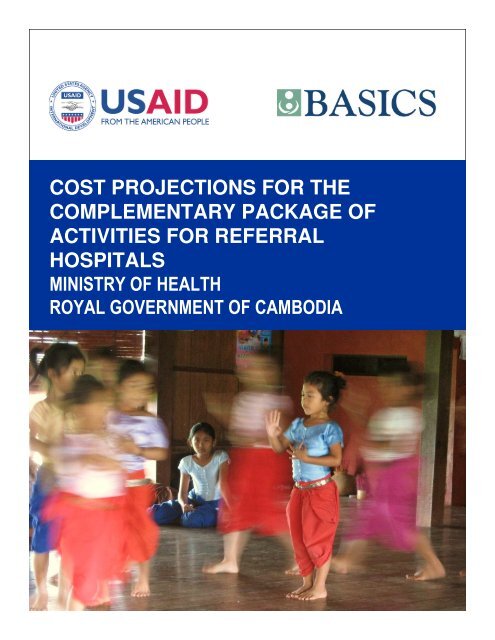
COST PROJECTIONS FOR THECOMPLEMENTARY PACKAGE OFACTIVITIES FOR REFERRALHOSPITALSMINISTRY OF HEALTHROYAL GOVERNMENT OF CAMBODIA
COST PROJECTIONS FOR THECOMPLEMENTARY PACKAGE OFACTIVITIES FOR REFERRALHOSPITALSMINISTRY OF HEALTHROYAL GOVERNMENT OF CAMBODIAFebruary 2009This publication was produced <strong>for</strong> review by <strong>the</strong> United States Agency <strong>for</strong> International Development. Itwas prepared by David Collins, Prateek Gupta, and Em Sovannarith on behalf <strong>of</strong> USAID/BASICS.The author's views expressed in this publication do not necessarily reflect <strong>the</strong> views <strong>of</strong> <strong>the</strong> United StatesAgency <strong>for</strong> International Development or <strong>the</strong> United States Government.
Recommended CitationCollins, David, Prateek Gupta, and Em Sovannarith. 2009. <strong>Cost</strong> <strong>Projections</strong> For The<strong>Complementary</strong> <strong>Package</strong> <strong>of</strong> <strong>Activities</strong> <strong>for</strong> Referral Hospitals: Ministry Of Health, Royal Government <strong>of</strong>Cambodia. Arlington, Va., USA: Basic Support <strong>for</strong> Institutionalizing Child Survival (USAID/BASICS)<strong>for</strong> <strong>the</strong> United States Agency <strong>for</strong> International Development (USAID).U.S. Agency <strong>for</strong> InternationalDevelopmentBureau <strong>for</strong> Global HealthOffice <strong>of</strong> Health, InfectiousDiseases and NutritionRonald Reagan Building1300 Pennsylvania Ave., NWWashington, D.C. 20523Tel: (202) 712-0000Email: globalhealth@phnip.comwww.usaid.gov/our_work/global_healthBASICS4245 N. Fairfax Dr., Suite 850Arlington, VA 22203Tel: (703) 312-6800Fax: (703) 312-6900Email: <strong>basics</strong>@<strong>basics</strong>.orgwww.<strong>basics</strong>.orgSupport <strong>for</strong> this publication was provided by <strong>the</strong> USAID Bureau <strong>for</strong> Global HealthUSAID/BASICS (Basic Support <strong>for</strong> Institutionalizing Child Survival) is a global project to assistdeveloping countries in reducing infant and child mortality through <strong>the</strong> implementation <strong>of</strong> provenhealth interventions. USAID/BASICS is funded by <strong>the</strong> U.S. Agency <strong>for</strong> InternationalDevelopment (contract no. GHA-I-00-04-00002-00) and implemented by <strong>the</strong> Partnership <strong>for</strong>Child Health Care, Inc., comprised <strong>of</strong> <strong>the</strong> Academy <strong>for</strong> Educational Development, John Snow,Inc., and Management Sciences <strong>for</strong> Health. Subcontractors include <strong>the</strong> Man<strong>of</strong>f Group, Inc.,PATH, and Save <strong>the</strong> Children Federation, Inc.The photograph appearing on <strong>the</strong> cover <strong>of</strong> this report was taken and provided by David Collins.
TABLE OF CONTENTSACKNOWLEDGMENTS....................................................................................................................iEXECUTIVE SUMMARY..................................................................................................................ii1. BACKGROUND..................................................................................................................... 12. STUDY OBJECTIVES AND PHASING....................................................................................... 23. METHODOLOGY................................................................................................................... 34. SERVICES ........................................................................................................................... 65. ACTUAL UTILIZATION ........................................................................................................... 76. ACTUAL COSTS..................................................................................................................107. FUNDING SOURCES............................................................................................................158. NORMATIVE COSTS ............................................................................................................179. COMPARISON OF NORMATIVE WITH ACTUAL COSTS ............................................................2110. OTHER COSTING STUDIES..................................................................................................2311. KEY SERVICES...................................................................................................................2512. CONCLUSIONS AND RECOMMENDATIONS ...........................................................................26ANNEXESANNEX 1: CPA SERVICES (COPIED FROM CPA GUIDELINES) .....................................................28ANNEX 2: INPATIENT STATISTICS BY WARD.................................................................................29ANNEX 3: CPA 1 STAFFING STANDARDS FROM CPA GUIDELINES..............................................30ANNEX 4: CPA 2 STAFFING STANDARDS FROM CPA GUIDELINES...........................................31ANNEX 5: CPA 3 STAFFING STANDARDS FROM CPA GUIDELINES..............................................32ANNEX 6: ACTUAL STAFFING NUMBERS FOR 2007......................................................................33ANNEX 7: COST MODEL EXAMPLE FOR CPA 1 HOSPITAL (US$)..................................................34ANNEX 8: COST MODEL EXAMPLE FOR CPA 2 HOSPITAL (US$)..................................................35ANNEX 9: COST MODEL EXAMPLE FOR SMALL CPA 3 HOSPITAL .................................................36ANNEX 10: COST MODEL EXAMPLE FOR MEDIUM CPA 3 HOSPITAL .............................................37ANNEX 11: COST MODEL EXAMPLE FOR LARGE CPA 3 HOSPITAL ...............................................38ANNEX 12: PEOPLE CONSULTED ................................................................................................39ANNEX 13: BIBIOGRAPHY...........................................................................................................41
ACKNOWLEDGMENTSThis study is <strong>the</strong> result <strong>of</strong> a collaborative ef<strong>for</strong>t by <strong>the</strong> Ministry <strong>of</strong> Health (MOH) and <strong>the</strong> UnitedStates Agency <strong>for</strong> International Development (USAID) through <strong>the</strong> Basic Support <strong>for</strong>Institutionalizing Child Survival (USAID/BASICS) Project. The study was coordinated by <strong>the</strong><strong>Cost</strong>ing Task Team <strong>of</strong> <strong>the</strong> Ministry <strong>of</strong> Health (MOH) headed by Dr. Lo Veasnakiry under <strong>the</strong>overall leadership <strong>of</strong> H.E. Pr<strong>of</strong>essor Eng Huot, Secretary <strong>of</strong> State <strong>for</strong> Health.Support and guidance were provided by Dr. Lo Veasnakiry <strong>of</strong> <strong>the</strong> Ministry <strong>of</strong> Health; Ms. KateCraw<strong>for</strong>d and Dr. Sek Sopheanarith <strong>of</strong> <strong>the</strong> United States Agency <strong>for</strong> International Development(USAID); Ms. Maryam Bigdeli and Dr. Niklas Danielsson <strong>of</strong> <strong>the</strong> World Health Organization(WHO); and Dr. Viorica Berdaga and Dr. Rasoka Thor <strong>of</strong> <strong>the</strong> United Nations Children’s Fund(UNICEF).In<strong>for</strong>mation <strong>for</strong> <strong>the</strong> study was ga<strong>the</strong>red from a sample <strong>of</strong> hospitals. Assistance in collecting <strong>the</strong>in<strong>for</strong>mation was provided by Ms. Hilde Schalenbourg and Mr. Sam Sam Oeun <strong>of</strong> Swiss RedCross (SRC); and Dr. Him Phannary <strong>of</strong> Belgian Technical Collaboration (BTC). Assistance wasalso provided by Dr. Heng Vuthy, Dr. Frances Dailey and Mr. Tapley Jordanwood <strong>of</strong> UniversityResearch Corporation (URC). Thanks are also due to o<strong>the</strong>r people who contributed to <strong>the</strong>process and who are listed in Annex 9.The authors <strong>of</strong> <strong>the</strong> report are David Collins, Prateek Gupta and Dr. Em Sovannarith. DavidCollins is Director <strong>of</strong> Finance and Accounting <strong>for</strong> Management Sciences <strong>for</strong> Health (a partnerunder USAID/BASICS) in Cambridge, Massachusetts, USA. At <strong>the</strong> time <strong>the</strong> study was carriedout Prateek Gupta was <strong>the</strong> USAID/BASICS Country Coordinator in Cambodia. Dr. EmSovannarith is an independent consultant based in Phnom Penh.The photograph on <strong>the</strong> cover <strong>of</strong> this report was taken and provided by David Collins.i
EXECUTIVE SUMMARYThe Cambodian Ministry <strong>of</strong> Health (MOH), with assistance from several key donors, hasdeveloped an overarching strategic plan <strong>for</strong> <strong>the</strong> health sector <strong>for</strong> <strong>the</strong> years 2008 through 2015,called <strong>the</strong> Health Strategic Plan, 2008-2015 (commonly referred to as HSP2). This strategicplan is intended to serve as a basis <strong>for</strong> <strong>the</strong> preparation <strong>of</strong> <strong>the</strong> MOH’s operating plans. Hospitalservices are a key element <strong>of</strong> <strong>the</strong>se plans and <strong>the</strong> MOH needs to know <strong>the</strong> cost <strong>of</strong> <strong>the</strong>seservices so that resources can be made available and allocated appropriately to enable <strong>the</strong>hospitals to contribute to <strong>the</strong> achievement <strong>of</strong> <strong>the</strong> HSP2 goals and targets.The services that should be provided at <strong>the</strong> different levels <strong>of</strong> hospital have been defined in a<strong>Complementary</strong> <strong>Package</strong> <strong>of</strong> <strong>Activities</strong> (CPA) (except <strong>for</strong> national hospitals). A CPA 1 hospital isa small district hospital without major surgical services, a CPA 2 hospital is a larger districthospital with major surgical services, and a CPA 3 hospital is <strong>the</strong> equivalent <strong>of</strong> a provincialhospital which acts as a secondary referral facility. The CPA was used as <strong>the</strong> basis <strong>for</strong> costing<strong>the</strong> services and cost models have been developed <strong>for</strong> <strong>the</strong> different types and sizes <strong>of</strong> <strong>the</strong>hospitals. Normative costs were used, using normative staffing levels provided in <strong>the</strong> CPAGuidelines and on cost data collected from a small sample <strong>of</strong> contracting hospitals, which arebelieved to be more adequately resourced.The resources needed to provide <strong>the</strong> CPA at <strong>the</strong> hospitals vary significantly depending on <strong>the</strong>level <strong>of</strong> hospital (CPA 1, 2 or 3) and <strong>the</strong> number <strong>of</strong> occupied beds. Based on <strong>the</strong> norms andassuming a Bed Occupancy Rate (BOR) <strong>of</strong> 85%, <strong>the</strong> number <strong>of</strong> staff needed to operate ahospital and provide a good quality package <strong>of</strong> services varies from 49 persons <strong>for</strong> a 40-bedCPA 1 hospital to 255 persons <strong>for</strong> a 250-bed CPA 3 hospital. The annual cost <strong>of</strong> <strong>the</strong> hospitalsshould range from around $200,000 <strong>for</strong> <strong>the</strong> 40-bed CPA 1 hospital to around $1.1 million <strong>for</strong> <strong>the</strong>250-bed CPA 3 hospital.These figures are sensitive to <strong>the</strong> staffing ratios used. For example, <strong>for</strong> CPA 1 hospitals weused normative ratios <strong>of</strong> 1 doctor (Medical Doctor or Medical Assistant) to 8 occupied beds, 1nurse to 2.8 beds and 1 midwife to 7.5 beds (based on <strong>the</strong> CPA Guidelines). Using thoseratios, a 60-bed CPA 1 hospital would need a total <strong>of</strong> 60 staff and a budget <strong>of</strong> around $260,000.If we change <strong>the</strong> staffing ratios to 1 doctor to 16 occupied beds, 1 nurse to 5.6 beds and 1midwife to 15 beds, <strong>the</strong> total number <strong>of</strong> staff at <strong>the</strong> same 60-bed hospital would be reduced to45 and <strong>the</strong> budget to around $234,000. However, this reduction is likely to affect quality <strong>of</strong> care.It should be noted that <strong>the</strong> staffing numbers have been fixed <strong>for</strong> certain categories <strong>of</strong> staff, suchas laboratory technicians, where a minimum number is needed to run a hospital.The cost per capita depends on <strong>the</strong> size <strong>of</strong> <strong>the</strong> catchment population, <strong>the</strong> level <strong>of</strong> hospital, and<strong>the</strong> number <strong>of</strong> occupied beds. For a 60-bed CPA 1 hospital serving a population <strong>of</strong> 100,000people <strong>the</strong> per capita cost would be $2.62. For an 80-bed CPA 2 hospital serving a catchmentpopulation <strong>of</strong> 200,000 people <strong>the</strong> per capita cost would be $1.88. For a CPA 3 hospital servinga province <strong>of</strong> 2,000,000 people and acting as a second-level provincial referral hospital, <strong>the</strong> percapita cost would be $0.59 cents. This last figure would have to be added to <strong>the</strong> per capita cost<strong>of</strong> <strong>the</strong> various district hospitals in <strong>the</strong> province to arrive at a total per capita cost <strong>for</strong> hospitalservices <strong>for</strong> <strong>the</strong> province. Note that we did not have norms <strong>for</strong> numbers <strong>of</strong> beds per thousandpopulation and <strong>the</strong>se figures do not, <strong>the</strong>re<strong>for</strong>e, represent normative per capita costs.ii
The normative cost per service can be measured as <strong>the</strong> cost per inpatient day equivalent (IDE),which uses a combination <strong>of</strong> inpatient bed days and outpatient services. Based on <strong>the</strong> modeledcosts, <strong>the</strong> cost per IDE would range from $13.19 at a 60-bed CPA 1 hospital to $17.53 at a 100-bed CPA 3 hospital. The cost per IDE <strong>of</strong> a CPA 3 hospital would be less <strong>for</strong> larger hospitals dueto economies <strong>of</strong> scale. At <strong>the</strong> same 60-bed CPA 1 hospital, assuming an Average Length <strong>of</strong>Stay (ALOS) <strong>of</strong> 4.6 days this would translate to an average cost <strong>of</strong> $60.70 per admission. At <strong>the</strong>100-bed CPA 3 hospital with an ALOS <strong>of</strong> 7.3 days <strong>the</strong> average cost per admission would be$127.96.The HSP 2 targets could not be translated into specific hospital targets <strong>for</strong> all services. The HSP2 costing assumed that increases in hospital services would be necessary but that <strong>the</strong>se couldbe provided to some degree through greater and more efficient use <strong>of</strong> existing capacity. Thisseems reasonable since <strong>the</strong>re is a significant gap between <strong>the</strong> average BOR <strong>of</strong> 68% <strong>for</strong> all CPAhospitals in 2007 and <strong>the</strong> optimal BOR <strong>of</strong> 85%, meaning that more inpatients can be treatedwithout having to increase <strong>the</strong> numbers <strong>of</strong> beds. Lowering <strong>the</strong> average ALOS from <strong>the</strong> nationalaverage <strong>of</strong> 7.4 days in 2007 to <strong>the</strong> rates achieved in <strong>the</strong> sample <strong>of</strong> contracting hospital wouldallow even more inpatients to be treated.However, <strong>the</strong> additional cost <strong>of</strong> bringing <strong>the</strong> resources <strong>of</strong> <strong>the</strong> existing hospitals up to <strong>the</strong>normative levels would be significant, especially <strong>for</strong> staffing. For example, Ang Roka Hospital, a60-bed CPA 1 hospital in Takeo Province, had a BOR <strong>of</strong> 84% and an ALOS <strong>of</strong> 4.6 days in 2007and was already operating at close to optimal capacity. However, it only had 26 staff and spent$175,231 in that year, whereas according to <strong>the</strong> norms it should have had 59 staff and a budget<strong>of</strong> around $258,000.As ano<strong>the</strong>r example, Prey Chhor Hospital, a 70-bed CPA 1 hospital in Kampong ChamProvince, had a BOR <strong>of</strong> 61% and an ALOS <strong>of</strong> 6.3 days in 2007. It had 28 staff and spent$170,160 in that year, whereas <strong>for</strong> <strong>the</strong> number <strong>of</strong> services that it provided it should have had 54staff and a budget <strong>of</strong> around $227,000. If it operated at 85% capacity and reduced its ALOS to4.6 days (<strong>the</strong> level at Ang Roka) it would treat almost twice as many inpatients but would require65 staff and a budget <strong>of</strong> around $290,000.The funding <strong>for</strong> <strong>the</strong> sample <strong>of</strong> contracting hospitals used <strong>for</strong> this study came from a variety <strong>of</strong>sources. Between 67% and 83% <strong>of</strong> <strong>the</strong> funds came from <strong>the</strong> Government, most <strong>of</strong> which was indrugs and supplies. User fees, health equity funds and health insurance made up between 12%and 24% <strong>of</strong> total funding. Direct donor assistance made up between 5% and 9% <strong>of</strong> totalfunding. A portion <strong>of</strong> <strong>the</strong> Government funding and <strong>the</strong> health equity funds are also donorfunded. Depending on <strong>the</strong> ability <strong>of</strong> <strong>the</strong> Government to finance <strong>the</strong> increased costs, it is likelythat a significant portion <strong>of</strong> <strong>the</strong> increased funds needed would have to come from user fees andinsurance and from donors, at least in <strong>the</strong> short term.Both <strong>the</strong> actual 2007 costs and <strong>the</strong> normative costs estimated in this study are significantlyhigher than <strong>the</strong> costs used in HSP 2 and in <strong>the</strong> second child survival costing study, and may behigher than figures used in estimating <strong>the</strong> cost <strong>of</strong> <strong>the</strong> reproductive health, HIV/AIDS and TBstrategic plans. The strategic plan costs need to be reviewed and, if necessary, adjusted.This costing model can be used to estimate a budget <strong>for</strong> any referral hospital. However, it isimportant to note that <strong>the</strong> costs are rough estimates. The following recommendations are maderegarding improving <strong>the</strong> quality <strong>of</strong> this in<strong>for</strong>mation.iii
• For this study <strong>the</strong> staffing norms were developed from ranges shown in CPA Guidelinesand drug and supply costs were based on actual amounts provided to <strong>the</strong> hospitals.They may not reflect accurately <strong>the</strong> needs <strong>of</strong> <strong>the</strong> hospitals and <strong>the</strong>y do not take intoaccount differences in patient mix. These figures should be reviewed by <strong>the</strong> MOH andan analysis and determination <strong>of</strong> standard clinical practices should also be carried out todevelop more accurate staffing norms and standard drug and clinical supply needs.• The figures used <strong>for</strong> staff remuneration were based on averages <strong>of</strong> actual payments at<strong>the</strong> sample <strong>of</strong> hospitals. These figures should be reviewed and, if necessary, adjusted.• A more detailed analysis <strong>of</strong> <strong>the</strong> operating costs would also be advisable, since it ispossible that some aspects, such as maintenance, are underfunded and that this maynot have been fully taken into account by <strong>the</strong> hospital directors when <strong>the</strong>y estimated <strong>the</strong>additional funds needed.We also recommend that <strong>the</strong> HSP2 targets be translated into specific service delivery targets.This will assist <strong>the</strong> health centers and hospitals to set targets that will result in <strong>the</strong> achievement<strong>of</strong> HSP2 goals.iv
1. BACKGROUNDThe Cambodian MOH, with assistance from several key donors, has developed an overarchingstrategic plan <strong>for</strong> <strong>the</strong> health sector <strong>for</strong> <strong>the</strong> years 2008 through 2015, called <strong>the</strong> Health StrategicPlan, 2008-2015 (commonly referred to as HSP2). Separate strategic plans <strong>for</strong> priorityprograms, such as Child Survival, Reproductive Health, Malaria and HIV/AIDS, have also beendeveloped with <strong>the</strong> support <strong>of</strong> different donor agencies and have been taken into account inHSP2. HSP2 will serve as a basis <strong>for</strong> <strong>the</strong> preparation <strong>of</strong> 3-Year Rolling Plans and AnnualOperating Plans (AOPs).General cost estimates were prepared <strong>for</strong> HSP2 but <strong>the</strong>se were not detailed enough to providespecific figures <strong>for</strong> <strong>the</strong> 2009/2011 Rolling Plan and <strong>the</strong> 2009 AOP, and in some cases <strong>the</strong>figures were not considered sufficiently accurate <strong>for</strong> that level <strong>of</strong> planning 1 . For example, <strong>the</strong>estimated costs <strong>of</strong> health centre and hospital services were based on a limited analysis <strong>of</strong>historical expenditure, services mixes and utilization levels at a very small sample <strong>of</strong> facilities.The MOH has developed a Minimum <strong>Package</strong> <strong>of</strong> <strong>Activities</strong> (MPA), covering health centre andcommunity services, and a <strong>Complementary</strong> <strong>Package</strong> <strong>of</strong> <strong>Activities</strong> (CPA), covering referralhospital services (excluding national hospitals). These packages include some services whichmay not have been adequately taken into account in <strong>the</strong> HSP2 costing, and <strong>the</strong> numbers <strong>of</strong>services required may differ significantly from those used in deriving <strong>the</strong> figures used in thatcosting. A modeling <strong>of</strong> MPA and CPA costs is, <strong>the</strong>re<strong>for</strong>e, important, especially since <strong>the</strong> HSP2plans and targets assume that <strong>the</strong>se facilities have <strong>the</strong> capacity to scale up different priorityservices, such as child survival, significantly and simultaneously. An accurate modeling <strong>of</strong><strong>the</strong>se costs would provide cost estimates <strong>for</strong> different levels <strong>of</strong> activities and would indicatepossible constraints to scaling up.1 See <strong>Cost</strong>ing <strong>of</strong> Health Strategic Plan (2008-2015) by Mark Pearson.1
2. STUDY OBJECTIVES AND PHASINGTwo studies have been undertaken to model <strong>the</strong> costs <strong>of</strong> <strong>the</strong> MPA and CPA. The models andcost estimates developed are intended to serve as a basis <strong>for</strong> preparing standard budgets <strong>for</strong>facilities that can be used in developing district and provincial plans and budgets <strong>for</strong> rolling plansand AOPs.The studies have been done in two phases. The first phase was <strong>the</strong> costing <strong>of</strong> <strong>the</strong> MPA whichhas been completed 2 .The second phase was <strong>the</strong> costing <strong>the</strong> CPA which is described in this document. The mainobjective was to prepare a standard cost model <strong>of</strong> <strong>the</strong> package <strong>of</strong> services that will:• provide estimates <strong>of</strong> resources required to implement <strong>the</strong> CPA in line with HSP 2targets, and• assist <strong>the</strong> MOH with <strong>the</strong> preparation <strong>of</strong> hospital budgets that can be used in <strong>the</strong> rollingplans and AOPs.The costs produced by <strong>the</strong> study and by using <strong>the</strong> costing models may also be used in <strong>the</strong>future <strong>for</strong> o<strong>the</strong>r purposes, <strong>for</strong> example:• to help set user fee levels and insurance reimbursement rates;• to help set contract per<strong>for</strong>mance incentives;• to help compare per<strong>for</strong>mance across hospitals.2 <strong>Cost</strong> and Funding <strong>Projections</strong> <strong>for</strong> <strong>the</strong> Minimum <strong>Package</strong> <strong>of</strong> <strong>Activities</strong> <strong>for</strong> Health Centres, Ministry <strong>of</strong> Health, RoyalGovernment <strong>of</strong> Cambodia. David Collins, Zina Jarrah and Prateek Gupta. Draft 18 November 2008. USAID/BASICS.2
3. METHODOLOGYThe main source document used <strong>for</strong> in<strong>for</strong>mation on <strong>the</strong> CPA was <strong>the</strong> CPA Guidelines 3 . Thecosting was conducted in two steps. The first step was to estimate <strong>the</strong> actual costs <strong>of</strong> a smallsample <strong>of</strong> hospitals and to estimate <strong>the</strong> costs <strong>of</strong> any additional resources needed by thosehospitals 4 . The second step was to develop normative cost models using <strong>the</strong> in<strong>for</strong>mationga<strong>the</strong>red from <strong>the</strong> sample <strong>of</strong> hospitals and norms from <strong>the</strong> GPA Guidelines. The results were<strong>the</strong>n compared with <strong>the</strong> findings <strong>of</strong> o<strong>the</strong>r costing studies.SAMPLE OF HOSPITALSDue to <strong>the</strong> limited time available <strong>for</strong> <strong>the</strong> study, only a small sample <strong>of</strong> hospitals was used.Hospitals that are under contracting schemes were used since <strong>the</strong> data are generally morecomplete and <strong>the</strong> costs are more likely to reflect <strong>the</strong> resources needed to run <strong>the</strong> hospitals at agood level <strong>of</strong> quality. For example, staff remuneration levels are higher and includeper<strong>for</strong>mance incentive payments.The sample comprised 4 hospitals in Takeo and Kampong Cham provinces. In Takeo we usedAng Roka Hospital, a district-level CPA 1 hospital, and Kirivong Hospital, a district-level CPA 2hospital. These are both supported under <strong>the</strong> contracting programme managed by Swiss RedCross (SRC). In Kampong Cham we used Kampong Cham Provincial Hospital, a provinciallevelCPA 3 hospital, and Prey Chhor, a district-level CPA 1 hospital. These are both supportedunder <strong>the</strong> contracting programme managed by Belgian Technical Cooperation (BTC).Kampong Cham Hospital was given a good rating by University Research Corporation (URC) in2007 in areas such as infrastructure and management 5 . An evaluation <strong>of</strong> Ang Roka Hospitaland Kirivong Hospital by Swiss Red Cross concluded that both hospitals were “<strong>of</strong> higherstandard than normally encountered in Cambodia with 24 hours coverage and routinemonitoring <strong>of</strong> patient condition”. The evaluation reported that surveys indicated close to 100%client satisfaction in both hospitals 6 .We made several visits to <strong>the</strong> hospitals and also collected data at <strong>the</strong> national level. The datacollected were as follows:3 National Guidelines on <strong>Complementary</strong> <strong>Package</strong> <strong>of</strong> <strong>Activities</strong> <strong>for</strong> Referral Hospital Development from 2006 to 2010.Second Version, 15 December 2006. Ministry <strong>of</strong> Health, Kingdom <strong>of</strong> Cambodia.4 Former District Hospitals (FDHs), which are large health centres with some inpatient services o<strong>the</strong>r than deliverieswere not included under this study due to <strong>the</strong> lack <strong>of</strong> time.5 The assessment covered Hospital Management, Administration, infrastructure and equipment, organization <strong>of</strong>wards and departments, documentation and recording <strong>of</strong> in<strong>for</strong>mation, referral system, staff satisfaction and generalhygiene.6 Contracting <strong>of</strong> Health Services: Ang Rokar and Kirivong Operational Districts, Takeo Province, Cambodia. FinalEvaluation Report. Sheryl Keller, Jean-Marc Thome and Jean-Yves Dekestier. April 2008. Swiss Red Cross.3
• Numbers <strong>of</strong> services were obtained from <strong>the</strong> national Health In<strong>for</strong>mation System andsome <strong>of</strong> <strong>the</strong>se data, such as <strong>the</strong> numbers <strong>of</strong> beds, were confirmed at <strong>the</strong> hospitals.• Income and expenditure data were obtained from routine reports prepared by <strong>the</strong>hospitals. In <strong>the</strong> case <strong>of</strong> <strong>the</strong> Takeo hospitals, <strong>the</strong> data were taken from records kept bySRC based on reports and o<strong>the</strong>r in<strong>for</strong>mation provided by <strong>the</strong> District Offices.• Details <strong>of</strong> staffing, including numbers and types <strong>of</strong> staff, assignments and pay, weretaken from staffing reports and additional in<strong>for</strong>mation was provided by <strong>the</strong> hospitalmanagers,• In<strong>for</strong>mation was also collected from a small sample <strong>of</strong> patient records at three <strong>of</strong> <strong>the</strong> fourhospitals to allow us to estimate <strong>the</strong> resources used <strong>for</strong> some <strong>of</strong> <strong>the</strong> key interventions.• The hospital directors provided verbal estimates <strong>of</strong> additional resources needed.Our initial intention was to get sufficient in<strong>for</strong>mation from <strong>the</strong> hospitals to allocate <strong>the</strong> staff, drugsand clinical supplies to <strong>the</strong> various inpatient departments. However, in<strong>for</strong>mation on <strong>the</strong>allocation <strong>of</strong> staff was not always specific enough, especially where employees work in morethan one department. We were also not able to get sufficient in<strong>for</strong>mation on <strong>the</strong> cost <strong>of</strong> drugsand medical supplies issued to each department. It appears that records <strong>of</strong> <strong>the</strong>se issues arenot always kept, and if <strong>the</strong>y are, <strong>the</strong>y are not priced. Since we were not able to get sufficientin<strong>for</strong>mation to allocate <strong>the</strong>se costs accurately we grouped all <strong>the</strong> inpatient departments toge<strong>the</strong>r.We could only prepare rough estimates <strong>of</strong> <strong>the</strong> total pay <strong>for</strong> each staff member, which is made up<strong>of</strong> several elements, such as salary, overtime and shares <strong>of</strong> user fees and incentives. Itappears that complete up to date records <strong>of</strong> total pay by employee may not always bemaintained.The study was aimed primarily at estimating <strong>the</strong> recurrent cost <strong>of</strong> <strong>the</strong> hospitals. We did notinclude capital costs or depreciation, or any expenditure required <strong>for</strong> upgrading <strong>the</strong> facilities.This was partly because <strong>the</strong>se costs are not typically included in <strong>the</strong> recurrent budget <strong>for</strong> <strong>the</strong>hospital and partly because preparing <strong>the</strong>se estimates is very time consuming and our time waslimited. We also did not include costs incurred at o<strong>the</strong>r levels <strong>of</strong> <strong>the</strong> health system, such astraining costs covered under o<strong>the</strong>r budgets or district or provincial management costs.It is important to note that <strong>the</strong> actual cost figures obtained from <strong>the</strong> sample hospitals represent<strong>the</strong> expenditures made on resources provided to <strong>the</strong> hospitals. These costs were <strong>the</strong>re<strong>for</strong>econstrained by <strong>the</strong> amounts <strong>of</strong> resources provided and did not represent <strong>the</strong> costs that shouldhave been incurred to provide <strong>the</strong>se services. In o<strong>the</strong>r words, <strong>the</strong>se were not necessarily <strong>the</strong>costs <strong>of</strong> providing good quality services. Even when we include <strong>the</strong> additional needs estimatedby <strong>the</strong> hospital directors it is not likely that <strong>the</strong>se adjusted costs reflect <strong>the</strong> real resource needs<strong>of</strong> <strong>the</strong> hospitals.4
NORMATIVE COST MODELSThe second step was to develop a simple model <strong>for</strong> each type <strong>of</strong> hospital, which was doneusing spreadsheets. A separate model was prepared <strong>for</strong> <strong>the</strong> CPA 1 and CPA 2 hospitals andthree separate models were developed <strong>for</strong> <strong>the</strong> CPA 3 hospitals, based on <strong>the</strong> numbers <strong>of</strong> beds.The costs are driven by several variables. The numbers <strong>of</strong> staff and <strong>the</strong> cost <strong>of</strong> drugs andsupplies are driven by <strong>the</strong> numbers <strong>of</strong> services, which are defined as <strong>the</strong> number <strong>of</strong> inpatientdays and <strong>the</strong> number <strong>of</strong> outpatient services. The number <strong>of</strong> inpatient days is a function <strong>of</strong> <strong>the</strong>number <strong>of</strong> <strong>of</strong>ficial beds at <strong>the</strong> hospital multiplied by <strong>the</strong> bed occupancy rate. The number <strong>of</strong>outpatient services is entered directly.An average cost per inpatient day <strong>for</strong> drugs and supplies was estimated using <strong>the</strong> actual figures<strong>for</strong> each level <strong>of</strong> hospital in <strong>the</strong> sample, taking into account <strong>the</strong> need <strong>for</strong> additional drugsidentified by <strong>the</strong> hospital directors.For <strong>the</strong> numbers <strong>of</strong> each type <strong>of</strong> staff, norms were derived from <strong>the</strong> ranges <strong>of</strong> staff shown in <strong>the</strong>CPA guidelines. The average compensation per type <strong>of</strong> employee was taken from <strong>the</strong> hospitalsample, and since <strong>the</strong> hospitals were all operating under contracting programmes, it wasassumed that <strong>the</strong>se levels <strong>of</strong> compensation were adequate.The operating costs were derived from <strong>the</strong> sample <strong>of</strong> hospitals using <strong>the</strong> actual costs andadditional costs needed as identified by <strong>the</strong> hospital directors. For <strong>the</strong> CPA 1 and CPA 2hospitals <strong>the</strong>se were treated as fixed costs because <strong>the</strong> range <strong>of</strong> beds is relatively small. For<strong>the</strong> CPA 3 hospitals, where <strong>the</strong> range <strong>of</strong> beds is greater, we treated part <strong>of</strong> <strong>the</strong> operating costsas fixed and set <strong>the</strong> remainder to vary in proportion with <strong>the</strong> numbers <strong>of</strong> services.The figures used in <strong>the</strong> model are <strong>the</strong> 2007 costs and have not been inflated.Fur<strong>the</strong>r details <strong>of</strong> <strong>the</strong> normative costs are provided on page 18.5
4. SERVICESThe package <strong>of</strong> services that should be provided by <strong>the</strong> CPA 1, 2 and 3 hospitals is shown inAnnex 1. In 2007 <strong>the</strong> sampled hospitals provided <strong>the</strong> services set out in <strong>the</strong> guidelines with <strong>the</strong>following exceptions:• None <strong>of</strong> <strong>the</strong> hospitals reportedly had physio<strong>the</strong>rapists on staff and so could not,presumably, provide Kinetic Therapy services. They may, <strong>the</strong>re<strong>for</strong>e, also lackequipment and supplies.• Kirivong Hospital did not have emergency care beds or discharges according to <strong>the</strong> HIS,but it is assumed that o<strong>the</strong>r beds were used <strong>for</strong> those services.• Ang Roka and Kirivong hospitals did not appear to have dental services.In line with <strong>the</strong> Guidelines, Ang Roka and Prey Chhor hospitals did not have operating <strong>the</strong>atres,and yet <strong>the</strong>y had surgical beds and reported surgical discharges. It is assumed that those bedswere used <strong>for</strong> non-surgical patients. The HIS did not show if any <strong>of</strong> <strong>the</strong> beds were designated<strong>for</strong> AIDS patients and does not show discharges <strong>for</strong> AIDS o<strong>the</strong>r than at <strong>the</strong> clinic level.6
5. ACTUAL UTILIZATIONA summary <strong>of</strong> <strong>the</strong> key utilization in<strong>for</strong>mation derived from <strong>the</strong> HIS <strong>for</strong> <strong>the</strong> four hospitals is shownin Table 1. A breakdown on inpatient services by department is shown in Annex 2.Table 1: Key utilization ratesCPA 1 Ang Roka -ActualCPA 1 Prey ChhorCPA 2 Kirivong -ActualCPA 3 KampongCham - ActualServicesCatchment population 133,056 178,296 226,994 1,673,307Outpatient consultations 4,459 2,244 7,854 0Inpatient discharges and deaths 4,031 2,492 6,502 13,983Hospitalization days 18,381 15,596 35,439 101,749Official number <strong>of</strong> beds 60 70 80 260ALOS 4.6 6.3 5.5 7.3BOR 84% 61% 121% 107%Surgical activities - major - - 312 2,081Minor surgery 165 - 225 -Deliveries and abortions 149 207 899 1,522Dental - 618 - 1,050Lab examinations (including malaria) 14,412 6,969 13,211 139,702Blood bank - collected and consumed - - 26 4,951Radiography etc 1,116 139 862 6,789Of <strong>the</strong> two CPA 1 hospitals, Ang Roka hospital seems to have operated at a higher level <strong>of</strong>efficiency in 2007, with a bed occupancy rate (BOR) <strong>of</strong> 84% and an average length <strong>of</strong> stay(ALOS) <strong>of</strong> 4.6 days. This can be compared with Prey Chhor hospital which has a BOR <strong>of</strong> 61%and an ALOS <strong>of</strong> 6.3 days, and which had much lower numbers <strong>of</strong> inpatient discharges,outpatient consultations, laboratory examinations and radiography services. Prey Chhor hadmore Medicine beds and less TB beds than Ang Roka (Annex 2) but this would not appear to bea good reason <strong>for</strong> <strong>the</strong> apparent under-utilization <strong>of</strong> Prey Chhor services.We compared <strong>the</strong> numbers <strong>of</strong> services with those in <strong>the</strong> previous year to see if 2007 wasexceptional. The number <strong>of</strong> services at Ang Roka was higher in 2007 than in 2006, when it had2,617 inpatient discharges, 15,050 bed days (hospitalization days) and a BOR <strong>of</strong> 69%. TheALOS shortened from 5.6 days in 2006 to 4.6 days in 2007. The number <strong>of</strong> services at PreyChhor was slightly higher in 2007 than in 2006, when it had 1,981 inpatient discharges and15,446 bed days. However, <strong>the</strong> BOR was almost <strong>the</strong> same at 60%. The ALOS shortened from7.8 days in 2006 to 6.3 days in 2007. In both cases, <strong>the</strong>se figures appear to be a reflection <strong>of</strong> atrend <strong>of</strong> increased use ra<strong>the</strong>r than 2007 being an exceptional year, although a major outbreak <strong>of</strong>dengue fever in 2007 was also a factor at Ang Roka.In terms <strong>of</strong> <strong>the</strong> mix <strong>of</strong> inpatient services, pediatric services were <strong>the</strong> services most used at AngRoka hospital in 2007, representing 57% <strong>of</strong> <strong>the</strong> discharges and 45% <strong>of</strong> <strong>the</strong> inpatient days.According to <strong>the</strong> HIS, 45% <strong>of</strong> <strong>the</strong>se children were treated <strong>for</strong> dengue fever 7 , 43% <strong>for</strong> ARI and7 Again note <strong>the</strong> major outbreak <strong>of</strong> dengue fever in 2007.7
12% <strong>for</strong> diarrhea. 3% <strong>of</strong> inpatient discharges were deliveries, 2% were TB patients (24% <strong>of</strong> beddays) and 14% were classified as O<strong>the</strong>r 8 .Pediatric services were also <strong>the</strong> services most used at Prey Chhor hospital in 2007, with 38% <strong>of</strong><strong>the</strong> discharges and 33% <strong>of</strong> <strong>the</strong> inpatient days. According to <strong>the</strong> HIS, 52% <strong>of</strong> <strong>the</strong>se childrenwere treated <strong>for</strong> dengue fever, 33% <strong>for</strong> ARI and 15% <strong>for</strong> diarrhea and related conditions. 9% <strong>of</strong>inpatient discharges were deliveries, 1% were TB patients (10% <strong>of</strong> bed days) and 20% wererecorded as O<strong>the</strong>r.Of <strong>the</strong>se two CPA 1 hospitals, <strong>the</strong> costs <strong>of</strong> Ang Roka may provide a more reliable basis <strong>for</strong> <strong>the</strong>modeling since <strong>the</strong> overall per<strong>for</strong>mance is closer to optimal. It is not clear if <strong>the</strong> mix <strong>of</strong> servicesis close to that required to meet <strong>the</strong> HSP 2 targets since those targets have not been translatedinto numbers <strong>of</strong> hospital services. The number <strong>of</strong> deliveries may, however, have been on <strong>the</strong>low side.Kirivong, <strong>the</strong> CPA 2 hospital, had a BOR <strong>of</strong> 121% in 2007 and an ALOS <strong>of</strong> 5.5 days 9 . The BORincreased from 101% in 2006 and <strong>the</strong> ALOS decreased from 6.2 days. Again <strong>the</strong> increase inutilization appears to be part <strong>of</strong> a trend although <strong>the</strong> outbreak <strong>of</strong> dengue fever also contributed.In terms <strong>of</strong> service mix, 39% <strong>of</strong> <strong>the</strong> discharges at Kirivong were Pediatric, 30% were Medicine,17% were Maternity and 13% were Surgical. The breakdown <strong>of</strong> bed days was 37% Pediatric,29% Medicine, 17% Surgical and 13% Maternity. 1% <strong>of</strong> total discharges were TB (4% <strong>of</strong> beddays) and 30% were O<strong>the</strong>r. Of <strong>the</strong> Pediatric discharges, 36% were treated <strong>for</strong> ARI, 32% <strong>for</strong>diarrhea and related ailments, and 31% were treated <strong>for</strong> dengue fever.At Kampong Cham Hospital <strong>the</strong> BOR was 107% in 2007, having increased from 94% in 2006.The number <strong>of</strong> discharges increased from 11,038 in 2006 and <strong>the</strong> ALOS decreased from 8.1days in 2006 to 7.3 days in 2007. In terms <strong>of</strong> service mix, 28% <strong>of</strong> <strong>the</strong> discharges werePediatric, 25% were Medicine, 24% were Surgical and 17% were Maternity. The breakdown <strong>of</strong>bed days was 31% Surgical, 28% Medicine, 16% Pediatric and 13% Maternity. 2% <strong>of</strong> totaldischarges were TB (9% <strong>of</strong> bed days) and 33% were O<strong>the</strong>r. Of <strong>the</strong> Pediatric discharges, 53%were treated <strong>for</strong> dengue fever, 31% <strong>for</strong> ARI and 16% <strong>for</strong> diarrhea and related ailments.To check <strong>the</strong> impact <strong>of</strong> <strong>the</strong> reported dengue fever outbreak in 2007 we compared pediatricdischarges over <strong>the</strong> two years (dengue fever admission should all be pediatric). Thecomparison showed that <strong>the</strong> 2006 pediatric discharges were much lower than those figures <strong>for</strong>2007. Ang Roka had 918 pediatric discharges in 2006 compared with 2,298 in 2007, Kirivonghad 1,339 compared with 2,508, and Kampong Cham had 2,635 compared with 3,914. Thefigure <strong>for</strong> Prey Chhor was also lower in 2006, being 771 compared with 949, but <strong>the</strong> differenceis less, perhaps because dengue fever was less prevalent in this area. However, <strong>the</strong> increasesin pediatric discharges does not account <strong>for</strong> all <strong>the</strong> overall increases in services among <strong>the</strong> fourhospitals among and it, <strong>the</strong>re<strong>for</strong>e, confirms that <strong>the</strong>re has been a general trend <strong>of</strong> increasinginpatient utilization.In terms <strong>of</strong> patient mix, pediatric patients were <strong>the</strong> biggest patient category in all hospitals(partly because <strong>of</strong> <strong>the</strong> high number <strong>of</strong> dengue fever treatments). Pediatric services were also<strong>the</strong> largest user <strong>of</strong> bed days in <strong>the</strong> CPA 1 and 2 hospitals, with Surgical services <strong>the</strong> largestuser in <strong>the</strong> CPA 3 hospital. TB patients accounted <strong>for</strong> only a small proportion <strong>of</strong> discharges, buta significant proportion <strong>of</strong> bed days at Ang Roka and Kampong Cham.8 The “O<strong>the</strong>r” category in <strong>the</strong> HIS is presumably used when <strong>the</strong> diagnosis does not fit with one if <strong>the</strong> predeterminedHIS categories.9 The BOR rate in excess <strong>of</strong> 100% is reportedly due to additional un<strong>of</strong>ficial beds ra<strong>the</strong>r than sharing <strong>of</strong> beds.However, reporting errors may also be a factor.8
A comparison <strong>of</strong> <strong>the</strong> ALOS across <strong>the</strong> hospitals shows that Kampong Cham had <strong>the</strong> highestwith 7.3, which is to be expected since it is a higher level hospital and should be dealing withmore complex cases. Kirivong had a rate <strong>of</strong> 5.5, which is less than at Kampong Cham andmore than at Ang Roka, which should also reflect <strong>the</strong> level <strong>of</strong> complexity <strong>of</strong> cases. KampongCham and Kirivong both carry out major surgery, which should result in longer ALOS rates. AtAng Roka and Kampong Cham Hospitals <strong>the</strong> ALOS are figures are increased to some degreebecause <strong>the</strong>y have more TB patients who have long ALOS.Prey Chhor had higher ALOS levels than Ang Roka in all areas except <strong>for</strong> TB, which mayindicate some inefficiency at Prey Chhor. Interestingly <strong>the</strong> TB ALOS is much shorter at Kirivongand Kampong Cham than at Prey Chhor. It can also be noted that <strong>the</strong> maternity ALOS wasmuch lower at Ang Roka Hospital, at 1.4 compared with 4.2 at Prey Chhor and Kirivong.Differences among <strong>the</strong> Bed Occupancy Rates (BOR) <strong>for</strong> different wards may indicate that somebeds are being used <strong>for</strong> services o<strong>the</strong>r than <strong>the</strong> designated ones.In terms <strong>of</strong> outpatient services, Kirivong had <strong>the</strong> highest number <strong>of</strong> outpatient services (7,854)and <strong>of</strong> <strong>the</strong> two CPA 1 hospitals, Ang Roka had <strong>the</strong> highest number with 4,459. No outpatientservices were recorded in <strong>the</strong> HIS <strong>for</strong> Kampong Cham Hospital but we heard that some CPA 3hospitals may be providing outpatient services at specialty clinics. If so, it is not clear if, or how,<strong>the</strong>se are reported in <strong>the</strong> HIS – hopefully not as inpatient services which would distortper<strong>for</strong>mance indicators, staffing ratios and costs.9
Table 3: <strong>Cost</strong> per capita (US$)Per Capita <strong>Cost</strong> by Input Type (US$)CPA 1 AngRoka - ActualCPA 1 PreyChhorCPA 2Kirivong -ActualCPA 3KampongCham -ActualStaff 0.30 0.24 0.44 0.22Drugs and clinical supplies 0.79 0.55 1.10 0.35Operating costs 0.23 0.17 0.22 0.08Total 1.32 0.95 1.76 0.65Ano<strong>the</strong>r important way to compare costs is to calculate how much is spent on average on eachservice. This is typically done by calculating <strong>the</strong> average cost per inpatient bed day or perdischarge. Since <strong>the</strong>se hospitals provide both outpatient and inpatient services, we used a ratio<strong>of</strong> outpatient costs to inpatient costs to produce a cost per inpatient day equivalent (IDE). Weestimated this ratio <strong>for</strong> each hospital - in <strong>the</strong> case <strong>of</strong> Ang Roka it was 0.25, which means thatfour outpatient services had <strong>the</strong> equivalent cost <strong>of</strong> one inpatient bed day. To calculate <strong>the</strong> totalnumber <strong>of</strong> bed days equivalent we, <strong>the</strong>re<strong>for</strong>e, divided <strong>the</strong> number <strong>of</strong> outpatient services by 4and added <strong>the</strong> result to <strong>the</strong> number <strong>of</strong> inpatient days. It should be noted that Kampong Chamdoes not <strong>of</strong>ficially have any outpatients and it is possible that any specialist outpatient visits arerecorded as inpatient services in <strong>the</strong> HIS.The cost per service varies with <strong>the</strong> total cost and with <strong>the</strong> total number <strong>of</strong> IDEs. However, italso varies with <strong>the</strong> mix <strong>of</strong> services, not just in terms <strong>of</strong> outpatient versus inpatient services, butalso in terms <strong>of</strong> <strong>the</strong> type <strong>of</strong> inpatient treatment. For example, <strong>the</strong> relative numbers <strong>of</strong> TB casesand bed days will affect <strong>the</strong> cost, as will <strong>the</strong> prevalence <strong>of</strong> certain conditions, such as denguefever. We would, however, expect that normally <strong>the</strong> cost per IDE <strong>for</strong> CPA 1 hospitals is broadlysimilar since <strong>the</strong> types <strong>of</strong> service provided should be <strong>the</strong> same. With a higher level <strong>of</strong> care at aCPA 2 hospital, we would expect <strong>the</strong> cost per IDE to be higher, and higher again at a CPA 3hospital.Although <strong>the</strong> cost per IDE should be similar at <strong>the</strong> two CPA 1 hospitals, it can be seen fromTable 4 that <strong>the</strong> cost was much higher at Prey Chhor ($10.35) than at Ang Roka ($8.98). Since<strong>the</strong> total expenditure is similar at <strong>the</strong> two hospitals, <strong>the</strong> difference is mainly because Prey Chhorprovided fewer services (16,438 IDEs compared with 19,509). Ang Roka operated with areasonably efficient BOR <strong>of</strong> 84%, whereas <strong>the</strong> BOR <strong>for</strong> Prey Chhor was only 61%. Ang Rokahad more TB patients but it is not clear what impact that would have on costs, except that TBdrugs are expensive.Kirivong had a cost per IDE <strong>of</strong> $10.67, which was higher than <strong>the</strong> cost <strong>for</strong> Ang Roka. This wasappropriate because it is a CPA 2 hospital. However, <strong>the</strong> extra cost <strong>of</strong> <strong>the</strong> higher level <strong>of</strong> carewas probably <strong>of</strong>fset to some degree by <strong>the</strong> large number <strong>of</strong> services provided (37,526 IDEs).With a BOR <strong>of</strong> 121%, Kirivong operated in excess <strong>of</strong> full capacity 10 , and assuming that <strong>the</strong>staffing level and operating expenditures were not increased to cover <strong>the</strong> additional patients,<strong>the</strong>se unit costs per service would have been artificially low. Hopefully <strong>the</strong> quantity <strong>of</strong> drugs was10 As discussed later in this document a BOR <strong>of</strong> 85% is considered <strong>the</strong> optimal rate.11
increased to cover <strong>the</strong> increased patient load, but if not that unit cost would also have beenartificially low.Kampong Cham had a cost <strong>of</strong> $10.73, which was slightly higher than <strong>the</strong> cost at Kirivong. As aCPA 3 hospital <strong>the</strong> difference should probably be greater, and it is notable that <strong>the</strong> drugs costper IDE is lower, which should not be <strong>the</strong> case <strong>for</strong> a higher level hospital. Like Kirivong,Kampong Cham also operated in excess <strong>of</strong> full capacity (with a BOR <strong>of</strong> 107%), and, <strong>for</strong> <strong>the</strong>same reasons, <strong>the</strong> unit staffing cost, drugs cost and operating cost may have been artificiallylow.Table 4: <strong>Cost</strong> per inpatient day equivalent (US$)<strong>Cost</strong> per bed day equivalent (US$)CPA 1 AngRoka - ActualCPA 1 PreyChhorCPA 2Kirivong -ActualCPA 3KampongCham -ActualStaff 2.03 2.56 2.67 3.60Drugs and clinical supplies 5.40 5.97 6.68 5.75Operating costs 1.56 1.82 1.32 1.38Total 8.98 10.35 10.67 10.73Ratio <strong>of</strong> OP visit to IP day cost 0.25 0.29 0.27 naInpatient Days Equivalent 19,509 16,438 37,526 101,749The average cost per inpatient discharge should also be higher at a higher level hospital,because <strong>the</strong> higher level hospitals should have more complex services and higher averagelengths <strong>of</strong> stay. As can be seen from <strong>the</strong> Table 5, <strong>the</strong> cost is indeed lowest at Ang Roka($40.96), higher at Kirivong ($58.16) and highest at Kampong Cham ($78.07). The figure <strong>of</strong>$64.78 <strong>for</strong> Prey Chhor is, again, much higher than <strong>the</strong> figure <strong>for</strong> Ang Roka because <strong>the</strong>utilization level is much lower. It should be noted again that <strong>the</strong> Kirivong and Kampong Chamhospital costs may be artificially low, as explained above.12
Table 5: <strong>Cost</strong> per discharge (US$)CPA 1 AngRoka - ActualCPA 1 PreyChhorCPA 2Kirivong -ActualCPA 3KampongCham -Actual<strong>Cost</strong> per discharge (US$)Staff 9.24 16.02 14.55 26.21Drugs and clinical supplies 24.60 37.34 36.40 41.82Operating costs 7.11 11.42 7.22 10.04Total 40.96 64.78 58.16 78.07Average Length <strong>of</strong> Stay 4.56 6.26 5.5 7.3Table 6 shows <strong>the</strong> average cost per outpatient service. Since <strong>the</strong> costs are calculated usingratios, <strong>the</strong> relationship among <strong>the</strong>se costs is similar to <strong>the</strong> relationship among <strong>the</strong> inpatientcosts. No outpatient services were shown in <strong>the</strong> HIS <strong>for</strong> Kampong Cham Provincial Hospital.These costs are higher than <strong>the</strong> average cost <strong>of</strong> $1.40 per curative service across <strong>the</strong> 11contracting health centres included in <strong>the</strong> MPA costing sample, which is expected since some <strong>of</strong><strong>the</strong> hospital services are referrals and should, <strong>the</strong>re<strong>for</strong>e, be more complex. Also <strong>the</strong> hospitalshave higher operating costs.Table 6: <strong>Cost</strong> per outpatient serviceCPA 1 AngRoka - ActualCPA 1 PreyChhorCPA 2Kirivong -ActualCPA 3KampongCham -Actual<strong>Cost</strong> per Outpatient service (US$)Staff 0.51 0.75 0.71 naDrugs and clinical supplies 1.36 1.76 1.77 naOperating costs 0.39 0.54 0.35 naTotal 2.27 3.05 2.84 naWe were able to compare <strong>the</strong> costs <strong>for</strong> <strong>the</strong> Ang Roka and Kirivong hospitals with <strong>the</strong> figures <strong>for</strong><strong>the</strong> previous year. Ang Roka Hospital had a total cost <strong>of</strong> $175,231 in 2007 (Table 2), which wasa significant increase from <strong>the</strong> total <strong>of</strong> $109,468 spent in 2006. The main reason was <strong>the</strong>increase in <strong>the</strong> cost <strong>of</strong> drugs provided by CMS which rose from $35,989 in 2006 to $105,256 in2007. As noted in <strong>the</strong> previous section, <strong>the</strong> hospital provided many more services in 2007 thanin 2006. Kirivong Hospital had a total cost <strong>of</strong> $400,442 in 2007 compared with $271,970 in2006. The main reason was again <strong>the</strong> increased cost <strong>of</strong> drugs from CMS which rose from$149,528 in 2006 to $250,579 in 2007. This hospital also provided many more services in 2007than in 2006.We asked <strong>the</strong> hospital directors to provide rough estimates <strong>of</strong> <strong>the</strong> additional resources that <strong>the</strong>ywould have needed in 2007 to operate at full capacity with good quality <strong>of</strong> care. The additionalestimated needs were $46,098 <strong>for</strong> Ang Roka, $56,098 <strong>for</strong> Prey Chhor, $44,852 <strong>for</strong> Kirivong and$99,034 <strong>for</strong> Kampong Cham. The increases were 26%, 33%, 11% and 9%, respectively. Interms <strong>of</strong> staff Ang Roka said <strong>the</strong>y needed 14 more than <strong>the</strong> 26 <strong>the</strong>y had, Prey Chhor needed 17more than <strong>the</strong> 28 <strong>the</strong>y had, Kirivong needed 19 more than <strong>the</strong> 49 <strong>the</strong>y had, and Kampong Cham13
needed 15 more than <strong>the</strong> 219 <strong>the</strong>y had. The total costs per inpatient day equivalent including<strong>the</strong>se additional resources are shown in Table 7.Table 7: <strong>Cost</strong> per inpatient day equivalent including additional resource need estimatesCPA 1 Ang Roka - CPA 1 PreyNeeded ChhorCPA 2 Kirivong -NeededCPA 3 KampongCham - Needed<strong>Cost</strong> per bed day equivalent (US$)Staff 3.04 4.44 3.55 3.88Drugs and clinical supplies 6.74 6.86 6.81 5.81Operating costs 1.56 2.46 1.51 2.02Total 11.35 13.76 11.87 11.70Ratio <strong>of</strong> OP visit to IP day cost 0.25 0.29 0.27 naInpatient Days Equivalent 19,509 16,438 37,526 101,74914
7. FUNDING SOURCESThe 2007 sources <strong>of</strong> funding <strong>for</strong> <strong>the</strong> four hospitals are shown in figures in Table 9 and inpercentages in Table 10. These figures are slightly different from <strong>the</strong> total expendituresbecause some <strong>of</strong> <strong>the</strong> user fee income is transferred to Treasury and because, in some cases,hospitals can carry unspent balances <strong>for</strong>ward.Between 67% and 83% <strong>of</strong> <strong>the</strong> funds came from <strong>the</strong> Government, most <strong>of</strong> which was in drugsand supplies, and some <strong>of</strong> which is donor-funded. User fees, health equity funds and healthinsurance made up between 12% and 24% <strong>of</strong> total funding. Direct donor assistance made upbetween 5% and 9% <strong>of</strong> total funding.The largest single source <strong>of</strong> funding <strong>for</strong> all four hospitals was <strong>the</strong> drugs and supplies receivedfrom CMS 11 , which was over 50% <strong>of</strong> funding in all hospitals except <strong>for</strong> Kampong Cham, where itwas 42%. It is notable that user fees were much lower at Prey Chhor (12%) than at <strong>the</strong> o<strong>the</strong>r 3hospitals (20% to 24%). Direct donor funding was higher at Kampong Cham due to donateddrugs.Table 9: Funding sources 2007CPA 1PreyChhorCPA 3KampongChamUS$CPA 1 AngRokaCPA 2KirivongUser fees 19,957 6,280 55,019 208,644Health Equity Funds 12,637 16,005 24,740 75,261Health insurance 3,801 - 3,154 -Fees <strong>for</strong> service 36,394 22,286 82,913 283,905GoC Salaries 7,111 16,018 14,758 71,941GoC Overtime 2,791 351 8,059 8,320GoC Operating costs 24,779 23,190 33,619 165,232GOC Incentives 615 2,623 2,000 42,862CMS - drugs and clinical supplies 100,763 111,406 235,101 491,656Government funds 136,059 153,588 293,536 780,012Donor Salaries 1,527 - 1,541 -Donor overtime 502 588 298 -Donors - drugs and supplies - - - 32,982Donor incentives 7,015 9,138 22,704 67,792Donor funds (not through Government) 9,044 9,727 24,543 100,774TOTAL 181,497 185,601 400,993 1,164,690Table 10: Funding sources <strong>for</strong> 2007 as a percentage <strong>of</strong> total funding11 Some <strong>of</strong> <strong>the</strong> drugs provided by CMS may also be provided by donors, but we do not have sufficient in<strong>for</strong>mation todo this analysis thoroughly.15
CPA 1PreyChhorCPA 3KampongChamUS$CPA 1 AngRokaCPA 2KirivongUser fees 11% 3% 14% 18%Health Equity Funds 7% 9% 6% 6%Health insurance 2% 0% 1% 0%Fees <strong>for</strong> service 20% 12% 21% 24%GoC Salaries 4% 9% 4% 6%GoC Overtime 2% 0% 2% 1%GoC Operating costs 14% 12% 8% 14%GOC Incentives 0% 1% 0% 4%CMS - drugs and clinical supplies 56% 60% 59% 42%Government funds 75% 83% 73% 67%Donor Salaries 1% 0% 0% 0%Donor overtime 0% 0% 0% 0%Donors - drugs and supplies 0% 0% 0% 3%Donor incentives 4% 5% 6% 6%Donor funds (not through Government) 5% 5% 6% 9%TOTAL 100% 100% 100% 100%16
8. NORMATIVE COSTSSimple spreadsheet models were developed <strong>for</strong> each type <strong>of</strong> hospital so that <strong>the</strong> MOH caneasily produce an estimated normative cost using <strong>the</strong> number <strong>of</strong> beds, <strong>the</strong> bed occupancy rateand <strong>the</strong> number <strong>of</strong> outpatient services. We prepared one model <strong>for</strong> CPA 1 hospitals, one <strong>for</strong>CPA 2 hospitals and three models <strong>for</strong> CPA 3 hospitals (one with 100 to 150 beds, one with 151to 200 beds, and one with 201 to 250 beds).The costs are driven by <strong>the</strong> number <strong>of</strong> inpatient days and outpatient visits. To determine <strong>the</strong>number <strong>of</strong> inpatient days <strong>the</strong> number <strong>of</strong> <strong>of</strong>ficial beds is multiplied by <strong>the</strong> bed occupancy rate.We used a bed occupancy rate <strong>of</strong> 85% in <strong>the</strong> model, although this can be changed by <strong>the</strong>user 12 .We developed and used normative unit costs <strong>for</strong> each main type <strong>of</strong> input: staff, drugs andmedical supplies, and operating costs.For staffing we used <strong>the</strong> norms shown in <strong>the</strong> CPA Guidelines. According to <strong>the</strong>se guidelines, aCPA 1 hospital with 40 to 60 beds should have 47 to 65 staff, a CPA 2 hospital with 60 to100beds should have 68 to 96 staff, and a CPA 3 hospital with 100 to 250 beds should have 155 to212 staff. See Annexes 3, 4 and 5 <strong>for</strong> details.These standards are somewhat different from <strong>the</strong> indicative ones shown in <strong>the</strong> MOH staffingstandards report published in July 2005, which state that CPA 1 and CPA 2 hospitals withbetween 50 and 99 occupied beds should have a total <strong>of</strong> 53 staff 13 . That report does notprovide a total staffing figure <strong>for</strong> a CPA 3 hospital with more than 150 beds and says that itshould have <strong>the</strong> same staffing as a National Hospital which is 1 doctor (Medical Doctor or/Medical Assistant) <strong>for</strong> every 5 occupied beds, one nurse <strong>for</strong> every 2 occupied beds and onemidwife <strong>for</strong> every 60 births in <strong>the</strong> hospital per year 14 .For staff who provide direct patient services (doctors, nurses, midwives and kinetic <strong>the</strong>rapists,we converted <strong>the</strong> ranges into numbers <strong>of</strong> beds per staff person and entered <strong>the</strong>m into <strong>the</strong> modelso that a change in <strong>the</strong> number <strong>of</strong> beds will result in changes in <strong>the</strong> numbers <strong>of</strong> staff. Weassumed that <strong>the</strong>se figures cover both inpatient and outpatient services. Since this methodproduces fractions <strong>of</strong> staff <strong>the</strong> model rounds up <strong>the</strong> number <strong>for</strong> each category to <strong>the</strong> nearestwhole number. For employees who do not provide direct patient services, such as laboratorytechnicians and maintenance workers, we used a fixed number based on <strong>the</strong> range shown in12 The rate <strong>of</strong> 85% was selected as optimal because this is reportedly <strong>the</strong> maximum rate <strong>of</strong> efficiency that can beachieved without compromising hospital-acquired infection rates. Lower rates are used in some countries. Forexample in <strong>the</strong> UK <strong>the</strong> Government’s occupancy target is reportedly 82%, and some argue that over 85% contributesto high hospital-acquired infection rates and 65% is considered ideal from that perspective (Quality <strong>of</strong> Hospital CareSuffers Due to Overcrowding, Daily Mail June 24, 2008).13 Ministry <strong>of</strong> Health Staffing Standards <strong>for</strong> Health Centres, Referral Hospitals and National Hospitals, July 2005.14 These staff to patient ratios may be higher than in some o<strong>the</strong>r countries. South Africa, <strong>for</strong> example, has a standard<strong>of</strong> 1 doctor <strong>for</strong> 15 occupied beds and 1 Registered Nurse <strong>for</strong> 8 occupied beds, and in <strong>the</strong> USA some states havestandards <strong>of</strong> 1 nurse <strong>for</strong> 6 patients on day duty and 1 <strong>for</strong> 10 patients on night duty. These standards are <strong>for</strong>registered doctors and registered nurses and probably do not include medical assistants and may not include primarynurses. They also only appear to cover inpatient services. Never<strong>the</strong>less, <strong>the</strong> Cambodia standards appear to requiremore doctors and nurses that those <strong>of</strong> some o<strong>the</strong>r countries.17
<strong>the</strong> Guidelines <strong>for</strong> each hospital. We also entered dental staff as a fixed number on <strong>the</strong>assumption that <strong>the</strong>se are only outpatient services (this could be set to vary with <strong>the</strong> number <strong>of</strong>dental services if a standard ratio can be established).For <strong>the</strong> cost <strong>of</strong> staff we used averages <strong>of</strong> <strong>the</strong> actual remuneration levels <strong>for</strong> 2007 at <strong>the</strong> sampledhospitals. Because <strong>the</strong>se hospitals are operating under contracting programs <strong>the</strong> remunerationlevels are higher than at non-contracting hospitals and are more representative <strong>of</strong> levels thatneed to be paid to have motivated staff. The figures include remuneration from all sourcesidentified in <strong>the</strong> hospital financial reports. These comprised Government salary, overtime andmission payments; shares <strong>of</strong> user fee, health insurance and health equity fund revenue; deliveryincentives; and per<strong>for</strong>mance incentives paid under <strong>the</strong> contracting programs. The per<strong>for</strong>manceincentives represented between 10% and 20% <strong>of</strong> <strong>the</strong> total remuneration at <strong>the</strong> sample <strong>of</strong>hospitals. We produced a combined average <strong>for</strong> doctors and medical assistants, <strong>for</strong> secondaryand primary nurses, and <strong>for</strong> secondary and primary midwives. We used <strong>the</strong> same remunerationlevels <strong>for</strong> <strong>the</strong> different categories <strong>of</strong> administrative staff and also <strong>for</strong> general support staff(maintenance technicians, cleaners, launderers, kitchen workers and drivers).For drugs and medical supplies we used <strong>the</strong> actual average cost in 2007 across <strong>the</strong> sampledhospitals including <strong>the</strong> additional drugs needed as estimated by <strong>the</strong> hospital directors. Thesewere converted to average cost per inpatient bed day and per outpatient visit, and a combinedcost per inpatient day equivalent. One would expect that <strong>the</strong> drug cost per IDE would rise with<strong>the</strong> level <strong>of</strong> hospital, <strong>of</strong>fset to some degree by some economies <strong>of</strong> scale. Since this was not <strong>the</strong>case at <strong>the</strong> sampled hospitals we decided to use <strong>the</strong> average across <strong>the</strong> 4 hospitals. In anyevent, with such a small sample it is probable that <strong>the</strong> figures do not represent reasonablenorms and fur<strong>the</strong>r research should be carried out be<strong>for</strong>e <strong>the</strong> figures are used <strong>for</strong> anything o<strong>the</strong>rthan rough estimates.The figure <strong>for</strong> <strong>the</strong> operating cost <strong>for</strong> <strong>the</strong> CPA 1 hospital is an average <strong>of</strong> <strong>the</strong> costs at Ang Rokaand Prey Chhor hospitals <strong>for</strong> 2007. These costs are <strong>the</strong> actual costs <strong>for</strong> 2007 plus a figure <strong>for</strong>additional needs estimated by <strong>the</strong> hospital directors. We treated <strong>the</strong>m as fixed costsirrespective <strong>of</strong> <strong>the</strong> number <strong>of</strong> beds, which may be an over-estimate <strong>for</strong> <strong>the</strong> smaller hospitalssince both Ang Roka and Prey Chhor hospitals are at <strong>the</strong> top end <strong>of</strong> <strong>the</strong> range <strong>for</strong> a CPA 1hospital (Prey Chhor hospital actually 10 beds more than <strong>the</strong> top end <strong>of</strong> <strong>the</strong> range).The figure <strong>for</strong> <strong>the</strong> operating cost <strong>for</strong> <strong>the</strong> CPA 2 hospital is <strong>the</strong> actual cost <strong>for</strong> 2007 at KirivongHospital plus a figure <strong>for</strong> additional needs estimated by <strong>the</strong> hospital directors. This may also bean over-estimate <strong>for</strong> any smaller CPA 2 hospitals since Kirivong Hospital is at <strong>the</strong> top <strong>of</strong> <strong>the</strong>range <strong>for</strong> a CPA 2 hospital, with 80 beds.The figure <strong>for</strong> <strong>the</strong> operating costs <strong>for</strong> <strong>the</strong> three levels <strong>of</strong> CPA 3 hospitals is based on <strong>the</strong> actualcost <strong>for</strong> 2007 at Kampong Cham Hospital, again plus a figure <strong>for</strong> additional needs estimated by<strong>the</strong> hospital directors. Kampong Cham Hospital is bigger than <strong>the</strong> top end <strong>of</strong> <strong>the</strong> normativerange, with 260 beds, so we estimated a proportion <strong>of</strong> <strong>the</strong> figure <strong>for</strong> <strong>the</strong> small and medium CPA3 hospitals. This assumed that 50% <strong>of</strong> <strong>the</strong> Kampong Cham Hospital figure is fixed and <strong>the</strong>o<strong>the</strong>r 50% varies with <strong>the</strong> number <strong>of</strong> beds.The results <strong>of</strong> using <strong>the</strong> models <strong>for</strong> an example <strong>of</strong> each level <strong>of</strong> hospital are shown in Table 11.These are examples <strong>of</strong> costs based on particular numbers <strong>of</strong> beds and outpatient servicesentered into <strong>the</strong> model. The examples <strong>of</strong> <strong>the</strong> models showing <strong>the</strong> detailed costs are shown inAnnexes 7, 8, 9, 10 and 11.Based on approximate normative staffing levels and standard costs <strong>for</strong> remuneration, drugs andoperating costs, a 60-bed CPA 1 hospital with an 85% BOR and 5,000 outpatient services per18
year should have around 60 staff and should cost around $260,000 per year. An 80-bed CPA 2hospital with 8,000 outpatient services should have around 89 staff and should cost around$375,000. A CPA 3 hospital with 100 beds should have around 118 staff and should costaround $540,000, one with 175 beds should have around 185 staff and should cost around$840,000, and one with 250 beds should have around 255 staff and should cost around$1,150,000.Table 11: Normative costs <strong>for</strong> hospitals (US$)Summary <strong>of</strong> standard costsUS$CPA 1 (40-60 beds)CPA 2 (60-100 beds)19CPA 3 small(100-150beds)CPA 3medium(151-200beds)CPA 3 large(201-250beds)ASSUMPTIONSBeds 60 80 100 175 250BOR 85% 85% 85% 85% 85%Occupied beds 51 68 85 149 213Annual inpatient days 18,615 24,820 31,025 54,294 77,563ALOS 4.6 5.5 7.3 7.3 7.3Discharges and deaths 4,047 4,513 4,250 7,438 10,625Outpatient services 5,000 8,000 - - -Inpatient day equivalents (IDEs) 19,879 26,946 31,025 54,294 77,563STAFF AND COSTSStaff numbers 60 89 118 185 255Staff cost 102,378 151,594 208,737 333,771 463,121Drugs and medical supplies 124,295 167,975 193,105 337,934 482,763Operating costs 35,458 56,526 141,980 171,559 201,138Total cost 262,131 376,095 543,822 843,264 1,147,022Staff cost per IDE 5.15 5.63 6.73 6.15 5.97Drugs etc per IDE 6.25 6.23 6.22 6.22 6.22Operating costs per IDE 1.78 2.10 4.58 3.16 2.59Total cost per IDE 13.19 13.96 17.53 15.53 14.79The modeled examples produce cost per capita figures. For example, <strong>the</strong> CPA 2 hospitalexample would cost $1.88 per capita if it serves a catchment population <strong>of</strong> 200,000 people(Annex 8). However, it is important to note that <strong>the</strong>se are not normative costs since we do nothave norms <strong>for</strong> <strong>the</strong> numbers <strong>of</strong> beds per 1,000 population.The cost per IDE <strong>for</strong> <strong>the</strong>se hospitals would be $13.19 <strong>for</strong> <strong>the</strong> CPA 1 hospital, $13.96 <strong>for</strong> <strong>the</strong>CPA 2 hospital, $17.53 <strong>for</strong> <strong>the</strong> small CPA 3 hospital, $15.53 <strong>for</strong> <strong>the</strong> medium CPA 3 hospital and$14.79 <strong>for</strong> <strong>the</strong> large CPA 3 hospital. The cost per IDE <strong>for</strong> <strong>the</strong> CPA 3 hospitals is less as <strong>the</strong>number <strong>of</strong> beds increase since part <strong>of</strong> <strong>the</strong> operating costs are fixed and some <strong>of</strong> <strong>the</strong> staff do notincrease proportionally with <strong>the</strong> number <strong>of</strong> occupied beds.If a hospital runs at lower capacity, <strong>the</strong>n fewer doctors, nurses and midwives and drugs areneeded, but <strong>the</strong> numbers <strong>of</strong> support staff and operating costs are not much affected. If <strong>the</strong>above example <strong>of</strong> a CPA 1 hospital operates at 60% inpatient capacity instead <strong>of</strong> 85%, <strong>the</strong>
number <strong>of</strong> staff would fall to 49 and <strong>the</strong> total cost would go down to $207,731 but <strong>the</strong> cost perIDE would go up to $14.44 (because <strong>the</strong> fixed staff and operating costs are spread over fewerIDEs).The costs are sensitive to <strong>the</strong> staffing ratios used. For example, <strong>for</strong> CPA 1 hospitals we usednormative ratios <strong>of</strong> 1 MD/MA to 8 occupied beds, 1 nurse to 2.8 beds and 1 midwife to 7.5 beds(based on <strong>the</strong> CPA Guidelines). If we change <strong>the</strong> staffing ratios <strong>for</strong> <strong>the</strong> 60-bed CPA hospital in<strong>the</strong> above table to 1 MD/MA to 16 occupied beds, 1 nurse <strong>for</strong> 5.6 beds and 1 midwife <strong>for</strong> 15beds, <strong>the</strong> total number <strong>of</strong> staff would be reduced from 60 to 45 and <strong>the</strong> budget from $260,830 to$234,292. However, this reduction is likely to affect quality <strong>of</strong> care. It should be noted that <strong>the</strong>reduction had limited effect on cost since <strong>the</strong> staffing numbers are fixed <strong>for</strong> most categories <strong>of</strong>staff.The study <strong>of</strong> HSP 2 costs estimated that inpatient admissions would increase from 2.07 per 100population in 2006 to 2.20 in 2007 and 2.99 in 2012 if <strong>the</strong> historical rate <strong>of</strong> growth continues,and to 2.26 in 2007 and 3.53 in 2012 if <strong>the</strong> rate <strong>of</strong> growth accelerates (Pearson 15 ). In <strong>the</strong> costsection <strong>of</strong> HSP 2 it is assumed that <strong>the</strong>se increases in demand can be met to some degree bymaking better use <strong>of</strong> existing hospital capacity.This assumption seems reasonable since <strong>the</strong> BOR <strong>for</strong> all hospitals, excluding national hospitals,<strong>for</strong> 2007 was 68% and <strong>the</strong> ALOS was 7.4 days (both <strong>of</strong> which improved from 65% and 8.0 daysin 2006). The hospitals can, <strong>the</strong>re<strong>for</strong>e, treat 22% more inpatients be<strong>for</strong>e reaching <strong>the</strong> level <strong>of</strong>85% and if <strong>the</strong> ALOS can be fur<strong>the</strong>r lowered <strong>the</strong>n even more can be treated. Since <strong>the</strong> ALOS atAng Roka, Kirivong and Kampong Cham are 4.6, 5.5 and 7.3 respectively, it should be feasibleto lower <strong>the</strong> overall average.Fur<strong>the</strong>r increases in demand would have to be addressed through investments in infrastructureas per <strong>the</strong> Health Coverage Plan.15 <strong>Cost</strong>ing <strong>of</strong> Health Strategic Plan (2008 - 2015). Mark Pearson. Health System Streng<strong>the</strong>ning Cambodia Project,USAID. 2008.20
9. COMPARISON OF NORMATIVE WITH ACTUAL COSTSIn 2007 Ang Roka Hospital had 26 staff and spent $175,231. As a 60-bed CPA 1 hospital, toprovide <strong>the</strong> number <strong>of</strong> services that it did on 2007 it should have had 59 staff and a budget <strong>of</strong>around $258,000. The hospital director recognized <strong>the</strong> shortage <strong>of</strong> staff and identified a need<strong>for</strong> 14 additional persons, although according to <strong>the</strong> norm <strong>the</strong>y needed 33 more. In terms <strong>of</strong> keystaff, according to <strong>the</strong> norms, Ang Roka should have had 7 doctors (Medical Doctors andMedical Assistants), 18 nurses and 7 midwives. The hospital actually had 6 doctors, 12 nursesand 1 midwife, and was, <strong>the</strong>re<strong>for</strong>e, severely under-staffed in <strong>the</strong>se areas (see Annex 6 <strong>for</strong> abreakdown <strong>of</strong> <strong>the</strong> actual staff by hospital). The hospital only carried out 149 deliveries andspontaneous abortions, which may be partly because <strong>of</strong> <strong>the</strong> shortage <strong>of</strong> midwives. Also it hadno dental staff, no pharmacist and no kinetic <strong>the</strong>rapist. It should have a total <strong>of</strong> 16 employeesengaged in non-medical roles such as administration and maintenance, but only had 4.Prey Chor Hospital had 28 staff and spent $170,160. As a 70-bed CPA 1 hospital, to providethose numbers <strong>of</strong> services that it did in 2007 it should have had 54 staff and a budget <strong>of</strong> around$227,000. The hospital director recognized <strong>the</strong> staff shortage and estimated that <strong>the</strong>y needed17 more staff, although <strong>the</strong> norms indicate that <strong>the</strong>y needed 26 more. However, if it operated at85% and reduced its ALOS from 6.3 to 4.6 (<strong>the</strong> level at Ang Roka) it could have treated 4,721inpatients (almost twice as many as it did treat) and provided 5,000 outpatient services with 65staff and a budget <strong>of</strong> around $290,000. Based on <strong>the</strong> CPA Guidelines, Prey Chhor should havehad about 6 doctors, 16 nurses and 6 midwives <strong>for</strong> <strong>the</strong> services that it provided in 2007.However, it only had 5 doctors, 10 nurses and 3 midwives, fewer than <strong>the</strong> norm all cases. Itshould have had16 employees in non-medical roles but only had 8. The low utilization rate(61% BOR) may be partly due to <strong>the</strong> low staffing level, but even with <strong>the</strong> low utilization rate <strong>the</strong>hospital appears to have been understaffed.Kirivong Hospital had had 49 staff and spent $400,442. As an 80-bed CPA 2 hospital, <strong>for</strong> <strong>the</strong>number <strong>of</strong> services that it provided in 2007 it should have had 108 staff and a budget <strong>of</strong> around$476,000. Again, <strong>the</strong> hospital director recognized <strong>the</strong> shortage and estimated that <strong>the</strong>y neededan additional 19 staff, although according to <strong>the</strong> norms <strong>the</strong>y needed 59 more. However, if itoperated at maximum capacity <strong>of</strong> 85% BOR it should have only treated 4,513 inpatients andprovided 8,000 outpatient services with 89 staff and a budget <strong>of</strong> $374,337. Based on <strong>the</strong> CPAGuidelines, Kirivong should have had 15 doctors, 41 nurses and 13 midwives. In 2007 itactually had 7 doctors, 24 nurses and 5 midwives, and was thus seriously short <strong>of</strong> <strong>the</strong>se keystaff. It should have had 23 non-medical staff but only had 8.Kampong Cham Hospital had 204 staff and spent $1,091,618. As a 260-bed CPA 3 hospital, toprovide <strong>the</strong> numbers <strong>of</strong> services that it did in 2007 it should have had 314 staff and a budget <strong>of</strong>around $1,414,000 16 . However, if it operated at maximum capacity <strong>of</strong> 85% BOR it should haveonly treated 11,050 inpatients which would have needed 262 staff and a budget <strong>of</strong> around$1,183,000. The hospital should have had 70 doctors, 140 nurses and 38 midwives but onlyhad 40 doctors, 102 nurses and 24 midwives. It should have had 39 non-medical staff but onlyhad 28.Using <strong>the</strong> norms, all four hospitals required many more staff and significant extra funding <strong>for</strong> <strong>the</strong>services that <strong>the</strong>y provided in 2007, and as a result it is likely that <strong>the</strong> quality <strong>of</strong> care may have16 The hospital director estimated that <strong>the</strong>y needed an extra 15 staff.21
een less than optimal. If <strong>the</strong>y had operated at <strong>the</strong> optimal BOR <strong>of</strong> 85%, Ang Roka, Prey Chhorand Kampong Cham hospitals would have needed more funds whereas Kirivong could havemanaged with less.22
10. OTHER COSTING STUDIESSeveral costing studies have been carried out in recent years. The studies with <strong>the</strong> mostcomplete in<strong>for</strong>mation on hospital costs were two carried by Fabricant and o<strong>the</strong>rs in 2002 and2003 17,18 . However, expenditures appear to have increased substantially over <strong>the</strong> 4/5 yearssince <strong>the</strong>se studies and capacity and utilization appear to have also changed in some cases.As a result comparisons with <strong>the</strong> findings <strong>of</strong> this study are not very useful.A more recent study <strong>of</strong> Pursat Provincial Hospital 19 showed that <strong>the</strong> hospital spent a total <strong>of</strong>$284,414 in 2004. The hospital, which has 202 beds, had 3,830 inpatient discharges and 4,093outpatient consultations in that year. Of <strong>the</strong> total cost, 45% was spent on staff, 28% on drugsand 27% on operating costs. The cost came to $1.09 per capita. Using a cost weighting <strong>of</strong> 5outpatient consultations to 1 inpatient day, <strong>the</strong> study estimated a cost <strong>of</strong> $1.79 per outpatientconsultation, $8.97 per inpatient day and $71.74 per inpatient case (using an average ALOS <strong>of</strong>8 days). The hospital had 117 staff. Although <strong>the</strong> hospital has 58 fewer beds than KampongCham, <strong>the</strong> total cost was much lower than <strong>the</strong> cost <strong>for</strong> Kampong Cham in 2007, and it isassumed that ei<strong>the</strong>r expenditure has increased substantially over <strong>the</strong> 3 years or <strong>the</strong> allocation <strong>of</strong>funds to provincial hospitals differs greatly.Two more recent studies used <strong>the</strong> data from <strong>the</strong> Fabricant studies described above. One studyby Fabricant in 2006 used costs from his previous studies to help estimate <strong>the</strong> cost <strong>of</strong> increasesutilization <strong>of</strong> health services by <strong>the</strong> poor 20 . Ano<strong>the</strong>r study by WHO published in 2007 used 2001estimates <strong>for</strong> district hospitals from <strong>the</strong> Fabricant studies <strong>of</strong> $0.86 per capita in non-contractingODs and $1.38 in contracting-out ODs data and inflated <strong>the</strong>m to 2007 prices <strong>of</strong> $1.00 and $1.60respectively 21 22 .The SRC final evaluation report estimated <strong>the</strong> average cost per contact in 2007 as $6.29 <strong>for</strong>Kirivong Hospital and $6.56 <strong>for</strong> Ang Roka Hospital. This is less than <strong>the</strong> figures <strong>of</strong> $10.67 and$8.98 used in this study, which may be because different weights <strong>for</strong> contacts were used in <strong>the</strong>two studies and/or because additional costs may have been identified in this study 23 .The actual costs in 2007 found in this study <strong>for</strong> Ang Roka and Kirivong were $8.98 and $10.67per IDE. These costs are much higher than <strong>the</strong> average costs <strong>of</strong> $5.67 per IDE from 2006 used17 <strong>Cost</strong> Analysis <strong>of</strong> Essential Health Services in Cambodia. MOH/WHO Health Sector Re<strong>for</strong>m Phase III Project. FinalReport <strong>of</strong> Data Analysis. Steve Fabricant. WHO/USAID/POPTECH. 2002.18 <strong>Cost</strong> Analysis (Part 2) <strong>of</strong> Essential Health Services in Cambodia. MOH/WHO Health Sector Re<strong>for</strong>m Phase IIIProject. Steve Fabricant, Sok Kanha, and Khout Thavary. Final Draft 11 December 2003.19 Hospital Financing Assessment Report, Chhorn Sao, HSSC/URC/Cambodia. February 2006.20 Estimating <strong>Cost</strong>s <strong>of</strong> Increased Utilization <strong>of</strong> Health Services by <strong>the</strong> Poor in Cambodia. Steve Fabricant <strong>for</strong>WHO/Cambodia. Final Draft March 2006.21 Scaling Up <strong>for</strong> Better Health in Cambodia. WHO and Ministry <strong>of</strong> Health, Kingdom <strong>of</strong> Cambodia. WHO 2007.22 The figures in <strong>the</strong> Fabricant reports were mean per capita costs <strong>for</strong> 2 contracting out hospitals and <strong>for</strong> 4 noncontractinghospitals and <strong>the</strong> final figures were $1.39 and $0.88 respectively.23 Contracting <strong>of</strong> Health Services: Ang Rokar and Kirivong Operational Districts, Takeo Province, Cambodia – FinalEvaluation Report. Sheryl Keller, Jean-Marc Thome and Jean-Yves Dekestier. April 2008. Swiss Red Cross.23
in <strong>the</strong> second child survival study (which noted that <strong>the</strong> figures might not be very accurate) 24 .This is partly because total expenditure increased in 2007 and it may be that we were able toidentify more expenditure <strong>for</strong> that year. The normative costs <strong>of</strong> $13.19 and $17.53 per IDE <strong>for</strong> aCPA 1 and a CPA 2 hospital are higher again, mainly since we used normative staffing levels.This means that <strong>the</strong> child survival costs were significantly under-estimated.The average cost <strong>of</strong> $18.89 per admission used in <strong>the</strong> costing <strong>of</strong> hospital services under HSP 2was based on 2005 costs <strong>for</strong> two hospitals and is also much less than <strong>the</strong> normative costs <strong>of</strong>$60.70 <strong>for</strong> a CPA1 hospital and $77.13 <strong>for</strong> a CPA 2 hospital. Again it seems that <strong>the</strong> HSP 2costs may have been significantly underestimated (this possibility was noted in <strong>the</strong> HSP2costing study).24 Scaling Up Child Survival Interventions in Cambodia: Service Delivery <strong>Cost</strong>s. The BASICS Project/USAID. 25February 2008. David Collins, Chan K. Chhuong and Kun Reth.24
11. KEY SERVICESDue to <strong>the</strong> difficulty <strong>of</strong> collecting comprehensive in<strong>for</strong>mation on individual services and <strong>the</strong> lack<strong>of</strong> time available <strong>for</strong> <strong>the</strong> study, it was not possible to identify <strong>the</strong> cost <strong>of</strong> each type <strong>of</strong> serviceprovided.In <strong>the</strong> second child survival costing study, USAID/BASICS estimated <strong>the</strong> average cost <strong>of</strong> aninpatient day at a CPA1/CPA2 hospital as $5.67 including drugs and $2.91 excluding drugs.Based on <strong>the</strong>se figures and a standard ALOS <strong>of</strong> 7 days, <strong>the</strong> average cost <strong>of</strong> a malariaadmission was estimated at $20.38 excluding drugs. Similarly <strong>the</strong> average cost <strong>of</strong> a pneumoniaadmission was estimated at $14.96 (5 days) and that <strong>of</strong> a diarrhea admission was estimated at$5.82 (2 days). These figures were based on actual 2006 costs at Ang Roka Hospital andKirivong Hospital.In this study, <strong>the</strong> actual cost <strong>of</strong> an inpatient day in 2007 excluding drugs at <strong>the</strong> same hospitalswas estimated at $3.59 at Ang Roka and $3.99 at Kirivong. Both costs are higher than <strong>the</strong> 2006costs used in <strong>the</strong> child survival costing. The normative costs, excluding drugs, vary with <strong>the</strong>size <strong>of</strong> <strong>the</strong> hospital and range from $6.93 <strong>for</strong> a CPA 1 hospital to $11.31 at a small CPA 3hospital. The average cost is $8.76. On this basis <strong>the</strong> cost <strong>of</strong> hospital treatment, excludingdrugs, <strong>for</strong> child survival interventions should be $61.32 <strong>for</strong> a malaria admission, $43.80 <strong>for</strong> apneumonia admission and $17.52 <strong>for</strong> a diarrhea admission. These figures are much higherthan <strong>the</strong> cost estimates produced in <strong>the</strong> child survival costing study (as was noted above). It ispossible that o<strong>the</strong>r estimates <strong>of</strong> <strong>the</strong> cost <strong>of</strong> hospitals services, such as <strong>for</strong> reproductive health,HIV/AIDS and TB have also been understated.25
12. CONCLUSIONS AND RECOMMENDATIONSThe resources needed to provide <strong>the</strong> CPA at <strong>the</strong> hospitals varies significantly depending on <strong>the</strong>level <strong>of</strong> hospital (CPA 1, 2 or 3) and <strong>the</strong> number <strong>of</strong> occupied beds. Based on <strong>the</strong> norms andassuming a BOR <strong>of</strong> 85%, <strong>the</strong> number <strong>of</strong> staff needed to operate a hospital varies from 49persons <strong>for</strong> a 40-bed CPA 1 hospital to 255 persons <strong>for</strong> a 250-bed CPA 3 hospital. The annualcost <strong>of</strong> <strong>the</strong> hospitals would range from around $200,000 <strong>for</strong> <strong>the</strong> 40-bed CPA 1 hospital toaround $1.1 million <strong>for</strong> <strong>the</strong> 250-bed CPA 3 hospital.These figures are sensitive to <strong>the</strong> staffing ratios used. For example, <strong>for</strong> CPA 1 hospitals weused normative ratios <strong>of</strong> 1 MD/MA to 8 occupied beds, 1 nurse to 2.8 beds and 1 midwife to 7.5beds (based on <strong>the</strong> CPA Guidelines). Using those ratios a 60 bed CPA 1 hospital would need atotal <strong>of</strong> 60 staff and a budget <strong>of</strong> around $260,000. If we change <strong>the</strong> staffing ratios to 1 MD/MAto 16 occupied beds, 1 nurse <strong>for</strong> 5.6 beds and 1 midwife <strong>for</strong> 15 beds, <strong>the</strong> total number <strong>of</strong> staffwould be reduced to 45 and <strong>the</strong> budget to around $234,000. However, this reduction is likely toaffect quality <strong>of</strong> care. It should be noted that <strong>the</strong> staffing numbers are fixed <strong>for</strong> certaincategories <strong>of</strong> staff, such as laboratory technicians, where a minimum number is needed to run ahospital.The cost per capita depends on <strong>the</strong> size <strong>of</strong> <strong>the</strong> catchment population, <strong>the</strong> level <strong>of</strong> hospital, and<strong>the</strong> number <strong>of</strong> occupied beds. For a 60-bed CPA 1 hospital serving a population <strong>of</strong> 100,000people <strong>the</strong> per capita cost would be $2.62. For an 80-bed CPA 2 hospital serving a catchmentpopulation <strong>of</strong> 200,000 people <strong>the</strong> per capita cost would be $1.88. For a CPA 3 hospital servinga province <strong>of</strong> 2,000,000 people and acting as a second-level provincial referral hospital, <strong>the</strong> percapita cost would be $0.59 cents. This last figure would have to be added to <strong>the</strong> per capita cost<strong>of</strong> <strong>the</strong> various district hospitals in <strong>the</strong> province to arrive at a total hospital per capita cost <strong>for</strong> <strong>the</strong>province. Note that we did not have norms <strong>for</strong> numbers <strong>of</strong> beds per thousand population and<strong>the</strong>se figures do not, <strong>the</strong>re<strong>for</strong>e, represent normative per capita costs.The normative cost per inpatient day equivalent (IDE) would range from $13.19 at a 60-bedCPA 1 hospital to $17.53 at a 100-bed CPA 3 hospital. The cost per IDE <strong>of</strong> a CPA 3 hospitalwould be less <strong>for</strong> larger hospitals due to economies <strong>of</strong> scale. At <strong>the</strong> same CPA 1 hospital,assuming an ALOS <strong>of</strong> 4.6 days this would translate to an average cost <strong>of</strong> $60.70 per admission.At <strong>the</strong> 100 bed CPA 3 hospital with an ALOS <strong>of</strong> 7.3 days <strong>the</strong> average cost per admission wouldbe $127.96.The HSP 2 targets could not be translated into specific hospital targets <strong>for</strong> all services. The HSP2 costing assumed that increases in hospital services would be necessary but that <strong>the</strong>se couldbe provided to some degree through greater and more efficient use <strong>of</strong> existing capacity. Thisseems reasonable since <strong>the</strong>re is a significant gap between <strong>the</strong> average BOR <strong>of</strong> 68% <strong>for</strong> all CPAhospitals in 2007 and <strong>the</strong> optimal BOR <strong>of</strong> 85%, meaning that more inpatients can be treatedwithout having to increase <strong>the</strong> numbers <strong>of</strong> beds. Lowering <strong>the</strong> average ALOS from <strong>the</strong> nationalaverage <strong>of</strong> 7.4 days in 2007 to <strong>the</strong> rates achieved in <strong>the</strong> sample <strong>of</strong> contracting hospital wouldallow even more inpatients to be treated.However, <strong>the</strong> additional cost <strong>of</strong> bringing <strong>the</strong> resources <strong>of</strong> <strong>the</strong> existing hospitals up to <strong>the</strong>normative levels would be significant, especially <strong>for</strong> staffing. For example, Ang Roka Hospital, a60-bed CPA 1 hospital in Takeo Province, had a BOR <strong>of</strong> 84% and an ALOS <strong>of</strong> 4.6 days in 2007and was already operating at close to optimal capacity. However, it only had 26 staff and spent26
$175,231 in that year, whereas according to <strong>the</strong> norms it should have had 59 staff and a budget<strong>of</strong> around $258,000.As ano<strong>the</strong>r example, Prey Chhor Hospital, a 70-bed CPA 1 hospital in Kampong ChamProvince, had a BOR <strong>of</strong> 61% and an ALOS <strong>of</strong> 6.3 days in 2007. It had 28 staff and spent$170,160 in that year, whereas <strong>for</strong> <strong>the</strong> number <strong>of</strong> services that it provided it should have had 54staff and a budget <strong>of</strong> around $227,000. However, if it operated at optimal capacity and reducedits ALOS to 4.6 days it would treat twice as many inpatients but would require 65 staff and abudget <strong>of</strong> around $290,000.The funding <strong>for</strong> <strong>the</strong> sample <strong>of</strong> contracting hospitals used <strong>for</strong> this study came from a variety <strong>of</strong>sources. Between 67% and 83% <strong>of</strong> <strong>the</strong> funds came from <strong>the</strong> Government, most <strong>of</strong> which was indrugs and supplies. User fees, health equity funds and health insurance made up between 12%and 24% <strong>of</strong> total funding. Direct donor assistance made up between 5% and 9% <strong>of</strong> totalfunding. A portion <strong>of</strong> <strong>the</strong> Government funding and <strong>the</strong> health equity funds are also donorfunded. Depending on <strong>the</strong> ability <strong>of</strong> <strong>the</strong> Government to finance <strong>the</strong> increased costs it is likelythat a significant portion <strong>of</strong> <strong>the</strong> increased funds needed would have to come from user fees andinsurance and from donors, at least in <strong>the</strong> short term.Both <strong>the</strong> actual 2007 costs and <strong>the</strong> normative costs estimated in this study are significantlyhigher than <strong>the</strong> costs used in <strong>the</strong> second child survival costing study and in HSP 2, and may behigher than figures used in estimating <strong>the</strong> cost <strong>of</strong> <strong>the</strong> reproductive health, HIV/AIDS and TBstrategic plans. The strategic plan costs need to be reviewed and, if necessary, adjusted.The costing model can be used to estimate a budget <strong>for</strong> any referral hospital. However, it isimportant to note that <strong>the</strong>se costs are rough estimates. The following recommendations aremade regarding improving <strong>the</strong> quality <strong>of</strong> this in<strong>for</strong>mation.• For this study <strong>the</strong> staffing norms were developed from ranges shown in CPA Guidelinesand drug and supply costs were based on actual amounts provided to <strong>the</strong> hospitals.They may not reflect accurately <strong>the</strong> needs <strong>of</strong> <strong>the</strong> hospitals and <strong>the</strong>y do not take intoaccount differences in patient mix. These figures should be reviewed by <strong>the</strong> MOH andan analysis and determination <strong>of</strong> standard clinical practices should also be carried out todevelop more accurate staffing norms and standard drug and clinical supply needs.• The figures used <strong>for</strong> staff remuneration were based on averages <strong>of</strong> actual payments at<strong>the</strong> sample <strong>of</strong> hospitals. These figures should be reviewed and, if necessary, adjusted.• A more detailed analysis <strong>of</strong> <strong>the</strong> operating costs would also be advisable, since it ispossible that some aspects, such as maintenance, are underfunded and that this maynot have been fully taken into account by <strong>the</strong> hospital directors when <strong>the</strong>y estimated <strong>the</strong>additional funds needed.We also recommend that <strong>the</strong> HSP2 targets be translated into specific service delivery targets.This will assist <strong>the</strong> health centers and hospitals to set targets that will result in <strong>the</strong> achievement<strong>of</strong> HSP2 goals.27
ANNEX 1: CPA SERVICES (COPIED FROM CPA GUIDELINES)28
ANNEX 2: INPATIENT STATISTICS BY WARDAng Roka Pre Chhor Kirivong Kampong ChamBeds - Medicine 10 23 24 66Beds - Surgery 4 7 16 80Beds - Pediatric 8 8 16 25Beds - Maternity 4 7 8 30Beds - o<strong>the</strong>r 4 5 - 29Beds - TB 30 20 16 30Beds - Total 60 70 80 260Discharges, referrals and deaths - Medicine 835 514 1,966 3,524Discharges, referrals and deaths - Surgery 120 162 850 3,342Discharges, referrals and deaths - Pediatric 2,298 949 2,508 3,914Discharges, referrals and deaths - Maternity 134 212 1,114 2,314Discharges, referrals and deaths - O<strong>the</strong>rs 567 618 - 575Discharges, referrals and deaths - TB 77 37 64 314Discharges, referrals and deaths - Total 4,031 2,492 6,502 13,983Hospitalization Days - Medicine 3,485 4,215 10,402 28,275Hospitalization Days - Surgery 358 816 5,871 31,329Hospitalization Days - Pediatrics 8,196 5,099 13,075 15,928Hospitalization Days - Maternity 185 888 4,647 12,907Hospitalization Days - O<strong>the</strong>r 1,765 3,069 - 4,435Hospitalization Days - TB 4,392 1,509 1,444 8,875Hospitalization Days - Total 18,381 15,596 35,439 101,749ALOS - Medicine 4.2 8.2 5.3 8.0ALOS - Surgery 3.0 5.0 6.9 9.4ALOS - Pediatric 3.6 5.4 5.2 4.1ALOS - Maternity 1.4 4.2 4.2 5.6ALOS - O<strong>the</strong>rs 3.1 5.0 7.7ALOS - TB 57.0 40.8 22.6 28.3ALOS - all 4.6 6.3 5.5 7.3BOR - Medicine 95% 50% 119% 117%BOR - Surgery 25% 32% 101% 107%BOR - Pediatric 281% 175% 224% 175%BOR - Maternity 13% 35% 159% 118%BOR - O<strong>the</strong>r 121% 168% 42%BOR - TB 40% 21% 25% 81%BOR - All 84% 61% 121% 107%29
ANNEX 3: CPA 1 STAFFING STANDARDS FROM CPA GUIDELINESThe following is described in English section <strong>of</strong> <strong>the</strong> CPA Guidelines as <strong>the</strong> staffing standards <strong>for</strong>a CPA 2 Hospital but <strong>the</strong> Khmer version says that it is <strong>for</strong> a CPA 2 hospital30
ANNEX 4: CPA 2 STAFFING STANDARDS FROM CPA GUIDELINES31
ANNEX 5: CPA 3 STAFFING STANDARDS FROM CPA GUIDELINES32
ANNEX 6: ACTUAL STAFFING NUMBERS FOR 2007AngRokaPreyChhor KirivongKampongChamBeds 60 70 80 260Maximum bedsSTAFFINGMedical Doctors / Medical Assistants 6 5 7 41Dentist/Dentistry Nurses - 1 1 2Nurses 12 10 24 102Midwives 1 3 5 24Pharmacists - - 1 3Lab technicians 3 1 3 3Radiology technicians - - - 1Kinetic <strong>the</strong>rapists (physio<strong>the</strong>rapists) - - - -Total medical staff 22 20 41 176Maintenance TechniciansCleanerslaunderersKitchen WorkersDriversTotal general workers 4 7 8 20AdministrationAccountantsIn<strong>for</strong>mation TechnologyTotal aministration staff 0 1 0 8Total 26 28 49 20433
ANNEX 7: COST MODEL EXAMPLE FOR CPA 1 HOSPITAL (US$)Standard <strong>Cost</strong> ModelCPA 1 HospitalRange <strong>of</strong> beds 40 to 60UTILIZATION ASSUMPTIONSCatchment population 133,056Number <strong>of</strong> beds 60BOR 85%Occupied beds 51Annual inpatient days 18,615ALOS 4.6Admissions / Discharges 4,047Outpatient services 5,000Admissions per 100 population 3.04STAFFINGNorms <strong>for</strong>beds perstaff Numbers Annual pay Total costMedical Doctors / Medical Assistants 8.0 7 2,722 19,056Dentist/Dentistry Nurses na 2 1,932 3,865Nurses 2.8 19 1,602 30,445Midwives 7.5 7 1,750 12,253Pharmacists na 2 2,611 5,222Lab technicians na 3 1,679 5,038Radiology technicians na 2 2,029 4,059Kinetic <strong>the</strong>rapists (physio<strong>the</strong>rapists) 49.0 2 1,763 3,526Maintenance Technicians na 2 884 1,768Cleaners na 2 884 1,768launderers na 2 884 1,768Kitchen Workers na 2 884 1,768Drivers na 1 884 884Administration na 4 1,565 6,262Accountants na 1 1,565 1,565In<strong>for</strong>mation Technology na 2 1,565 3,131Total 60 - 102,378Drug and suppplies cost per inpatient day 18,615 6.22 115,863Drug and supplies cost per outpatient service 5,000 1.69 8,432Total drugs and supplies 124,295Operating costs 35,458Total 262,131<strong>Cost</strong> per capita 1.97<strong>Cost</strong> per inpatient bed day 13.20<strong>Cost</strong> per inpatient admission 60.70The shaded figures are ones that are entered by <strong>the</strong> user.34
ANNEX 8: COST MODEL EXAMPLE FOR CPA 2 HOSPITAL (US$)Standard <strong>Cost</strong> ModelCPA 2 HospitalRange <strong>of</strong> beds 60 to 100UTILIZATION ASSUMPTIONSCatchment population 200,000Number <strong>of</strong> beds 80BOR 85%Occupied beds 68Annual inpatient days 24,820ALOS 5.5Admissions / Discharges 4,513Outpatient services 8,000Admissions per 100 population 2.26STAFFINGNorms <strong>for</strong>beds perstaff Numbers Annual pay Total costMedical Doctors / Medical Assistants 6.5 11 2,722 29,945Dentist/Dentistry Nurses na 3 1,932 5,797Nurses 2.4 29 1,602 46,469Midwives 7.5 10 1,750 17,504Pharmacists na 4 2,611 10,444Lab technicians na 4 1,679 6,717Radiology technicians na 3 2,029 6,088Kinetic <strong>the</strong>rapists (physio<strong>the</strong>rapists) 49.0 2 1,763 3,526Maintenance Technicians na 4 884 3,537Cleaners na 4 884 3,537launderers na 3 884 2,653Kitchen Workers na 3 884 2,653Drivers na 2 884 1,768Administration na 4 1,565 6,262Accountants na 1 1,565 1,565In<strong>for</strong>mation Technology na 2 1,565 3,131Total 89 - 151,594Drug and suppplies cost per inpatient day 24,820 6.22 154,484Drug and supplies cost per outpatient service 8,000 1.69 13,491Total drugs and supplies 167,975Operating costs 56,526Total 376,095<strong>Cost</strong> per capita 1.88<strong>Cost</strong> per inpatient bed day 14.02<strong>Cost</strong> per inpatient admission 77.13The shaded figures are ones that are entered by <strong>the</strong> user.35
ANNEX 9: COST MODEL EXAMPLE FOR SMALL CPA 3 HOSPITALStandard <strong>Cost</strong> ModelRange <strong>of</strong> bedsSmall CPA 3 Hospital100 to 150 bedsUTILIZATION ASSUMPTIONSCatchment population 1,600,000Number <strong>of</strong> beds 100BOR 85%Occupied beds 85Annual inpatient days 31,025ALOS 7.3Admissions / Discharges 4,250Outpatient services -Admissions per 100 population 0.27STAFFINGNorms <strong>for</strong>beds perstaff Numbers Annual pay Total costMedical Doctors / Medical Assistants 4.0 22 2,722 59,890Dentist/Dentistry Nurses na 2 1,932 3,865Nurses 2.0 43 1,602 68,902Midwives 7.5 12 1,750 21,004Pharmacists na 3 2,611 7,833Lab technicians na 6 1,679 10,075Radiology technicians na 3 2,029 6,088Kinetic <strong>the</strong>rapists (physio<strong>the</strong>rapists) 49.0 2 1,763 3,526Maintenance Technicians na 5 884 4,421Cleaners na 4 884 3,537launderers na 3 884 2,653Kitchen Workers na 3 884 2,653Drivers na 2 884 1,768Administration na 4 1,565 6,262Accountants na 2 1,565 3,131In<strong>for</strong>mation Technology na 2 1,565 3,131Total 118 - 208,737Drug and suppplies cost per inpatient day 31,025 6.22 193,105Drug and supplies cost per outpatient service -Total drugs and supplies 193,105Operating costs 141,980Total 543,822<strong>Cost</strong> per capita 0.34<strong>Cost</strong> per inpatient bed day 17.53<strong>Cost</strong> per inpatient admission 127.96The shaded figures are ones that are entered by <strong>the</strong> user.36
ANNEX 10: COST MODEL EXAMPLE FOR MEDIUM CPA 3 HOSPITALStandard <strong>Cost</strong> ModelRange <strong>of</strong> bedsMedium CPA 3 Hospital151 to 200 bedsUTILIZATION ASSUMPTIONSCatchment population 1,600,000Number <strong>of</strong> beds 175BOR 85%Occupied beds 148.75Annual inpatient days 54,294ALOS 7.3Admissions / Discharges 7,438Outpatient servicesAdmissions per 100 population 0.46STAFFINGNorms <strong>for</strong>beds perstaff Numbers Annual pay Total costMedical Doctors / Medical Assistants 4.0 38 2,722 103,446Dentist/Dentistry Nurses na 3 1,932 5,797Nurses 2.0 75 1,602 120,177Midwives 7.5 20 1,750 35,007Pharmacists na 4 2,611 10,444Lab technicians na 7 1,679 11,755Radiology technicians na 4 2,029 8,117Kinetic <strong>the</strong>rapists (physio<strong>the</strong>rapists) 49.0 4 1,763 7,051Maintenance Technicians na 6 884 5,305Cleaners na 5 884 4,421launderers na 4 884 3,537Kitchen Workers na 4 884 3,537Drivers na 3 884 2,653Administration na 4 1,565 6,262Accountants na 2 1,565 3,131In<strong>for</strong>mation Technology na 2 1,565 3,131Total 185 333,771Drug and suppplies cost per inpatient day 54,294 6.22 337,934Drug and supplies cost per outpatient service -Total drugs and supplies 337,934Operating costs Increase 171,559Total 843,264<strong>Cost</strong> per capita 0.53<strong>Cost</strong> per inpatient bed day 15.53<strong>Cost</strong> per inpatient admission 113.38The shaded figures are ones that are entered by <strong>the</strong> user.37
ANNEX 11: COST MODEL EXAMPLE FOR LARGE CPA 3 HOSPITALStandard <strong>Cost</strong> ModelRange <strong>of</strong> bedsLarge CPA 3 Hospital201 to 250 bedsUTILIZATION ASSUMPTIONSCatchment population 2,000,000Number <strong>of</strong> beds 250BOR 85%Occupied beds 212.5Annual inpatient days 77,563ALOS 7.3Admissions / Discharges 10,625Outpatient servicesAdmissions per 100 population 0.53STAFFINGNorms <strong>for</strong>beds perstaff Numbers Annual pay Total costMedical Doctors / Medical Assistants 4.0 54 2,722 147,003Dentist/Dentistry Nurses na 3 1,932 5,797Nurses 2.0 107 1,602 171,453Midwives 7.5 29 1,750 50,761Pharmacists na 5 2,611 13,055Lab technicians na 8 1,679 13,434Radiology technicians na 5 2,029 10,146Kinetic <strong>the</strong>rapists (physio<strong>the</strong>rapists) 49.0 5 1,763 8,814Maintenance Technicians na 7 884 6,189Cleaners na 6 884 5,305launderers na 5 884 4,421Kitchen Workers na 5 884 4,421Drivers na 4 884 3,537Administration na 6 1,565 9,393Accountants na 4 1,565 6,262In<strong>for</strong>mation Technology na 2 1,565 3,131Total 255 463,121Drug and suppplies cost per inpatient day 77,563 6.22 482,763Drug and supplies cost per outpatient service -Total drugs and supplies 482,763Operating costs Increase 201,138Total 1,147,022<strong>Cost</strong> per capita 0.57<strong>Cost</strong> per inpatient bed day 14.79<strong>Cost</strong> per inpatient admission 107.96The shaded figures are ones that are entered by <strong>the</strong> user.38
ANNEX 12: PEOPLE CONSULTEDHis Excellency, Pr<strong>of</strong>. Eng Huot, Secretary <strong>of</strong> State <strong>for</strong> Health, MOHPr<strong>of</strong>essor Sann Chan Soeung, Deputy Director General <strong>for</strong> Health, NIP Program Manager,MOHDr. Lo Veasnakiry, Director <strong>of</strong> <strong>the</strong> Department <strong>of</strong> Planning and Health In<strong>for</strong>mation, MOHDr. Michael Bernhart, Chief <strong>of</strong> Party, URCDr. Heng Vuthy, QI/Hospital Program ManagerURCDr. Frances Dailey, Technical Advisor, URCMr. Tapley Jordanwood, Health Financing Program Manager, URCDr. Niklas Danielsson, Child and Adolescent Health Medical Officer, WHODr. Sok Srun, Deputy Director, Department <strong>of</strong> Hospital Services, MOHDr. Sun Nasy, Deputy Director, RACHAMr. Fred Griffiths, Advisor, MOHMs. Maryam Bigdeli, Health Economist, WHODr. Thach Ly Khann, Provincial Coordinator RACHADr. Him Phannary, Senior Public Health Advisor, BTCDr. Chan Sorya, Provincial Coordinator, UNICEFMs. Luize Guimaraes Scherer Navarro, Chargee de Projets AFDMs. Hilde Schalenbourg, Finance and Admin Delegate, SRCMr. Sam Sam Oeun, Technical Advisor Finance, SRCDr. Bun Samnang, DPHI, MOHDr. Ros Chhun Eang, DPHI, MOHDr. Rasoka Thor, Project Officer, UNICEFMs. Siobhan McClelland, OPMLMr. Mike Naylor, Principal Consultant, Health, Ox<strong>for</strong>d Policy ManagementMr. Ravindra Bhupathy, OPMLMr Roger Hay, OPMLDr. Ly Nareth, World BankDr. Toomas Palu, Lead Health Specialist, World BankDr. Sok Kanha, Deputy Director, DPHI, MOHMs. Ka<strong>the</strong>rine Craw<strong>for</strong>d, Director Office <strong>of</strong> Public Health and Education, USAIDDr. Sek Sopheanarith, Development Assistance Specialist, OPHE, USAIDMr. Jonathan Ross, Vice Director, OPHE, USAIDDr. Heng Thy, Ang Roka Hospital DirectorMr. Prak Bun<strong>the</strong>oun, Ang Roka OD directorDr. Mey Sambo, Kirivong Hospital DirectorDr. Meas Chea, Kampong Cham Hospital Director39
MOH costing task teamDr. Lim Yi National Center <strong>for</strong> HIV/AIDS, Dermatology and STDsDr. Peng Vanny University Research Co., LLC-CambodiaDr. Lim Nary Reproductive Health and Child Health AllianceDr. Khoy Dy Reproductive Health and Child Health AllianceDr. Heng Limtry National Center <strong>for</strong> Health PromotionDr. Vong Sathiarany National Center <strong>for</strong> Maternal and Child Health – PMTCT ProgrammeDr. Tung Rathavy National Reproductive Health ProgrammeDr. Sun Sammang Department <strong>of</strong> Planning and Health In<strong>for</strong>mationDr. Var Chivorn Reproductive Health Association <strong>of</strong> CambodiaMr. Ork Vichit National Immunization ProgrammeDr. Khuon Eng Mony Preventive Medicine DepartmentMr. Ros Chhun Eang Department <strong>of</strong> Planning and Health In<strong>for</strong>mationDr. Ou Kevanna National Nutrition ProgrammeDr. Sok KanhaDepartment <strong>of</strong> Planning and Health In<strong>for</strong>mationDr. Lo Veasnakiry Department <strong>of</strong> Planning and Health In<strong>for</strong>mationMr. Prateek Gupta Basic Support <strong>for</strong> Institutionalizing Child Survival40
ANNEX 13: BIBIOGRAPHY1. National Strategic Development Plan 2006-2010. Ministry <strong>of</strong> Planning.2. <strong>Cost</strong> Analysis (Part 2) <strong>of</strong> Essential Health Services in Cambodia MOH/WHO Health SectorRe<strong>for</strong>m Phase III Project Steve Fabricant, Sok Kanha, and Khout Thavary. Final Draft 11December 2003.3. <strong>Cost</strong> Analysis <strong>of</strong> Essential Health Services in Cambodia MOH/WHO Health Sector Re<strong>for</strong>mPhase III Project Final Report <strong>of</strong> Data Analysis. Steve Fabricant. WHO/USAID/POPTECH.20024. Scaling Up Child Survival Interventions in Cambodia: Service Delivery <strong>Cost</strong>s. The BASICSProject/USAID. 25 February 2008. David Collins, Chan K. Chhuong and Kun Reth.5. Scaling Up Child Survival Interventions in Cambodia: The <strong>Cost</strong> <strong>of</strong> National ProgrammeResource Needs. The BASICS Project (USAID) and WHO. 19 June 2007. David Collins,Elizabeth Lewis and Karin Stenberg.6. Guidelines on Minimum <strong>Package</strong> <strong>of</strong> <strong>Activities</strong> <strong>for</strong> Health Centre Development, 2008-2015.Ministry <strong>of</strong> Health, Kingdom <strong>of</strong> Cambodia, December, 31, 2007.7. National Strategy <strong>for</strong> Reproductive and Sexual Health in Cambodia, 2006-2010. NationalReproductive Health Programme, Ministry <strong>of</strong> Health, Kingdom <strong>of</strong> Cambodia. February 2006.8. Contracting <strong>of</strong> Health Services: Ang Roka and Kirivong Operational Districts, TakeoProvince, Cambodia – Final Evaluation Report. Sheryl Keller, Jean-Marc Thome and Jean-Yves Dekestier. Swiss Red Cross. April 2008.9. Health Strategic Plan, 2008-2015. Department <strong>of</strong> Planning and Health In<strong>for</strong>mation, Ministry<strong>of</strong> Health, Kingdom <strong>of</strong> Cambodia. 1 st April, 2008.10. <strong>Cost</strong>ing <strong>of</strong> Health Strategic Plan (2008-2015). Mark Pearson. Health System Streng<strong>the</strong>ningCambodia Project, USAID. 2008.11. National Guidelines on <strong>Complementary</strong> <strong>Package</strong> <strong>of</strong> <strong>Activities</strong> <strong>for</strong> Referral HospitalDevelopment from 2006 to 2010, Second Version, 15 December 2006. Ministry <strong>of</strong> Health,Kingdom <strong>of</strong> Cambodia.12. Ministry <strong>of</strong> Health Staffing Standards <strong>for</strong> Health Centres, Referral Hospitals and NationalHospitals, July 2005.13. <strong>Cost</strong>ing Boosting, Summary <strong>of</strong> Work Done to Date. Mike Curtis. HSSP/MOH September2000.14. Financing Assessment Report, Chhorn Sao, HSSC/URC/Cambodia. February 2006.41
15. Scaling Up <strong>for</strong> Better Health in Cambodia. WHO and Ministry <strong>of</strong> Health, Kingdom <strong>of</strong>Cambodia. WHO 2007.16. Estimating <strong>Cost</strong>s <strong>of</strong> Increased Utilization <strong>of</strong> Health Services by <strong>the</strong> Poor in Cambodia. SteveFabricant <strong>for</strong> WHO/Cambodia. Final Draft March 2006.17. <strong>Cost</strong> and Funding <strong>Projections</strong> <strong>for</strong> <strong>the</strong> Minimum <strong>Package</strong> <strong>of</strong> <strong>Activities</strong> <strong>of</strong> <strong>the</strong> Ministry <strong>of</strong>Health, Royal Government <strong>of</strong> Cambodia. David Collins, Zina Jarrah and Prateek Gupta.Draft 18 November 2008. The BASICS Project (USAID).42


