Cost Projections for the Complementary Package of Activities - basics
Cost Projections for the Complementary Package of Activities - basics
Cost Projections for the Complementary Package of Activities - basics

Create successful ePaper yourself
Turn your PDF publications into a flip-book with our unique Google optimized e-Paper software.
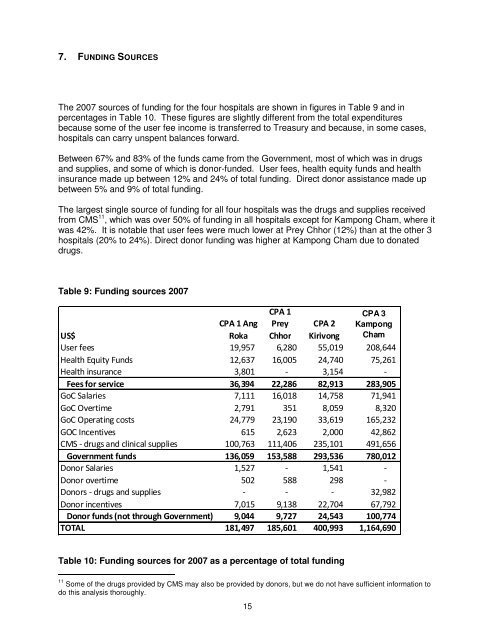
7. FUNDING SOURCESThe 2007 sources <strong>of</strong> funding <strong>for</strong> <strong>the</strong> four hospitals are shown in figures in Table 9 and inpercentages in Table 10. These figures are slightly different from <strong>the</strong> total expendituresbecause some <strong>of</strong> <strong>the</strong> user fee income is transferred to Treasury and because, in some cases,hospitals can carry unspent balances <strong>for</strong>ward.Between 67% and 83% <strong>of</strong> <strong>the</strong> funds came from <strong>the</strong> Government, most <strong>of</strong> which was in drugsand supplies, and some <strong>of</strong> which is donor-funded. User fees, health equity funds and healthinsurance made up between 12% and 24% <strong>of</strong> total funding. Direct donor assistance made upbetween 5% and 9% <strong>of</strong> total funding.The largest single source <strong>of</strong> funding <strong>for</strong> all four hospitals was <strong>the</strong> drugs and supplies receivedfrom CMS 11 , which was over 50% <strong>of</strong> funding in all hospitals except <strong>for</strong> Kampong Cham, where itwas 42%. It is notable that user fees were much lower at Prey Chhor (12%) than at <strong>the</strong> o<strong>the</strong>r 3hospitals (20% to 24%). Direct donor funding was higher at Kampong Cham due to donateddrugs.Table 9: Funding sources 2007CPA 1PreyChhorCPA 3KampongChamUS$CPA 1 AngRokaCPA 2KirivongUser fees 19,957 6,280 55,019 208,644Health Equity Funds 12,637 16,005 24,740 75,261Health insurance 3,801 - 3,154 -Fees <strong>for</strong> service 36,394 22,286 82,913 283,905GoC Salaries 7,111 16,018 14,758 71,941GoC Overtime 2,791 351 8,059 8,320GoC Operating costs 24,779 23,190 33,619 165,232GOC Incentives 615 2,623 2,000 42,862CMS - drugs and clinical supplies 100,763 111,406 235,101 491,656Government funds 136,059 153,588 293,536 780,012Donor Salaries 1,527 - 1,541 -Donor overtime 502 588 298 -Donors - drugs and supplies - - - 32,982Donor incentives 7,015 9,138 22,704 67,792Donor funds (not through Government) 9,044 9,727 24,543 100,774TOTAL 181,497 185,601 400,993 1,164,690Table 10: Funding sources <strong>for</strong> 2007 as a percentage <strong>of</strong> total funding11 Some <strong>of</strong> <strong>the</strong> drugs provided by CMS may also be provided by donors, but we do not have sufficient in<strong>for</strong>mation todo this analysis thoroughly.15