In vitro Evaluation of Commercially Available ... - ResearchGate
In vitro Evaluation of Commercially Available ... - ResearchGate
In vitro Evaluation of Commercially Available ... - ResearchGate
- No tags were found...
You also want an ePaper? Increase the reach of your titles
YUMPU automatically turns print PDFs into web optimized ePapers that Google loves.
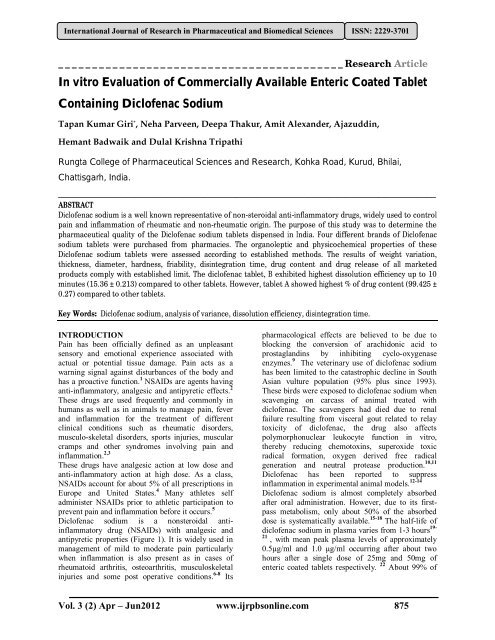
<strong>In</strong>ternational Journal <strong>of</strong> Research in Pharmaceutical and Biomedical Sciences ISSN: 2229-3701spectrophotometer at 276nm. The drug content <strong>of</strong>each sample was estimated from their previouslyprepared standard curve.Statistical analysisBy one-way analysis <strong>of</strong> variance the differences inphysicochemical properties were evaluated usingGraphpad <strong>In</strong>start s<strong>of</strong>tware. When P is < 0.05 thedifferences were considered significant.RESULT AND DISCUSSIONSFour brands <strong>of</strong> dicl<strong>of</strong>enac sodium tablets having 50mg potency were purchased from local retailpharmacy. All the brands <strong>of</strong> dicl<strong>of</strong>enac sodiumtablets used were within their self life during thestudy period. Weight variation, drug content,disintegration time and dissolution are compendialstandards. Hardness and friability are referred to asnon compendia standards. However, friability is nowincluded in the United States Pharmacopeia (USP,1995). Tablets were subject to weight variation study(Table 2) for uniformity <strong>of</strong> weight. All brandsshowed different mean weight which indicates theuse <strong>of</strong> different excipients in the different brands.It is evident that the deviations from the averageweight are within limits in all brands since all brandshaving uniform weight. Crown thickness anddiameter uniformity <strong>of</strong> tablets are necessary not onlyfor consumer requirements but also for packaging. ±5% variation is permissible. The thickness anddiameter values <strong>of</strong> the branded tablets (Table 2) werewithin limit.The weight variation test is clearly not sufficient toassure uniform potency <strong>of</strong> tablets. The potency <strong>of</strong>tablets is expressed in terms <strong>of</strong> grams, milligrams, ormicrograms <strong>of</strong> drug per tablet and is given as thelabel strength <strong>of</strong> the product. The BP specification isthat the content <strong>of</strong> drug should not be less than 95%and not more than 105%. The potency <strong>of</strong> the tabletswas found to be 95.90 – 99.42% (Table 3). The resultascertains the presence and compendia quantity <strong>of</strong>dicl<strong>of</strong>enac sodium in all the brands and so could notbe judged as counterfeits without activepharmaceutical ingredients. However, statisticallysignificant difference (P < 0.05) <strong>of</strong> drug content wasobserved in different tablet brands. The hardness <strong>of</strong>the tablets is an essential criterion in thedetermination <strong>of</strong> the ability <strong>of</strong> the tablets to resistchipping, abrasion or breakage under conditions <strong>of</strong>storage, transportation and handling. The hardness <strong>of</strong>the tablet was found to be 2.5 – 5 kg/cm 2 (Table 3).Brand C required the least pressure before fracturewhile brand A required highest pressure. The results<strong>of</strong> the analysis <strong>of</strong> variance revealed significantdifference (P < 0.05) in hardness <strong>of</strong> all the fourbrands at 95% confidence interval. Tablet hardness isnot an absolute indicator <strong>of</strong> strength since someformulations, when compressed into very hardtablets, tend to cap on attrition, losing their, crownportions. Therefore, another measure <strong>of</strong> tabletsstrength, its friability, is <strong>of</strong>ten measured.Conventional compressed tablets that lose less than1% <strong>of</strong> their weight are generally consideredacceptable. The friability <strong>of</strong> the tablets (determinedusing Friabilator) was found between 0.012 – 0.102%(Table 3) that was below 1% indicating sufficientmechanical integrity and strength <strong>of</strong> the tablets.Analysis <strong>of</strong> variance revealed significant differencein friability (F calculated > F tabulated at 95% level) <strong>of</strong>branded tablets.For most tablets, the first important step towardsolution is breakdown or disintegration <strong>of</strong> the tabletsinto smaller particles or granules. Variousformulations factors are known to affectdisintegration time <strong>of</strong> tablets. Disintegration time is anecessary condition and could be the rate determiningstep in the process <strong>of</strong> drug absorption. The type andamount <strong>of</strong> excipients used in the tablet formulation aswell as the manufacturing process are all known toaffect the disintegration time <strong>of</strong> all tablets. Thedisintegration time <strong>of</strong> enteric coated dicl<strong>of</strong>enacsodium 50mg tablets were determined according tothe procedure reported in USP (USP 2007). Theenteric coated tablets pass the disintegration test ifeach <strong>of</strong> the six tablets does not disintegrates in 2hours in the simulated gastric fluid and tablets shoulddisintegrate in not more than 60 minutes in thesimulated intestinal fluid. The results <strong>of</strong> thedisintegration test are presented in Table 4. Theresults showed that all the brands passed thedisintegration test. However, analysis <strong>of</strong> variancerevealed significant difference in disintegration time (F calculated > F tabulated at 95% level ) <strong>of</strong> branded tablets.The drug release study is a measure <strong>of</strong> the amount <strong>of</strong>the drug released into the dissolution medium withtime. This study gives an idea <strong>of</strong> amount <strong>of</strong> drugavailable for absorption after oral administration.Drugs with poor dissolution pr<strong>of</strong>ile will not beavailable in the body system to elicit therapeuticeffect. The results <strong>of</strong> dissolution tests in terms <strong>of</strong>dissolution efficiency and time to dissolve 50% drug(t 50% ) are collected in Table 5, whereas thedissolution curves <strong>of</strong> dicl<strong>of</strong>enac sodium tablets fromdifferent manufactures are shown in Figure 3.The dissolution efficiency (DE) is defined as the areaunder the dissolution curve up to a certain time, t,expressed as a percentage <strong>of</strong> the area <strong>of</strong> rectangledescribed by 100% dissolution in the same time 27 .Vol. 3 (2) Apr – Jun2012 www.ijrpbsonline.com 877
<strong>In</strong>ternational Journal <strong>of</strong> Research in Pharmaceutical and Biomedical Sciences ISSN: 2229-3701t y.dt 0DE = 100% y100. t Where y is the drug percent dissolved in time t.DE can have a range <strong>of</strong> values depending on theinterval chosen. However, while comparing a set <strong>of</strong>data a constant time interval should be selected. <strong>In</strong>the present study, DE 10 minutes (dissolution efficiencyup to 10minutes) were calculated from dissolutionpr<strong>of</strong>ile <strong>of</strong> four brands <strong>of</strong> dicl<strong>of</strong>enac sodium tabletsand used for comparison.The time required for 50% ( t 50% ) <strong>of</strong> drug to bereleased from four brands <strong>of</strong> tablets A, B, C and Dwere 18.69, 17.47, 26.72 and 35.055 minutesrespectively ( Table 5). Moreover the DE als<strong>of</strong>ollows the same trend with brands A, B, C and Dhaving 14.87, 15.36, 2.91 and 0.995% respectively.Dissolution efficiency curves <strong>of</strong> tablets are presentedin Figure 4. From the dissolution efficiency pr<strong>of</strong>ile, itwas observed that the dissolution efficiency increasedin the following order D→C→A→B.Table 1: Brands <strong>of</strong> Dicl<strong>of</strong>enac sodium tablets used in the studyCODE BRAND NAME BATCH NO. MFG. DATE EXP. DATELABELLEDSTRENGTHMANUFACTURERA Voveran50 MNB/07558 06/2011 05/2014 50mgNovartis <strong>In</strong>dia Ltd.BaddiB Relaxyl 3950.A 10/2010 09/2013 50mgPrinceps Pharmaceutical Pvt. Ltd.,MumbaiC Dicloran G/820A 10/2010 09/2013 50mg Lekar Pharma Ltd., AnkleshwarD Vovo MNB/04/80 03/2010 02/2012 50mg Alembic Ltd., BaddiTable 2: Weight variation, thickness and diameter <strong>of</strong> dicl<strong>of</strong>enac sodium tabletsCode Weight (mg)(Mean±SD, n=20)Thickness (mm)(Mean±SD, n=20)Diameter(mm)(Mean±SD, n=20)A 251.50±0.010 3.60±0.052 8.42±0.049B 179.15±0.003 3.19±0.048 7.79±0.029C 164.07±0.002 4.70±0.053 7.45±0.040D 169.56±0.005 4.64±0.049 7.41±0.030Table 3: Drug content, hardness and friability <strong>of</strong> dicl<strong>of</strong>enac sodium tabletsCode Drug Content (%)(Mean±SD, n=3)Hardness (Kg- cm 2 )(Mean±SD, n=3)Friability(%)(Mean±SD, n=3)A 99.425±0.27 5±0.52 0.0127±0.004B 97.151±0.84 3±0.51 0.0128±0.006C 98.106±0.53 2.5±0.5 0.0135±0.005D 95.9±0.94 4.67±0.28 0.1020±0.070Table 4: Disintegration time <strong>of</strong> Dicl<strong>of</strong>enac sodium tabletsFormulationsDisintegration Time insimulated gastric fluidDisintegration Time insimulated intestinal fluidA No Disintegration after 120 min. 22 minutesB No Disintegration after 120 min. 25 minutesC No Disintegration after 120min. 23 minutesD No Disintegration after 120min 15 minutesVol. 3 (2) Apr – Jun2012 www.ijrpbsonline.com 878
<strong>In</strong>ternational Journal <strong>of</strong> Research in Pharmaceutical and Biomedical Sciences ISSN: 2229-3701Table 5: Characteristics <strong>of</strong> Dicl<strong>of</strong>enac sodium tabletsCode A B C Dt 50% (minutes) 18.09(0.337) 17.47(0.370) 26.72(0.069) 35.055(0.255)DE 10 (minutes) 14.87(0.184) 15.36(0.213) 2.91(0.204) 0.995(0.071)Figures in parentheses indicate ± SD, n=3 for t 50% and DE 10 minutes.Fig. 1: Structure <strong>of</strong> dicl<strong>of</strong>enac sodiumFig. 2: Calibration curve <strong>of</strong> Dicl<strong>of</strong>enac sodiumFig. 3: Dissolution pr<strong>of</strong>ile <strong>of</strong> four brands <strong>of</strong> Dicl<strong>of</strong>enac sodium tabletsVol. 3 (2) Apr – Jun2012 www.ijrpbsonline.com 879
<strong>In</strong>ternational Journal <strong>of</strong> Research in Pharmaceutical and Biomedical Sciences ISSN: 2229-3701polymorphonuclear leukocytes. Scand. JRheumatol. 1986;15:41–46.11. Mahgoub AA. Grapefruit juice potentiatesthe anti-inflammatory effects <strong>of</strong> dicl<strong>of</strong>enacon carrageenan-induced rat’s paw oedema.Pharmacol Res. 2002;45:1–4.12. Menasse R, Medwall PR, Kractz T, PericinC, Riesterer L, Sallmann A et al.Pharmacological properties <strong>of</strong> dicl<strong>of</strong>enacsodium and its metabolites. Scand. JRheumatol. 1978;22:5–16.13. Al-Tuwaijri AS and Mustafa AA. Verapamilenhances the inhibitory effect <strong>of</strong> dicl<strong>of</strong>enacon the chemiluminescence <strong>of</strong> humanpolymorphonuclear leukocytes andcarrageenan-induced rat’s paw oedema. <strong>In</strong>t JImmunopharm. 1992;14:83–91.14. Mahgoub AA. Grapefruit juice potentiatesthe anti-inflammatory effects <strong>of</strong> dicl<strong>of</strong>enacon carrageenan-induced rat’s paw oedema.Pharmacol Res. 2002;45:1–4.15. John VA. The pharmacokinetics andmetabolism <strong>of</strong> dicl<strong>of</strong>enac sodium (Voltarol)in animals and man. Rheumatol RehabilSuppl. 1979;2:22–37.16. Stierlin H and Faigle JW. Biotransformation<strong>of</strong> dicl<strong>of</strong>enac sodium (Voltaren) in animalsand in man II. Quantitative determination <strong>of</strong>the unchanged drug and principal phenolicmetabolites, in urine and bile. Xenobiotica.1979;9:601–610.17. Davis NM and Anderson KE. Clinicalpharmacokinetics <strong>of</strong> dicl<strong>of</strong>enac. Therapeuticinsights and pitfalls. Clin Pharmacokinet.1997;33:184–213.18. http://www.pharma.us.novartis.com/product/pi/pdf/Cataflam.pdf.19. Adeyeye CM and Pui-Kai Li. AnalyticalPr<strong>of</strong>iles <strong>of</strong> Drug Substances (Florey, K.Ed.), Vol.19, Academic Press, San Diego,1990;19:123-144.20. Reynolds JEF, Ed . Martindale, The ExtraPharmacopoeia, The Pharmaceutical Press,London, 1993;30:11.21. Willis JV, Kendall MJ, Flinn RM, ThornhillDP and Welling PG. The Pharmacokinetics<strong>of</strong> dicl<strong>of</strong>enac sodium following intravenousand oral administration. Eur J ClinPharmacol. 1979;16:405-410.22. Riess W, Stierlin H, Degen P, Faizle JW,Gerardin A, Moppert Sallmann A et al.Pharmacokinetics and metabolism <strong>of</strong> theanti-inflammatory agent Voltaren. Scand. JRheumatol. 1978;22:17-29.23. Borga O and Borga B. Serum proteinbinding <strong>of</strong> nonsteroidal antiinflammatorydrugs: A comparative study. JPharmacokinet Biopharm. 1997;25:63–77.24. Chamouard JM, Barce J, Urien S, Houin Gand Tillement JP. Dicl<strong>of</strong>enac binding toalbumin and lipoproteins in human serum.Biochem Pharmacol. 1985;34:1695–700.25. United States Pharmacopeia and NationalFormulary USP 24–NF 19; The UnitedStates Pharmacopeial Convention, <strong>In</strong>c.:Rockville, MD. 2000:1882–1883.26. <strong>In</strong>dian Pharmacopoeia, 4th Edition.Controller <strong>of</strong> Publications, New Delhi,1996;A- 80, 82.27. Khan KA. The concept <strong>of</strong> dissolutionefficiency. J pharm Pharmacol. 1975;21:48-49.Vol. 3 (2) Apr – Jun2012 www.ijrpbsonline.com 881


