Evidence from Firm-level Data in Vietnam
Evidence from Firm-level Data in Vietnam
Evidence from Firm-level Data in Vietnam

You also want an ePaper? Increase the reach of your titles
YUMPU automatically turns print PDFs into web optimized ePapers that Google loves.
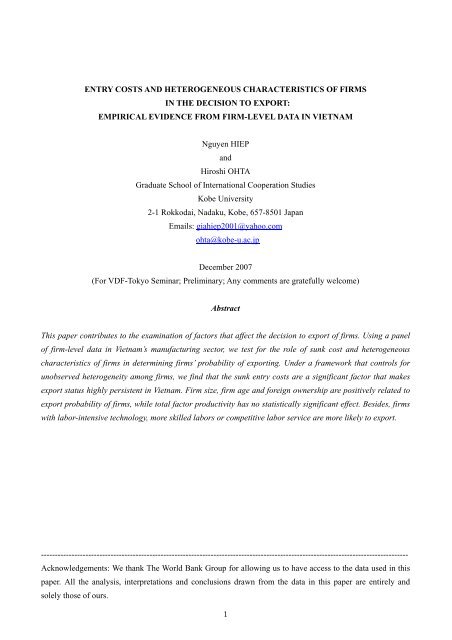
ENTRY COSTS AND HETEROGENEOUS CHARACTERISTICS OF FIRMSIN THE DECISION TO EXPORT:EMPIRICAL EVIDENCE FROM FIRM-LEVEL DATA IN VIETNAMNguyen HIEPandHiroshi OHTAGraduate School of International Cooperation StudiesKobe University2-1 Rokkodai, Nadaku, Kobe, 657-8501 JapanEmails: giahiep2001@yahoo.comohta@kobe-u.ac.jpDecember 2007(For VDF-Tokyo Sem<strong>in</strong>ar; Prelim<strong>in</strong>ary; Any comments are gratefully welcome)AbstractThis paper contributes to the exam<strong>in</strong>ation of factors that affect the decision to export of firms. Us<strong>in</strong>g a panelof firm-<strong>level</strong> data <strong>in</strong> <strong>Vietnam</strong>’s manufactur<strong>in</strong>g sector, we test for the role of sunk cost and heterogeneouscharacteristics of firms <strong>in</strong> determ<strong>in</strong><strong>in</strong>g firms’ probability of export<strong>in</strong>g. Under a framework that controls forunobserved heterogeneity among firms, we f<strong>in</strong>d that the sunk entry costs are a significant factor that makesexport status highly persistent <strong>in</strong> <strong>Vietnam</strong>. <strong>Firm</strong> size, firm age and foreign ownership are positively related toexport probability of firms, while total factor productivity has no statistically significant effect. Besides, firmswith labor-<strong>in</strong>tensive technology, more skilled labors or competitive labor service are more likely to export.------------------------------------------------------------------------------------------------------------------------------------Acknowledgements: We thank The World Bank Group for allow<strong>in</strong>g us to have access to the data used <strong>in</strong> thispaper. All the analysis, <strong>in</strong>terpretations and conclusions drawn <strong>from</strong> the data <strong>in</strong> this paper are entirely andsolely those of ours.1
I. INTRODUCTIONInternational trade is considered a significant channel for growth by almost every country. Even those such asRussia or <strong>Vietnam</strong> that used to follow centralized economic regime have started to rush for the membership ofthe World Trade Organization <strong>in</strong> order to take benefit <strong>from</strong> trad<strong>in</strong>g with others for the sake of their owneconomic growth. Slow improvement <strong>in</strong> productivity is known as the ma<strong>in</strong> force that caused the collapse ofnon-market economies <strong>in</strong> the 1990s. There are many sources for productivity growth, and economicrelationship with foreign countries has proved an important channel for activat<strong>in</strong>g these sources. The positiverelationship between openness and growth has been confirmed by many empirical studies us<strong>in</strong>g aggregateeconomy-wide data [see Baldw<strong>in</strong> (2003) or Rodriguez (2006) for related literature review]. Among thechannels that connect a country with others, export<strong>in</strong>g is probably the one that attracts the most attention <strong>in</strong>the literature study<strong>in</strong>g the sources for a country’s productivity growth. Mart<strong>in</strong> (1992) f<strong>in</strong>ds a causal l<strong>in</strong>k <strong>from</strong>exports to higher productivity growth for four <strong>in</strong>dustrialized countries (United States, Japan, Germany, andUnited K<strong>in</strong>gdom). In a review of many empirical macro-data studies on whether export-led growth hypothesisis valid for develop<strong>in</strong>g countries, Med<strong>in</strong>a-Smith (2001) f<strong>in</strong>ds that the empirical results suggest exports have apositive effect on the overall rate of economic growth and could be considered an “eng<strong>in</strong>e of growth” fordevelop<strong>in</strong>g countries, though the <strong>level</strong>s of impact are case-dependent. Such a causal relationship on theaggregate <strong>level</strong> can work through some channels. Export<strong>in</strong>g may <strong>in</strong>duce reallocation of scarce resourcestoward <strong>in</strong>dustries that are more productive, <strong>in</strong> other words, toward <strong>in</strong>dustries that have comparative advantage.This is usually referred to as trade-<strong>in</strong>duced cross-<strong>in</strong>dustry reallocation. This channel is successfully expla<strong>in</strong>edby standard trade models. However, there are other channels that can not be expla<strong>in</strong>ed by the traditionalmodels that assume a representative firm or identical firms. A possible one is trade-<strong>in</strong>duced with<strong>in</strong>-firmproductivity improvement: firms become more productive as they export. Another channel is trade-<strong>in</strong>ducedwith<strong>in</strong>-<strong>in</strong>dustry reallocation <strong>in</strong> favor of export<strong>in</strong>g firms that are more productive than non-exporters. Theseare subject matters of heterogeneous-firm trade models, the strand that recently accounts for the huge majority<strong>in</strong> trade-related literature. Trade is no longer considered as a “black box”. The <strong>in</strong>teractions betweenheterogeneous firms that actually drive trade between countries are exam<strong>in</strong>ed properly <strong>in</strong> these models.In fact, firms are different <strong>in</strong> many aspects, even when they face the same macroeconomicconditions or operate <strong>in</strong> the same narrowly-def<strong>in</strong>ed <strong>in</strong>dustry. In export activities, firms also behave differently.<strong>Firm</strong>-<strong>level</strong> data <strong>from</strong> many countries show that just a small fraction of firms are <strong>in</strong>volved <strong>in</strong> <strong>in</strong>ternational trade,not to mention foreign <strong>in</strong>vestment activities, while the majority choose to solely serve domestic markets. Forexample, of 5.5 million firms <strong>in</strong> the U.S. economy <strong>in</strong> 2000, just 4 per cent were exporters [Bernard et al. (2007b)].Not only does heterogeneity exist between trad<strong>in</strong>g and non-trad<strong>in</strong>g firms, it also exists between firms that sell toforeign markets. Also cited <strong>in</strong> Bernard et al. (2007b), 96 per cent of total U.S. exports <strong>in</strong> 2000 was shipped by 10per cent of export<strong>in</strong>g firms. It is reasonable to th<strong>in</strong>k that there must be firm-specific characteristics thatsignificantly <strong>in</strong>fluence a firm’s behavior and capability to perform <strong>in</strong> foreign markets. Therefore, it is moreappropriate to exam<strong>in</strong>e trade and related issues under the framework of firm heterogeneity. The need for<strong>in</strong>tegrat<strong>in</strong>g firms’ behaviors <strong>in</strong>to trade models is also necessitated by at least two more pieces of facts. Thefirst is, <strong>in</strong> models at country- or <strong>in</strong>dustry-<strong>level</strong>, factors such as technological <strong>in</strong>novation or human capital areconsidered as those shap<strong>in</strong>g comparative advantage. However, many activities related to these factors such asR&D process or human capital development are carried out by <strong>in</strong>dividual firms or plants. These activities are2
certa<strong>in</strong>ly different among firms. Therefore, when firm heterogeneity is <strong>in</strong>tegrated <strong>in</strong>to trade models, it helpsnot only solve those issues <strong>in</strong>tact by old trade theories but also <strong>in</strong>terpret the f<strong>in</strong>d<strong>in</strong>gs of standard trade modelsmore properly. And the second is, firm-<strong>level</strong> analysis is more implicative to trade policy makers. It ismisguided if policies ignore differences not only between <strong>in</strong>dustries but also between firms, or even betweentypes of behaviors of firms.Although this need was spotted out long time ago, studies of trade with firm heterogeneity did notdevelop until the mid-1990s. At that time, firm-<strong>level</strong> data became more accessible to researchers <strong>in</strong> somecountries, giv<strong>in</strong>g more chances for do<strong>in</strong>g related empirical work. A path-break<strong>in</strong>g paper is Bernard andJensen’s (1995). S<strong>in</strong>ce then, empirical and theoretical studies <strong>in</strong> this field have flourished and contributedgreat <strong>in</strong>sights <strong>in</strong>to the literature, with <strong>in</strong>tensive focus on the <strong>in</strong>vestigation of the relationship betweencharacteristics of firms, especially productivity, and export<strong>in</strong>g behaviors of firms. <strong>Firm</strong>s that export are found<strong>in</strong> empirical studies to be better than firms that serve only domestic markets. The term “exceptional exportperformance” first used by Bernard and Jensen (1999) to describe their f<strong>in</strong>d<strong>in</strong>gs of the superiority of exporters<strong>in</strong> the U.S. manufactur<strong>in</strong>g sector is now widely employed by many other researchers <strong>in</strong> different countries,imply<strong>in</strong>g the fact that exporters are superior to non-exporters almost everywhere. Exporters <strong>in</strong> the U.S. havehigher productivity, more workers, proportionally more white collar workers, higher wages, greater capital<strong>in</strong>tensity, higher technology <strong>in</strong>tensity, and more likely to be part of a multi-plant firm [Bernard and Jensen(1995, 1997, 1999, 2004)]. Accord<strong>in</strong>g to Wagner’s (2007) survey of related studies published by the year2005, the superiority of exporters can also be seen <strong>in</strong> almost other <strong>in</strong>dustrialized countries such as UK,Canada, Germany, or Italy; <strong>in</strong> newly emerg<strong>in</strong>g and develop<strong>in</strong>g countries <strong>in</strong> Asia such as Ch<strong>in</strong>a, Korea, Taiwan,or Indonesia; <strong>in</strong> transition countries <strong>in</strong> Lat<strong>in</strong> America or Eastern Europe and even <strong>in</strong> some least developedcountries <strong>in</strong> Sub-Saharan Africa.However, the differences between exporters and non-exporters at a given moment do not tell usanyth<strong>in</strong>g about the direction of causality. Two hypotheses that are frequently tested <strong>in</strong> the analysis of therelationship between firm’s performance, especially productivity, and export<strong>in</strong>g behaviors are: (i) better firmsself-select <strong>in</strong>to export markets and (ii) learn<strong>in</strong>g-by-export<strong>in</strong>g makes export<strong>in</strong>g firms better. Most studies thatf<strong>in</strong>d more productive firms become exporters accrue the fact to the existence of additional costs <strong>in</strong> serv<strong>in</strong>gforeign markets, majority of them are sunk. These costs h<strong>in</strong>der less productive firms <strong>from</strong> enter<strong>in</strong>g exportmarkets, only the most productive firms can ga<strong>in</strong> enough profits to compensate for the costs and export.Besides, better firms export because they are forward-look<strong>in</strong>g <strong>in</strong> export<strong>in</strong>g decision. <strong>Firm</strong>s who desire toexport <strong>in</strong> the future try to improve themselves now to enhance their competitiveness <strong>in</strong> the foreign markets.Roberts and Tybout (1997) are known as the first who consider the <strong>in</strong>teraction between entry costs and firmcharacteristics <strong>in</strong> exam<strong>in</strong><strong>in</strong>g firms’ export behavior. Us<strong>in</strong>g an empirical dynamic framework that takes <strong>in</strong>toaccount sunk entry costs and the heterogeneity of firm characteristics, they f<strong>in</strong>d that sunk entry costs are largeand a significant source of export persistence <strong>in</strong> Colombia <strong>in</strong> the period of 1981-1989. Controll<strong>in</strong>g for thepresence of these sunk costs, they also f<strong>in</strong>d that observed characteristics such as firm size, age and corporationownership as well as unobserved ones significantly contribute to the probability of a firm to become anexporter. This framework has been used <strong>in</strong>tensively by other studies. Us<strong>in</strong>g the same framework but differenttest<strong>in</strong>g specifications, Bernard and Jensen (2004) exam<strong>in</strong>e the roles of entry costs, firm characteristics,<strong>in</strong>dustrial and sectoral spillovers and trade promotion on the probability of entry <strong>in</strong>to export<strong>in</strong>g of firms <strong>in</strong> theU.S. manufactur<strong>in</strong>g sector <strong>in</strong> the period of 1984 to 1992. They f<strong>in</strong>d that export<strong>in</strong>g today raises the probability3
of export<strong>in</strong>g tomorrow by 39 percent, imply<strong>in</strong>g the significance of entry costs as a determ<strong>in</strong>ant of export<strong>in</strong>g.They also f<strong>in</strong>d that firm heterogeneity is substantial and important <strong>in</strong> export decision: firms that have largersize, higher labor quality, or product <strong>in</strong>novation are more likely to self-select to become exporters. However,productivity is found to have no statistically significant effect on probability of export<strong>in</strong>g <strong>in</strong> the specificationpreferred by the authors. For exogenous factors, favorable exchange rate shocks do <strong>in</strong>crease participation <strong>in</strong>export<strong>in</strong>g, but there are no statistically significant effects of <strong>in</strong>dustrial and sectoral spillovers and tradepromotion at the state <strong>level</strong>s. Arnold and Huss<strong>in</strong>ger (2005) f<strong>in</strong>d <strong>in</strong> their study of German manufactur<strong>in</strong>g firmsbetween 1992 and 2000 that there is a causal relationship <strong>from</strong> high productivity to enter<strong>in</strong>g foreign markets,besides other f<strong>in</strong>d<strong>in</strong>gs that confirm the positive effects of some other characteristics such as past export status,size, R&D <strong>in</strong>tensity, product <strong>in</strong>novation, or skills. However, f<strong>in</strong>d<strong>in</strong>gs <strong>in</strong> Greenaway and Kneller (2004) showthat the effect of productivity is not statistically significant, though positive, <strong>in</strong> U.K. manufactur<strong>in</strong>g sector <strong>in</strong>the period between 1989 and 2002 when the whole population of firms exam<strong>in</strong>ed, though effects of othercharacteristics such as size, past export participation or <strong>in</strong>dustrial and geographical spillovers are significantlypositive. In Clerides et al. (1998), there is evidence about the self-selection of more productive firms <strong>in</strong>toexport<strong>in</strong>g <strong>in</strong> Colombia and Morocco, but not <strong>in</strong> Mexico. This study also f<strong>in</strong>ds <strong>in</strong> Colombia a positiveexternality of export<strong>in</strong>g: The presence of other exporters <strong>in</strong> a region or a sector might make it easier fordomestically oriented firms to break <strong>in</strong>to foreign markets, show<strong>in</strong>g export<strong>in</strong>g externality a source for exportentry. In other studies, the positive effect of productivity on a firm’s probability of be<strong>in</strong>g an exporter can alsobe seen <strong>in</strong> Chile [data of 1990-1996 period, Alvarez and Lopez (2005)]; Taiwan [1981-1991, Aw et al. (1997,2000)]; Spa<strong>in</strong> [1991-1996, Delgado et al. (2002)] or Estonia [1994-1999, S<strong>in</strong>ami and Hobdari (2007)]; whileno significant effect is observed <strong>in</strong> Indonesia [1990-1996, Blalock and Gertler (2004)], Korea [1983-1993, Awet al. (2000); 1990-1998, Hahn (2004)]; Italia [1991-1994, Castellani et al. (2002)]; Sweden [1990-1999,Hansson and Lund<strong>in</strong> (2004)] or Cameroon, Ghana, Kenya and Zimbabwe [1992-1994, Bigsten et al. (2004)].Especially, Damijan et al. (2004) f<strong>in</strong>d <strong>from</strong> the 1994-2002 data of Slovenian firms that the effect ofproductivity on self-selection <strong>in</strong>to different foreign markets is different: higher productivity <strong>level</strong> is requiredfor firms start<strong>in</strong>g to export to advanced economies as apposed start<strong>in</strong>g to export to develop<strong>in</strong>g countries.The above-mentioned evidences are accompanied by theoretical breakthroughs <strong>in</strong> the same area of<strong>in</strong>terest. New trade theory has been said to turn <strong>in</strong>terest <strong>from</strong> a trad<strong>in</strong>g world with the representative firm orwith identical firms to the one <strong>in</strong> which firms are heterogeneous <strong>in</strong> the underly<strong>in</strong>g characteristics. The basicargument of trade theory <strong>in</strong> this literature is that the presence of sunk costs of entry <strong>in</strong>to foreign marketstogether with that of firm heterogeneity can expla<strong>in</strong> why some firms export but others do not. In an effort tosupport their empirical framework, Roberts and Tybout (1997) model sunk trade costs and firm heterogeneity<strong>in</strong> a partial equilibrium analysis with discrete choice. Us<strong>in</strong>g this framework, they state that among firms thathave low marg<strong>in</strong>al costs, only those that are sufficiently productive enough to cover sunk entry costs <strong>from</strong>their profits can export. Melitz (2003) is considered a pioneer <strong>in</strong> the theoretical analysis of trade with firmheterogeneity under general equilibrium framework. His paper can expla<strong>in</strong> theoretically not only theexport<strong>in</strong>g behaviors of firms but also the productivity structure of <strong>in</strong>dustries <strong>in</strong> a more general dynamic modelwith cont<strong>in</strong>uous choice, sunk entry costs and heterogeneous firms under monopolistic competition. The paperconcludes that exposure to trade will <strong>in</strong>duce only the most productive firms to enter the export market whilesome less productive firms cont<strong>in</strong>ue to produce only for the domestic customers, and the least productivefirms will be forced to exit. Besides, more exposure to trade will lead to additional <strong>in</strong>ter-firm reallocations4
towards more productive firms. <strong>Firm</strong>s with higher productivity will therefore be possible exporters, be able tohave higher sales, market share and profit. Trade liberalization will not only favor the more productive firmsbut also help improve <strong>in</strong>dustry aggregate productivity via the above-mentioned self-selection and reallocationprocess. Although this core model is now be<strong>in</strong>g extended <strong>in</strong> various ways [such as <strong>in</strong> Helpman et al. (2007),Melitz and Ottaviano (2005), Falvey et al. (2006), or Bernard et al. (2007a) etc.], the ma<strong>in</strong> argumentsrelated to the relationship between firm heterogeneity and firms’ export<strong>in</strong>g behaviors are the same.All these established theoretical backgrounds emphasize the importance of the comb<strong>in</strong>ation of firmheterogeneity and sunk costs <strong>in</strong> determ<strong>in</strong><strong>in</strong>g behaviors of firms <strong>in</strong> do<strong>in</strong>g bus<strong>in</strong>ess abroad. This also implies agood reason for the explanation of the mixed f<strong>in</strong>d<strong>in</strong>gs <strong>in</strong> related standard empirical works across countriesand time, as reviewed <strong>in</strong> previous paragraphs <strong>in</strong> this section. Roberts and Tybout (1997) argue that because ofthis comb<strong>in</strong>ation, there are forces that are likely to be idiosyncratic with respect to country and time. <strong>Firm</strong>s havedifferent behaviors due to their characteristics and the sunk costs. However, the magnitude of their responsedepends on the availability of <strong>in</strong>formation they have about foreign markets, the type of market they are likely toenter, the type of products be<strong>in</strong>g exported, the number and type of exist<strong>in</strong>g firms <strong>in</strong> export<strong>in</strong>g markets, or thepolicy regime. Given the number of idiosyncratic forces at work, it is not surpris<strong>in</strong>g that standard empirical exportsupply functions have exhibited marked <strong>in</strong>stability across countries and time.The purpose of the analysis <strong>in</strong> this paper is to exam<strong>in</strong>e possible determ<strong>in</strong>ants, especially those <strong>from</strong>characteristics of firms, on their probability of be<strong>in</strong>g an exporter <strong>in</strong> the case of <strong>Vietnam</strong>. <strong>Vietnam</strong> is known asa successful newly-emerg<strong>in</strong>g country with high and stable economic growth rates and fast track of tradeliberalization. Under a comprehensive but prudent reform s<strong>in</strong>ce 1986, <strong>Vietnam</strong> is mov<strong>in</strong>g forward to a marketeconomy. The number of firms <strong>in</strong> this country has been <strong>in</strong>creas<strong>in</strong>g rapidly with more and more contribution<strong>from</strong> non-state owned enterprises. The number of firms <strong>in</strong> 2004 is about 92 thousands, more than twice asmany as that <strong>in</strong> 2000, and non-state owned firms account for over 90 per cent of this number [GSO (2005)].Exports have been <strong>in</strong>creas<strong>in</strong>g much faster than GDP, with annual growth rates of about 20 per cent <strong>from</strong> 1990.The government is striv<strong>in</strong>g more <strong>in</strong>tensively to encourage exports for enhanc<strong>in</strong>g the country’s economicgrowth. Besides substantially reduc<strong>in</strong>g both tariff and non-tariff barriers to trade and mak<strong>in</strong>g great efforts toopen up foreign markets via bilateral and multilateral trade liberalization negotiations, the country has alsohad a wide range of export promotion measures to foster exports. The measures aim at promot<strong>in</strong>g both exportparticipation and export <strong>in</strong>tensity. They <strong>in</strong>clude f<strong>in</strong>ancial <strong>in</strong>centives such as reduction of land rent, corporate<strong>in</strong>come tax, or material import tax for exporters; or establishment of export support fund and export awardfund to provide f<strong>in</strong>ancial support and rewards to exporters, especially to those who succeed <strong>in</strong> export<strong>in</strong>g newproducts, to new markets or <strong>in</strong> large volume. However, export performance of <strong>Vietnam</strong> does not reach whatexpected or targeted for. <strong>Vietnam</strong>’s exports are still small with export revenue per capita of about USD 300 <strong>in</strong>2005; export products are ma<strong>in</strong>ly traditional ones with low value; or export prices are below world marketprices. Even though the export volume <strong>in</strong>creases, the “quality” of the export sector such as export structure orcompetitiveness does not improve much. This fact implies that more efforts should be paid to the sett<strong>in</strong>g ofexport strategies and export promotion <strong>in</strong> <strong>Vietnam</strong>. Therefore, understand<strong>in</strong>g the determ<strong>in</strong>ants of exportbehaviors of firms via the evidence <strong>from</strong> firm-<strong>level</strong> data must be necessary and implicative. Up to now, thereare not many studies us<strong>in</strong>g firm-<strong>level</strong> panel data <strong>in</strong> this research area <strong>in</strong> <strong>Vietnam</strong>. This paper is thereforeexpected to be among the first to contribute. Furthermore, an empirical test of determ<strong>in</strong>ants of export<strong>in</strong>g us<strong>in</strong>gfirm-<strong>level</strong> data <strong>in</strong> a develop<strong>in</strong>g country under a fast track of trade liberalization like <strong>Vietnam</strong> must be a sound5
contribution to the literature that still shows controversy due to mixed empirical results.In this paper, an export decision model will be used for exam<strong>in</strong><strong>in</strong>g possible effects of entry costs andfirm characteristics on the probability of export<strong>in</strong>g. The model will be tested <strong>in</strong> a framework that controls forunobserved heterogeneity among firms, us<strong>in</strong>g panel data of 1150 <strong>Vietnam</strong>’s manufactur<strong>in</strong>g firms surveyed bythe World Bank Group. One of the important characteristics of firms employed <strong>in</strong> this analysis is total factorproductivity used as a measure of productivity of firms. It is estimated <strong>in</strong> a more accurate way by employ<strong>in</strong>gsemi-parametric model that controls for the phenomenon of possible simultaneity usually faced <strong>in</strong>productivity calculation. Among the specifications employed <strong>in</strong> this paper, a dynamic random effects probitmodel is chosen as the preferred measure to test for the relationship of <strong>in</strong>terest. We expect to have properexplanation of the decision to export of firms <strong>in</strong> <strong>Vietnam</strong>, especially the role of sunk costs, productivity, <strong>in</strong>put<strong>in</strong>tensity, firm size and firm age.The paper is outl<strong>in</strong>ed as follows. The next section, Section II, specifies theoretical background andempirical framework of the model. Section III describes the data used while Section IV argues for the choiceof estimation specifications and variables. The estimation results are <strong>in</strong>terpreted and discussed <strong>in</strong> Section V.Section VI raises conclud<strong>in</strong>g remarks.II. THEORETICAL BACKGROUND AND EMPIRICAL FRAMEWORKII.1 Theoretical backgroundIt is usually assumed <strong>in</strong> models of the type that the decision to export of a rational and profit-maximiz<strong>in</strong>g firmis endogenous to its decision to market a new product. Roberts and Tybout (1997) develop a dynamic modelof export<strong>in</strong>g with entry costs. The model is applied by almost all the parametrically empirical studies of theexport<strong>in</strong>g behavior because it takes <strong>in</strong>to account the entry costs so that the heterogeneity <strong>in</strong> productivitybetween firms becomes relevant <strong>in</strong> the decision to export or not to export of firms. We will also follow thisframework <strong>in</strong> this study. A firm will export if the expected profit <strong>from</strong> do<strong>in</strong>g so net any fixed entry costs isnon-negative. Before gett<strong>in</strong>g to the expected value of profits <strong>in</strong> a multiple period framework with entry costs,we consider first the s<strong>in</strong>gle period case of maximization with no entry costs. Assume that at the period t , ifthe firm i produces and sells to foreign markets, it will always be able to produce at*q it, theprofit-maximiz<strong>in</strong>g <strong>level</strong> of exports. The profit the firm can yield isπ ( Xitt, Zit) =pitq*it− c ( Xitt, Zit| q*it)(1)*where p is the price of the goods sold abroad and (.) is the variable cost of produc<strong>in</strong>g q ; X anditc itittZitare vectors of exogenous factors and firm-specific factors affect<strong>in</strong>g profitability of the firm, respectively.The firm will export if this profit is non-negative. Denote the export status of the firm i at the period t byYit, we haveYit⎧1 if πit≥ 0= ⎨⎩0 otherwise(2)6
In the framework of multiple periods without sunk e ntry costs, the expected profit of the firm becomeswhere−t( [ pisqis− cis( Xs, Zis| qis)s **∑ ∞ t s=tπ ( X , Z ) = E δ)](3)ittitδ is the one-period discount rate. If there is any effect of today’s production on the costs tomorrow,such as learn<strong>in</strong>g-by-do<strong>in</strong>g <strong>in</strong> the production of exports, the current export status of the firm will have someeffects on the decision to export the next period. This is because th e cost function <strong>in</strong> the function of expected* *profit now is c c X , Z , q | q ) with ∂c/ ∂q0 . The value function of the firm isit=it(t t it−1 itit it−1≠Vit* t +qTherefore, the export<strong>in</strong>g behavior of the firm will be( )*(.) = max πitYit+ δE[ V it 1(.)| q it] . (4)itYit⎧1if πit+ δEt[ V= ⎨⎩0otherwise(.) | q> 0] − δE[ V(.) | q**it+1 itt it+1 it= 0] ≥ 0(5)Now consider the case with sunk entry costs. As stated <strong>in</strong> the <strong>in</strong>troduction, entry costs are an important factor<strong>in</strong> the decision to export of firms. Costs associated with enter<strong>in</strong>g foreign market may <strong>in</strong>clude those <strong>in</strong>acquir<strong>in</strong>g <strong>in</strong>formation about the markets, <strong>in</strong> adjust<strong>in</strong>g the production process and products to satisfy foreigncustomers, or <strong>in</strong> sett<strong>in</strong>g up distribution network abroad. Most of these costs are by nature sunk. It is usuallyassumed that firms will not have to pay the entry cost if they exported <strong>in</strong> the previous period. If there are sunkcosts <strong>in</strong>volved <strong>in</strong> tak<strong>in</strong>g up export activities, a forward-look<strong>in</strong>g firm will look beyond the present period <strong>in</strong> itsdecision to export or not to export. The presence of sunk costs makes the decision rule dynamic, becauseexport<strong>in</strong>g today carries an additional option value of be<strong>in</strong>g able to export tomorrow without pay<strong>in</strong>g the sunkcosts of export<strong>in</strong>g. If we denote N be the entry cost for a firm, <strong>in</strong> the s<strong>in</strong>gle period maximization problem,its profit is as follows:~*** *π ( X , Z , q ) p q − c ( X , Z , q | q ) − N(1Y ) (6)ittitit−1=it it itit −1it− it− 1The firm will export if this profit is non-negative, that is, Y = 1 if ~itπit≥ 0 and Yit= 0 otherwise. In thedynamic maximization problem, the firm will maximize the expected value of profits by choos<strong>in</strong>g a sequencetitof export quantities∞{ q * } . In other words, the firm will maximize the follow<strong>in</strong>g:iss=tΠits−t( ( ~isYis)∑ ∞t s=t( X , Z ) = E δ π )(7)titThe form of the value function is the same as that <strong>in</strong> the case of without entry cost:V (.) = max πAnd the condition of export<strong>in</strong>g decision isit( ~*Y E [ V (.) | q ])+ δ (8)* it it t it+1 itqitYit⎧1if ~ πit+ δEt[ V= ⎨⎩0otherwise(.) | q> 0] − δE[ V(.) | q**it+1 itt it+1 it= 0] ≥ 0(9)or7
Yit*⎧ if pitqit+ δEt[V= ⎨⎩0otherwiseq> 0] − δE[ V= 0] ≥ cq ) + N(1− Y*** *1it+1(.)|itt it+1(.)|itit(t,it,it−1|itit−1qXZq)(10)All the above-mentioned details are theoretical backgrounds for the choice of empirical framework thatfollows.II.2. Empirical frameworkEquation (10) is the basis for choos<strong>in</strong>g our empirical framework. There are two ways we may proceed toestimate it. We could either develop a structural representation of this condition by mak<strong>in</strong>g specificassumptions of the cost function, or choose to employ a non-structural model <strong>in</strong> test<strong>in</strong>g hypotheses about therole of exogenous factors and firm-specific characteristics that may affect the decision to export of firms. Asstated <strong>in</strong> Roberts and Tybout (1997), although it is advantageous to use the first approach when it can providea complete description of the dynamic process, it is difficult to do so because of the dynamic dependence ofvariables, especially that of sunk costs. Therefore, we follow herewith the second approach, as many othersdo. Instead of specify<strong>in</strong>g parameters of the cost function to determ<strong>in</strong>e the function of profits, we will identifyand quantify the factors that may <strong>in</strong>crease the probability with which a firm is an exporter. The approachemployed <strong>in</strong> this paper is a b<strong>in</strong>ary-choice non-structural one, as stated below:Yit⎧ if γXt+ βZ= ⎨⎩0 otherwise− N(1− Y) + u1itit−1 it≥ 0(11)whereZitis the vector of firm-specific characteristics,X is the vector of exogenous factors, and u istitthe error term. Depend<strong>in</strong>g on the purpose of each specification as well as the characteristics and availability ofdata, different elements of Zit , Xt and uitwill be chosen.III. DATA DESCRIPTION<strong>Data</strong> used <strong>in</strong> this paper is <strong>from</strong> Productivity and the Investment Climate Enterprise Survey of <strong>Vietnam</strong>(<strong>Vietnam</strong> PICS), conducted by the World Bank with the coord<strong>in</strong>ation of Asian Development Bank (ADB) <strong>in</strong>2005. The source of this data is <strong>from</strong> Enterprise Surveys, the World Bank Group. <strong>Vietnam</strong> PICS surveyed1,150 firms <strong>in</strong> the manufactur<strong>in</strong>g sector of the country, follow<strong>in</strong>g random sampl<strong>in</strong>g methodology. The samplesize is generated with the aim to conduct statistically robust analyses of ma<strong>in</strong> estimates with <strong>level</strong>s ofprecision at a m<strong>in</strong>imum 7.5 per cent precision for 90 per cent confidence <strong>in</strong>tervals. This survey <strong>in</strong>volvesface-to-face <strong>in</strong>terviews with manag<strong>in</strong>g directors, accountants, human resource managers and other companystaff, giv<strong>in</strong>g a reliable and comprehensive coverage of firm’s characteristics. Although the majority of thequestions <strong>in</strong> the questionnaire ask for <strong>in</strong>formation <strong>in</strong> 2004, there are questions that are structured on theretrospective basis. This makes it possible for us to construct a panel of data of ma<strong>in</strong> variables for the years<strong>from</strong> 2002 to 2004. The survey gives us a good data set for do<strong>in</strong>g analysis <strong>in</strong> this paper, <strong>in</strong>clud<strong>in</strong>g general<strong>in</strong>formation of firms (ownership, establishment year, <strong>in</strong>dustry, or location); sales and supplies (direct exportshare, year first exported); labor relations (number of employees or employees’ compensation); or production,8
expenses and assets.Table 1: SAMPLE NUMBERS OF EXPORTERS AND NON-EXPORTERS IN INDUSTRIESIndustriesTotalNumber offirmsNon-exportersExportersExportershare (%)Food and Beverage 182 103 79 43.41Textiles 69 25 44 63.77Garments 7018 52 74.28Leather Products 22 4 18 81.82Wood and Wood Products 134 79 55 41.04Paper 59 51 8 13.56Chemical & Chemical Products 58 47 11 18.97Rubber, Plastic and Non-metallic Products64 46 18 28.12Metals and Metal Products116 102 14 12.07Mach<strong>in</strong>ery, Equipment and Electrical Products 58 44 14 24.14Electronics 19 13 6 31.57Construction Materials87 72 15 17.24Others 119 96 23 19.33Total 1057 700 357 33.77Source:Author’s calculation <strong>from</strong> the data set.The sample is about 5.6 per cent of 20.5 thousands manufactur<strong>in</strong>g firms <strong>in</strong> <strong>Vietnam</strong> <strong>in</strong> 2004 [GSO(2005)]. After controll<strong>in</strong>g for miss<strong>in</strong>g data and outliers, the rema<strong>in</strong><strong>in</strong>g size of the sample is about 90 per centof the orig<strong>in</strong>al one. This is a reasonable drop rate <strong>in</strong> a micro survey data. In this data set, exporters (def<strong>in</strong>ed asfirms that directly export at least 10 per cent of their sales) account for about 34 per cent of the firms <strong>in</strong> 2004.There are export<strong>in</strong>g firms <strong>in</strong> all the <strong>in</strong>dustries, <strong>in</strong> which <strong>in</strong>dustries of food and beverage, textiles, garments,leather products, and wood and wood products show high shares of number of exporters (see Table 1).Although export status is not a criterion for choos<strong>in</strong>g the sample, this is close to the real state of thepopulation of firms <strong>in</strong> <strong>Vietnam</strong>. Accord<strong>in</strong>g to a complete survey of enterprises <strong>in</strong> <strong>Vietnam</strong> <strong>in</strong> 1998, thenumber of manufactur<strong>in</strong>g firms that exported <strong>in</strong> 1998 is 32.3 per cent of the total firms <strong>in</strong> the sector, with veryhigh shares of <strong>in</strong>dustries of food and beverage, textiles, garments, leather and wood [GSO (1998)]. In thesurvey of firms <strong>in</strong> 30 Northern prov<strong>in</strong>ces <strong>in</strong> 2005, 40.8 per cent of firms who responded to the survey reporthav<strong>in</strong>g export<strong>in</strong>g potentials [SME TAC (2005)]. It is not always possible to realize these potentials. Hence,the share of exporters must be somewhat below this figure. Therefore, it is also appropriate to use this samplefor analyz<strong>in</strong>g export<strong>in</strong>g behaviors of firms <strong>in</strong> <strong>Vietnam</strong>.9
IV. ESTIMATION SPECIFICATIONS AND VARIABLE DISCRIPTIONIV.1. Estimation specifications:Our purpose is to exam<strong>in</strong>e determ<strong>in</strong>ants of the decision to export of firms via test<strong>in</strong>g the causal effects of sunkcosts and firm characteristics, especially productivity, on the probability of a firm to be an exporter. We firstf<strong>in</strong>d the difference between exporters and non-exporters <strong>in</strong> some ma<strong>in</strong> characteristics at a given moment oftime, then test the causality runn<strong>in</strong>g <strong>from</strong> the sunk costs and firm characteristics to export probability.In models hav<strong>in</strong>g b<strong>in</strong>ary dependent variables, logit, probit or l<strong>in</strong>ear probability models are usuallyemployed. However, there are some issues <strong>in</strong> the model of export decision that should be taken <strong>in</strong>toconsideration when choos<strong>in</strong>g estimation strategies. First, it is likely that there are unobserved characteristicsthat have significant effects on the decision to export by the firm. Second, export<strong>in</strong>g is highly persistent due tothe presence of sunk entry costs, lead<strong>in</strong>g to the necessity to <strong>in</strong>clude the lagged dependent variable <strong>in</strong> the righthand side of estimation equations. And third, as discussed <strong>in</strong> the previous section, there may exist two-wayrelationship between export<strong>in</strong>g behaviors and characteristics of firms, possibly caus<strong>in</strong>g problem ofsimultaneity. We will discuss one by one, not<strong>in</strong>g that it is not always able to do so separately due to the<strong>in</strong>teraction among them.It is reasonable to believe that there are many factors that are <strong>in</strong>fluential to firms’ decision to exportor not to export but unobservable. They are either firm-specific or exogenous, and <strong>in</strong> the dynamic framework,time variant or <strong>in</strong>variant. The observed and unobserved exogenous factors can be controlled for to someextent by us<strong>in</strong>g <strong>in</strong>dustry, location or time dummies or first-difference framework <strong>in</strong> panel analysis. However,the presence of unobserved firm-specific characteristics (usually termed as unobserved firm heterogeneity) <strong>in</strong>the model may raise some proble ms, especially when lagged dependent variables are <strong>in</strong>cluded as explanatoryvariables. In practice, the error term u itis a composite error represent<strong>in</strong>g all unobserved firm-specificcharacteristics. It can be thought of as compris<strong>in</strong>g two components: a time-<strong>in</strong>variant firm-specific componentεiand a transitory componentηit(usually termed as idiosyncratic error). Ifεiis not properly controlledfor, estimates are <strong>in</strong>consistent and biased [Wooldridge (2003)]. In addition, some unobserved characteristicssuch as product attributes, managerial skills, or strategic management are potentially permanent or highlyserially correlated. These characteristics can <strong>in</strong>duce persistence <strong>in</strong> the decision to export or not to export byfirm, and then may lead us to overestimate the parameter of the lagged dependent variable <strong>in</strong> the model. Todeal with unobserved firm heterogeneity, researchers usually use techniques <strong>in</strong> panel analysis such as randomorfixed-effects. In random-effects models, the core assumption that the firm’s unobserved characteristicsmust be uncorrelated with other explanatory variables is likely to be violated <strong>in</strong> models of export decision. Inexport decision models like ours, unobserved characteristics such as those listed above apt to be correlatedwith other <strong>in</strong>dependent variables such as productivity, size, or factor <strong>in</strong>tensity <strong>in</strong> the model. On the other hand,most fixed-effects models produce biased and <strong>in</strong>consistent parameter estimates [Bernard and Jensen (2004)].These issues require more econometric techniques that are not always possible, especially <strong>in</strong> logit or probitmodels with lagged dependent variables.The above-mentioned issues are those specifically related to unobserved firm heterogeneity. Thereare also problems specifically associated with the <strong>in</strong>clusion of lagged dependent variables <strong>in</strong> the right handside of estimation equations. In econometric theories, a lagged dependent variable is used as an explanatory10
variable when there is the phenomenon of “state dependence”. This dependence may be either a true or aspurious one. The true state dependence means that the lagged choice enters the model <strong>in</strong> a structural way asan explanatory variable. The sunk cost variable <strong>in</strong> export decision models is an example. The spurious statedependence implies the presence of serial correlation <strong>in</strong> unobserved transitory errors that underlie thethreshold-cross<strong>in</strong>g econometric <strong>in</strong>dividual specification of a model [Heckman (1981b)]. The case ofconsiderable attention of spurious state dependence is the presence of unobserved time-<strong>in</strong>variant <strong>in</strong>dividualspecific heterogeneity [Honore and Kyriazidou (2000)], such as the presence of unobserved firm effects <strong>in</strong> ourmodels. This may cause a problem that we have discussed before, that is, if the persistence <strong>in</strong> the error term isunmodeled, this persistence would be picked up by the lagged variable, and the upward bias <strong>in</strong> the estimatedparameter of the lagged variable can be expected. In export decision models, this phenomenon implies theoverestimation of the importance of sunk entry costs. There are also two other important problems related tolagged dependent variables. The first one is endogeneity. Because the dependent variable is a function of theerror term, the lagged dependent variable is also a function of the error term. The l<strong>in</strong>k may be <strong>from</strong> theexistence of unobserved time-<strong>in</strong>variant firm effects ( εi) or <strong>from</strong> the transitory component ( ηit) that iscorrelated across time [ cov( η , ) ≠ 0 ]. Therefore, the normal OLS estimators are biased and <strong>in</strong>consistent.itη it−sFixed-effects models with first-differences can solve some, but not all. The consistency of fixed-effectsestimators depends on the number of periods be<strong>in</strong>g lagged, need<strong>in</strong>g longer panel. However, the bias on thecoefficients other than that of the lagged dependent variable may be small for fixed-effects estimators[Helmers and Trofimenko (2007)]. Generalized methods of moments (GMM) with suitable <strong>in</strong>strumentalvariables (IV) <strong>in</strong> first-differences usually a choice to solve this problem. However, the validity of thisapproach depends crucially on the assumption that the lagged differences of the endogenous explanatoryvariable are uncorrelated to the residuals, necessitat<strong>in</strong>g the test of this assumption. The second one ismulticoll<strong>in</strong>earity: lagged dependent variables may be correlated to other explanatory variables, such as to thevariable of productivity via possible learn<strong>in</strong>g-by-export<strong>in</strong>g effects. However, this issue is not so serious,because it just <strong>in</strong>duces larger variances of estimates but not biasness or <strong>in</strong>consistency [Helmers andTrofimenko (2007)].To treat unobserved firm heterogeneity <strong>in</strong> fixed-effects model properly with the presence of laggeddependent variables, l<strong>in</strong>ear probability framework is usually preferred, compromis<strong>in</strong>g the drawbacks <strong>in</strong>herent<strong>in</strong> this type of models (fitted probability out of [0,1], or constant partial effect). Bernard and Jensen (2004) usethis framework, argu<strong>in</strong>g that it allows them to model the unobserved firm effects as fixed. To f<strong>in</strong>d the upperbound of sunk cost parameter estimates, they ignore the firm effects and estimate <strong>in</strong> <strong>level</strong>s, accept<strong>in</strong>g theusual heterogeneity bias caused <strong>from</strong> omitt<strong>in</strong>g time-<strong>in</strong>variant variables. They also estimate the specificationwith fixed effects <strong>in</strong> which the error term is decomposed <strong>in</strong>to two components as described above to f<strong>in</strong>d thelower bound, accept<strong>in</strong>g some <strong>level</strong> of <strong>in</strong>consistency. To avoid <strong>in</strong>consistency <strong>in</strong> this fixed-effects estimation, aspecification <strong>in</strong> first differences with Arellano-Bond (1991) GMM estimator us<strong>in</strong>g lagged <strong>level</strong>s of theright-hand-side variables as <strong>in</strong>struments is also employed. The problem usually observed <strong>in</strong> thefirst-differences specification is that effects of firm characteristics are found <strong>in</strong>significant because they areprimarily <strong>level</strong> effects and <strong>in</strong>dist<strong>in</strong>guishable <strong>from</strong> firm fixed effects. Those who do not accept drawbacks ofl<strong>in</strong>ear probability framework prefer logit or probit. Logit can be used well with fixed effects, but not with11
lagged dependent variables. Probit with fixed effects is difficult to compute and may render estimatedcoefficients and statistics <strong>in</strong>consistent, especially <strong>in</strong> the case when large panel is not available. Probit withrandom effects fits better to specification with lagged dependent variables, if the problems caused by theassumption of uncorrelated relation between error term and <strong>in</strong>dependent variables are acceptable [Helmersand Trofimenko (2007)]. Roberts and Tybout (1997) use Heckman’s (1981a) dynamic random-effects probitestimator with b<strong>in</strong>ary-choice model. Although this approach has a drawback due to the assumption usuallyseen <strong>in</strong> random effects models, it is plausible <strong>in</strong> models of short panel with lagged dependent variables andthe proper treatment of dynamic decision process with <strong>in</strong>itial conditions controlled. In many other papers, <strong>in</strong>order to avoid the treatment of lagged dependent variables, researchers try to alleviate sunk cost variable outof their model, by simply ignor<strong>in</strong>g it or us<strong>in</strong>g no-status-switcher subsample. Arnold and Huss<strong>in</strong>ger (2004) usea probit model <strong>in</strong> a subsample of firms with persistent export behavior, argu<strong>in</strong>g that it helps exclude thelagged dependent variable <strong>from</strong> the set of explanatory variables, enable them to abstract <strong>from</strong> the effect ofentry costs to check for the robustness of the effects of the rema<strong>in</strong><strong>in</strong>g explanatory variables.Concern<strong>in</strong>g the potential simultaneity problems caused by the existence of two-way relationshipbetween export<strong>in</strong>g behaviors and characteristics of firms, econometric theories suggest the use ofsimultaneous equation models. However, the difficulty <strong>in</strong> fac<strong>in</strong>g with the identification condition h<strong>in</strong>ders theuse of this approach. Actually, it is not easy to f<strong>in</strong>d sufficient <strong>in</strong>strumental variables to estimate thesimultaneous equation system <strong>in</strong> a firm-<strong>level</strong> data. One approach frequently used by almost all the research <strong>in</strong>this literature is to lag all firm characteristics by one period. This elim<strong>in</strong>ates the possible effect of exportstatus to firm characteristics, help<strong>in</strong>g to analyze the other direction of effects, i.e., the determ<strong>in</strong>ants ofexport<strong>in</strong>g behavior.Tak<strong>in</strong>g the above-mentioned discussion, our purpose and data characteristics <strong>in</strong>to consideration, wechoose estimation specifications as follows. In order to illustrate differences between exporters andnon-exporters, we derive exporter premium across a range of characteristics: revenue, productivity, size, <strong>in</strong>put<strong>in</strong>tensity, labor skill and age. First, we do that by runn<strong>in</strong>g simple regression of each of these characteristics onexport status of firms to f<strong>in</strong>d and test simple exporter premium at the mean <strong>in</strong> the pooled data set as follows:ln Z + u*it = α 1Yitit(12)*where i <strong>in</strong>dexes firms and t <strong>in</strong>dexes time; Z it is value <strong>level</strong> of the characteristic <strong>in</strong> consideration; Yitisthe export status; α1is the parameter; anduitis the error term. After do<strong>in</strong>g that, we condition this premiumon other characteristics that may affect the characteristic <strong>in</strong> consideration and may bias the result derived bythe simple regression. Specifically, we will estimate the follow<strong>in</strong>g multivariate regression <strong>in</strong> the pooled dataset:ln Z β Z + β T + β D + v(13)*it =1Yit+ β2it3 4 itwhereZitis the vector of firm characteristics, <strong>in</strong>clud<strong>in</strong>g productivity, size, <strong>in</strong>put <strong>in</strong>tensity, labor skill and age;T is the vector of time dummies; D is the vector of <strong>in</strong>dustry and location dummies; β1; β2;β3and β412
are vectors of parameters; andvitis the error term. The exporter premium is def<strong>in</strong>ed as[( Z* exporter* non−exporter* non−exporterit− Zit) / Zit]*100 . After all the parameters are estimated, the simple exporterpremium is calculated as ( α 1 −1) *1e 100 and conditional exporter premium as ( eβ −1) * 100 . These valueswill be reported with the standard errors and t-values of the two parameters α 1and β1to describe thedifference between exporters and non-exporters.Next, the significance of determ<strong>in</strong>ants of the decision to export or not to export will be tested withthe closer look on the role of past export status, represent<strong>in</strong>g the sunk entry costs. The equation for estimationisYit= λ Y 1 it-1+ λ2Zit− 1+ λ3T+ λ4D+ εi+ ηit(14)where λ1,λ2,λ3and λ4are vectors of parameters; ε ithe time-<strong>in</strong>variant firm-specific unobservablecharacteristics and η itidiosyncratic error. This equation <strong>in</strong>cludes one-year lagged export status. Allobservable firm-specific time-variant characteristics are also lagged one year period to control for anypossible reverse causation. We prefer to use dynamic probit model with random effects <strong>in</strong> this paper. Onereason for this choice is that the data used <strong>in</strong> this analysis is a quite short panel, render<strong>in</strong>g the ease <strong>in</strong>employ<strong>in</strong>g models with both lags and fixed effects. As we have mentioned, fixed effects models producedbiased and <strong>in</strong>consistent parameter estimates. One way to avoid these problems is to fit <strong>in</strong> first-differencesspecifications with suitable estimators such as that of Arellano-Bond’ (1991). However, first-differencesspecification with lagged explanatory variables makes the sample size shr<strong>in</strong>k considerably, render<strong>in</strong>g thedynamics of the model. Furthermore, fixed effects models with lagged dependent variableusually makefirm-specific observable effects less important because these effects are possibly <strong>in</strong>dist<strong>in</strong>guishable <strong>from</strong> fixedeffects. The dynamic random effects model will not only allow us to deal with unobserved firm-specificeffects but also help model the dynamics properly with the control of <strong>in</strong>itial condition. We test equation (14)<strong>in</strong> three specifications. First, we fit the follow<strong>in</strong>g short version of equation (14):Yit= λ Y 1 it-1+ λ2Zit− 1+ λ3T+ λ4D+ uit(15)by us<strong>in</strong>g probit model <strong>in</strong> the pooled data set, ignor<strong>in</strong>g any unobserved effects, i.e. assume thatuit= ε + ηiitis normally distributed and uncorrelated to other explanatory variables. As stated before, this estimation ismore likely to give biased and <strong>in</strong>consistent estimates. However, we can yield the upper bound of the effect ofpast export status via this test. Next, we use the Heckman’s (1981a) random effectsdynamic probitframework that is also used by Roberts and Tybout (1997) to fit equation (14) <strong>in</strong> full. Because this modelcontrols for unobserved effects, dynamic process as well as <strong>in</strong>itial conditions, it is expected to give the bestestimates under the availability and structure of data used <strong>in</strong> this analysis. It is therefore the most preferredmodel <strong>in</strong> this paper. In this regression, for the fitt<strong>in</strong>g to be eligible <strong>in</strong> a dynamic random effects format, the13
composite error u itis assumed to be uncorrelated with explanatory variables other than the laggeddependent variable, the time-<strong>in</strong>variant componentε to be uncorrelated across firms, i.e., cov( ε , ) = 0 ,iiε jthe transitory componentη to be uncorrelated across time [ cov( η , ) = 0 ], and these errors normallyititη it−sdistributed. The variance ofε ( σ ) is used as a s<strong>in</strong>gle parameter to parameterize the distribution of thei2ε ifirm effect. The <strong>in</strong>itial status is also controlled for by us<strong>in</strong>g specific <strong>in</strong>formation available <strong>in</strong> the dynamicprocess. We use the program “redprob” written <strong>in</strong> Stata® by Steward (2006) to run this regression.In the third specification, to avoid the possibility that the lagged dependent variable may excessivelypick up effects of firm characteristics mak<strong>in</strong>g these estimated effects less important, we employ arandom-effects probit model <strong>in</strong> fitt<strong>in</strong>g equation (14) us<strong>in</strong>g the sub-sample of firms that do not switch theirexporter or non-exporter status <strong>from</strong> a period to the next. This will alleviate the presence of lagged dependentvariable <strong>in</strong> the right hand side of equation (14). The equation to be estimated is:Yit= λ2Zit− 1+ λ3T+ λ4D+ εi+ ηit(16)Although this is somewhat arbitrary selection of sub-sample, it enables us to abstract <strong>from</strong> the effect of sunkcost to check for the robustness of the effects of the rema<strong>in</strong><strong>in</strong>g explanatory variables <strong>in</strong> the model.IV.2 Variable constructionThe dependent variable <strong>in</strong> this analysis is export status. Export status of a firm is the firm’s observedprobability of export<strong>in</strong>g. A firm is def<strong>in</strong>ed as an exporter at a given period of time if its direct exports accountfor at least 10 per cent of its sales <strong>in</strong> this period. The threshold value of 10 per cent is used <strong>in</strong> many otherpapers <strong>in</strong> the literature, even by the World Bank itself, to classify exporters and non-exporters. This def<strong>in</strong>itionis adequate for identify<strong>in</strong>g the firms as exporters that have a m<strong>in</strong>imum <strong>in</strong>terest <strong>in</strong> serv<strong>in</strong>g foreign markets,abstract<strong>in</strong>g <strong>from</strong> m<strong>in</strong>imal trade relationships due to sample shipments or border proximity. Because the<strong>in</strong>formation of direct exports is not available for the year 2002 (the first year of the panel), we assign exportstatus of firms <strong>in</strong> 2002 by us<strong>in</strong>g <strong>in</strong>formation of the year that firm started to export. Those firms hav<strong>in</strong>g startedexport<strong>in</strong>g by the year 2002 is reported as exporters <strong>in</strong> 2002. In any analysis related to this <strong>in</strong>formation, we<strong>in</strong>terpret firms assigned as exporters <strong>in</strong> 2002 as those hav<strong>in</strong>g export<strong>in</strong>g experience by 2002.Accord<strong>in</strong>g to the theoretical background discussed earlier and the characteristics of the data set weuse, we will <strong>in</strong>clude <strong>in</strong> the right hand side of estimation equations firm-specific and exogenous characteristicsthat affect the profitability of firms, besides the lagged dependent variable. Variables of firm characteristicsare productivity, size, <strong>in</strong>put <strong>in</strong>tensity, age, labor skill and ownership. All the values of firm-specifictime-variant variables will be calculated as the <strong>level</strong> relative to <strong>in</strong>dustry mean to alleviate any <strong>in</strong>dustrialheterogeneity. Other <strong>in</strong>dustry-specific effects will be captured via <strong>in</strong>dustry dummies. Effects of time-specificfactors such as macroeconomic conditions that affect all the firms, will be estimated by us<strong>in</strong>g time dummies.Region dummies are also <strong>in</strong>cluded to capture region-specific characteristics. We describe each variable asfollows, and summarize them <strong>in</strong> Table 2.As suggested by most of theoretical and empirical studies, productivity is the most important factor14
that determ<strong>in</strong>es export status and performance of firms. More productive firms are more likely to becomeexporters because of the sunk entry costs that pave the way to foreign markets for only firms of higherprofitability. Furthermore, it is common to th<strong>in</strong>k that competition <strong>in</strong> export markets is more <strong>in</strong>tense than that<strong>in</strong> the home market, giv<strong>in</strong>g fewer opportunities to export for <strong>in</strong>efficient firms. In this paper, we use total factorproductivity (TFP) as a key <strong>in</strong>dicator to represent productivity <strong>level</strong>s of firms. Besides, labor productivity,def<strong>in</strong>ed as value added per worker, is also used as a measure of productivity, as usually done so by many otherstudies of the same <strong>in</strong>terest. However, we use it with caution when understand<strong>in</strong>g that this measure is notdesirable to present productivity <strong>level</strong>s of firms because it depends on the structure of the <strong>in</strong>put factors. In adevelop<strong>in</strong>g economy like <strong>Vietnam</strong>’s, process<strong>in</strong>g <strong>in</strong>dustries are the ma<strong>in</strong> source of value added <strong>from</strong> exports.Therefore, labor productivity should be considered as the characteristics of export<strong>in</strong>g <strong>in</strong>dustries rather thanproductivity. TFP is usually preferred <strong>in</strong> most studies <strong>in</strong> the research area of productivity. There are severalapproaches to estimate the production function to measure TFP of firms. It is either parametric estimation ofthe production function (such as the normal OLS); semi-parametric estimation [such as Lev<strong>in</strong>sohn andPetr<strong>in</strong>’s (2003) approach or Olley and Pakes’ (1996) approach]; or non-parametric estimations (<strong>Data</strong>Envelopment Analysis approach). OLS estimation is criticized that it is more likely to give biased estimates.While the TFP to be estimated is unobservable to econometricians, at least a part of this TFP will be observedby the firm. Therefore, this knowledge may <strong>in</strong>fluence the choice of <strong>in</strong>puts of the firm. If it is, we face theproblem of simultaneity. This may cause biased estimates <strong>in</strong> the OLS estimation because the possiblecorrelation between the regressors and the error term, the so-called “transmission bias”. There are sometechniques of estimation that are robust to this bias. Olley and Pakes (1996) propose an estimator that uses<strong>in</strong>vestment as a proxy for productivity. Lev<strong>in</strong>sohn and Petr<strong>in</strong> (2003) suggest a technique <strong>in</strong> which<strong>in</strong>termediate <strong>in</strong>puts are used as proxies for productivity. Olley and Pakes’s (1996) approach is less preferredbecause data on <strong>in</strong>vestment are not so available as that of <strong>in</strong>termediates. Besides, <strong>in</strong>termediate <strong>in</strong>puts areprobably good proxies because they may respond more smoothly to productivity shocks, while <strong>in</strong>vestmentmay not fully respond to such shocks due to the adjustment costs. We use Lev<strong>in</strong>sohn and Petr<strong>in</strong>’s (2003)approach to calculate the TFP. The basic framework and estimated results are reported <strong>in</strong> the appendix to thispaper. In the calculation of TFP and labor productivity, we use value added of firms. Value added of a firm <strong>in</strong>a year is derived by subtract<strong>in</strong>g the sum of total purchases of raw materials and <strong>in</strong>termediate goods andenergy cost <strong>from</strong> its total sales. The values of total sales of firms <strong>in</strong> each <strong>in</strong>dustry have been adjusted to beexpressed <strong>in</strong> real 2002 terms, us<strong>in</strong>g <strong>in</strong>dustry-<strong>level</strong> producer price <strong>in</strong>dices (PPI) obta<strong>in</strong>ed <strong>from</strong> the GeneralStatistics Office of <strong>Vietnam</strong> [GSO (2007)]. Labor productivity is the value added divided by the number oftotal employees. The number of total employees is the sum of total permanent workers and the adjustedtemporary workers. The number of adjusted temporary workers is the total number of paid short-term workersmultiplied by average length of employment for each of these workers and then divided by the average lengthof employment of permanent employees. Due to the unavailability of the <strong>level</strong>s of average length ofemployment of temporary workers <strong>in</strong> the years 2002 and 2003, we use that of 2004 to derive the adjustedtemporary workers for the years 2002 and 2003.<strong>Firm</strong> size is the next characteristic that is used <strong>in</strong> most empirical analysis <strong>in</strong> this literature. It isuniversally regarded to be positively related to export status of firms. <strong>Firm</strong> size is usually proxied by capital,employment or total output scale. Larger firms are believed to be able to ga<strong>in</strong> benefits <strong>from</strong> their size viaeconomies of scale <strong>in</strong> production and larger demand. Besides, sell<strong>in</strong>g products <strong>in</strong> remote markets requires15
more resources that only firms of a certa<strong>in</strong> size can afford. Larger firms also have higher advantage <strong>in</strong>mobiliz<strong>in</strong>g resources and more ability to absorb risks, hence, can adapt more easily to the conditions offoreign markets. In this paper, we use a firm’s capital, def<strong>in</strong>ed as the net-book value of mach<strong>in</strong>ery andequipment, as a proxy for size of the firm. This may present more accurately the size of firms <strong>in</strong> <strong>Vietnam</strong>other than the number of employees or total output because employment or production are not as stable ascapital <strong>level</strong> <strong>in</strong> a develop<strong>in</strong>g country like <strong>Vietnam</strong>. Values of this variable are also expressed <strong>in</strong> real 2002terms, us<strong>in</strong>g the PPI of the <strong>in</strong>dustry of Mach<strong>in</strong>ery and Equipment.The <strong>Vietnam</strong> PICS also surveys on structure of ownership of firms. We def<strong>in</strong>e a firm hav<strong>in</strong>g foreignownership when foreign capital of the firm accounts for at least 10 per cent of its total capital. In the literatureof bus<strong>in</strong>ess management, foreign-owned firms are more likely to be exporters, thanks to their experience andknowledge about foreign markets as well as their relationship with headquarters or branches of the same firmsand with foreign customers. Foreign-owned firms are usually thought of as more powerful than their domesticcounterparts. This <strong>in</strong>creases their likelihood to export. However, the opposite can also be possible when someforeign firms are said host-country-market oriented and FDI is considered as a good measure to penetrate <strong>in</strong>tohost-country markets.The foundation year of firms is also available <strong>in</strong> the survey data, allow<strong>in</strong>g us to calculate age of eachfirm. It is usually argued that the older firms are more likely to export, because the longer a firm has been <strong>in</strong>bus<strong>in</strong>ess, the more likely it is to look for foreign markets to grow further. In addition, firm age is sometimesrelated to firm experience, performance and size. All of these favor their export<strong>in</strong>g activities. However, theopposite has also been suggested. This is expla<strong>in</strong>ed by the argument that young managers now have strongerglobal orientation and capability. These firms are called “born globals”, and start to export after a short timeof start-up [Moen (2002)]. We <strong>in</strong>clude both age and age squared to exam<strong>in</strong>e the effect of firms’ experience,with an aim to test the effect of firms’ experience and its deterioration with time.In this paper, we are also <strong>in</strong>terested <strong>in</strong> relative <strong>in</strong>tensity of factors used by firms. We def<strong>in</strong>e capital<strong>in</strong>tensity as the ratio of net-book value of mach<strong>in</strong>ery and equipment over the total number of employees.<strong>Firm</strong>s <strong>in</strong> developed countries are believed to export capital-<strong>in</strong>tensive products, while their counterparts <strong>in</strong>develop<strong>in</strong>g cou ntries export labor-<strong>in</strong>tensive ones. Labor-<strong>in</strong>tensive firms <strong>in</strong> a develop<strong>in</strong>g country are thought tobe more likely to export.We also consider the effect of workforce quality. In the related literature, this factor is usuallyproxied by either the ratio of skilled workers to total employees or the average wage. The former is preferredto the latter. Although the survey has data on the structure of workforce of each firm, this <strong>in</strong>formation isavailable only for the year 2004. Therefore, <strong>in</strong> order for us to construct the panel, we choose the average wagerate as a proxy for the quality of workforce. The average wage rate is def<strong>in</strong>ed as the total labor paymentsdivided by total employees. The labor payments are also <strong>in</strong> real 2002 terms, adjusted by us<strong>in</strong>g ConsumerPrice Indices (PPI) obta<strong>in</strong>ed <strong>from</strong> World Economic Outlook <strong>Data</strong>base 2007 of IMF.As suggested by the theoretical backgrounds, lagged export status will be used to estimate the roleof sunk costs. Becaus e of the short panel, we can only use lags of one year period. Industry dummies, regiondummies and time dummies will be <strong>in</strong>cluded <strong>in</strong> the right hand side of estimation equations, to proxy for<strong>in</strong>dustrial characteristics, regional characteristics and time-specific macroeconomic conditions that firms arefac<strong>in</strong>g. Although the manufactur<strong>in</strong>g sector <strong>in</strong> <strong>Vietnam</strong> is classified <strong>in</strong>to 17 <strong>in</strong>dustries <strong>in</strong> the <strong>Vietnam</strong> PICS, we16
comb<strong>in</strong>e Rubbe r and Plastic Products Industry and Non-metallic M<strong>in</strong>eral Products Industry <strong>in</strong>to Rubber,Plastic and Non-metallic Products Industry, Basic Metals Industry and Metal Products Industry <strong>in</strong>to Metalsand Metal Prod ucts Industry, Mach<strong>in</strong>ery and Equipment Industry and Electrical Mach<strong>in</strong>ery Industry <strong>in</strong>toMach<strong>in</strong>ery, Equipment and Electrics Industry; and Vehicles and Other Transport Equipment Industry andOthers <strong>in</strong>to Others, mak<strong>in</strong>g a new classification of 13 <strong>in</strong>dustries. Because of the limited sizes of theseTable 2:VariablesVARIABLE DESCRIPTIONDef<strong>in</strong>itionExporter=1 if exporter (directly export<strong>in</strong>g at least 10% of total sales), 0 otherwiseRevenueTotal salesTFPTotal factor productivityLaborTotal number of permanent and adjusted temporary employeesLabor ProductivityValue added/LaborCapitalTotal net-book value of mach<strong>in</strong>ery and equipmentWageTotal labor payment/LaborAgeNumber of years <strong>in</strong> bus<strong>in</strong>ess, (equal 2004-foundation year)Age SquaredAge squaredCapital Intensity Ratio of total net-book value of mach<strong>in</strong>ery and equipment to total employeesForeignForeign-owned firm, with at least 10% of total capital owned by foreignersIndustry 1=1 if Food and Beverage Industry, 0 otherwiseIndustry 2=1 if Textiles Industry, 0 otherwiseIndustry 3=1 if Garments Industry, 0 otherwiseIndustry 4=1 if Leather Products Industry, 0 otherwiseIndustry 5 =1 if Wood and Wood Products Industry, 0 otherwiseInd ustry 6 =1 if Paper Industry, 0 otherwiseIndustry 7=1 if Chemical & Chemical Products Industry, 0 otherwiseIndustry 8=1 if Rubber, Plastic & Non-metallic Products Industry, 0 otherwiseIndustry 9=1 if Metals & Metal Products Industry, 0 otherwiseIndustry 10=1 if Mach<strong>in</strong>ery, Equipment and Electrical Products Industry, 0 otherwiseIndustry 11=1 if Electronics Industry, 0 otherwiseIndustry 12=1 if Construction Materials Industry, 0 otherwiseRegion 1=1 if Red River Delta, 0 otherwiseRegion 2=1 if Southern Central Costal, 0 otherwiseRegion 3=1 if South East, 0 otherwiseRegion 4=1 if Mekong River Delta, 0 otherwiseYear 2004=1 if the year 2004, 0 otherwiseNote:Other Industries and Northern Central are taken as reference groups for <strong>in</strong>dustry and regiondummies, respectively. Year 2003 is a reference group for time dummy.<strong>in</strong>dustries, we make the comb<strong>in</strong>ation to satisfy the confidentiality requirement by the data provider (EnterpriseSurveys, The World Bank Group) as well as to make it more efficient <strong>in</strong> estimat<strong>in</strong>g some variables used <strong>in</strong>17
this analysis, especially the estimation of TFP. In sett<strong>in</strong>g the region dummies, we use the classification ofregions used <strong>in</strong> the survey. In this survey, there are five regions <strong>in</strong>to which firms are classified: Red RiverDelta, Southern Central Costal, South East, Mekong River Delta and Northern Central. All these dummies arealso summarized <strong>in</strong> Table 2.V. RESULTS AND DISCUSSIONTable 3 describes differences between exporters and non-exporters <strong>in</strong> a range of characteristics. The firstcolumn lists the characteristics <strong>in</strong> which the differences are exam<strong>in</strong>ed. The second and fourth columns reportthe simple exporter premium and the conditional exporter premium, respectively. The simple exporterpremium is the percentage difference between exporters and non-exporters <strong>in</strong> the mean <strong>level</strong> of thecharacteristic <strong>in</strong> consideration, without controll<strong>in</strong>g for differences <strong>in</strong> other characteristics, <strong>in</strong>dustry or locationof firms. The conditional exporter premium is also the difference <strong>in</strong> the mean <strong>level</strong> but is calculated with othercharacteristics, location and <strong>in</strong>dustry type of firms be<strong>in</strong>g controlled for. The third and fifth columns list thecorrespond<strong>in</strong>g standard errors and t-statistics of these differences. At the unconditional mean, revenue andemployment <strong>level</strong>s <strong>in</strong> export<strong>in</strong>g firms are about 300 per cent greater than those <strong>in</strong> non-exporters. Exporters’capital scale is also larger, around 230 per cent. The positive premium of exporters <strong>in</strong> the conditional mean<strong>level</strong>s of these characteristics rema<strong>in</strong> the same, although the magnitudes are smaller. All these differences arestatistically significant at 1 percent <strong>level</strong>, imply<strong>in</strong>g that exporters are significantly larger than non-exporters.Exporters also have high premium <strong>in</strong> total factor productivity over non-exporters, about 28.7 and 16.4 percent for the simple and the conditional, respectively. However, the table shows that exporters have lowervalue added per worker. This difference <strong>in</strong> labor productivity is not large, and even statistically <strong>in</strong>significantfor the <strong>level</strong> <strong>in</strong> simple mean. Exporters appear to use labor-<strong>in</strong>tensive technology. The ratio of capital perworker of exporters is 20 and 45 per cent lower than that of non-exporters when compar<strong>in</strong>g <strong>in</strong> the simple andconditional means, respectively. Exporters appear to pay higher wage. However, this difference is notstatistically significant <strong>in</strong> both premium criteria. Related to years of experience <strong>in</strong> bus<strong>in</strong>ess, exporters areolder than non-exp orters. In summary, the data of the <strong>Vietnam</strong> PICS <strong>in</strong> 2005 hi nt that exporters <strong>in</strong>manufactur<strong>in</strong>g sector of <strong>Vietnam</strong> are “superior” to non-exporters <strong>in</strong> terms of size (employment, capital andrevenue), age and TFP. Besides, exporters appear to be <strong>in</strong>volved <strong>in</strong> more labor-<strong>in</strong>tensive production withlower value added per worker than their counterparts who solely serve the domestic market. There is nostatistically significant eviden ce for the difference <strong>in</strong> skills of workers employed by exporters andnon-exporters when skill is proxied by average wa ges.As argued <strong>in</strong> the previous sections, this superi ority of exporters, especially <strong>in</strong> TFP, at a givenmoment <strong>in</strong> time may be attributed to the self-sele ction <strong>in</strong>to markets of superior firms or to the positive effectof learn<strong>in</strong>g-by-export<strong>in</strong>g process. By exam<strong>in</strong><strong>in</strong>g the results of the estim ation of equation (14) which we report<strong>in</strong> Ta ble 4, we will be able to elaborate the determ <strong>in</strong>ants of the former when the latter is controlled for. In sixcolumns that go after the column of variables, we report estimated coefficients that represent the marg<strong>in</strong>aleffects of each explanatory variable on the value of the l<strong>in</strong>k function <strong>in</strong> probit models, i.e., on the value of the<strong>in</strong>verse of the standard normal cumulative distribution function (usually termed as the Z score) of theprobability to be an exporter. As it is well-known <strong>in</strong> probit models, it is complicated to <strong>in</strong>terpret the marg<strong>in</strong>aleffect directly on the probability of becom<strong>in</strong>g an exporter. Besides, it is not much important to report thiseffect when we use the data of a sample, not the whole population, of the firms. Therefore, we choose to focus18
on the analysis of the direction of this effect, <strong>in</strong> other words, the sign of parameter estimates. This sign is alsothat of the marg<strong>in</strong>al effects on the Z score that we report <strong>in</strong> Table 4.Table 3:DIFFERENCES BETWEEN EXPORTERS AND NON-EXPORTERSSimpleConditionalStandard errorsVariables ExporterExporterStandard errorsPremium (%)Premium (%)Revenue 285.38 0.0669 *** 51.55 0.0384 ***TFP 28.66 0.0613 *** 16.39 0.0408 ***Labor Productivity -1.91 0.0418 -11.52 0.036 ***Employment 313.80 0.0496 *** 158.56 0.0521 ***Average Wage 3.29 0.0281 4.50 0.0283Capital 227.52 0.0736 *** 150.58 0.0726 ***Capital Intensity -20.05 0.0556 *** -44.68 0.0405 ***Age 33.17 0.0466 *** 14.57 0.0527 **Note:*** , ** , and * <strong>in</strong>dicate significance at 1%, 5%, and 10% <strong>level</strong>s, respectively.The first three columns of Table 4 list the estimated parameters <strong>in</strong> estimations that <strong>in</strong>clude thenatural logarithm of TFP <strong>in</strong> the vector of explanatory variables, and the last three present the results ofregressions that use the natural logarithm of labor productivity <strong>in</strong> the place of the logarithm of TFP. Themodels (1) and (4) are probit <strong>in</strong> pooled data; (2) and (5) the Heckman’s random-effects dynamic probit; and(3) and (6) the random-effects probit <strong>in</strong> the sample of non-status-switchers. We do not list the parameterestimates of <strong>in</strong>dustry and region dummies <strong>in</strong> Table 4 and refer readers to the full results <strong>in</strong> Table A.2 <strong>in</strong> theAppendix.We are now first to <strong>in</strong>terpret the estimation results described <strong>in</strong> Table 4, and then to raise somecomments on important po<strong>in</strong>ts of these results. It shows <strong>in</strong> Table 4 that the most important determ<strong>in</strong>ant is theexport<strong>in</strong>g experience. Export<strong>in</strong>g last year is a good predictor of export<strong>in</strong>g this year. Be<strong>in</strong>g an exporter <strong>in</strong> theprevious period raises the Z score by more than 320 per cent <strong>in</strong> the poole d probit specifications. As expla<strong>in</strong>ed<strong>in</strong> the empirical background, this <strong>level</strong> is the upper bound of the parameter estimate due to the upward bias ofthe estimations us<strong>in</strong>g pooled data without co ntroll<strong>in</strong>g for unobserved firm effects. Howev er, the positiverelation is still seen <strong>in</strong> our preferred estimation <strong>in</strong> Heckman’s random-effects dynamic probit specifications.The marg<strong>in</strong>al effect on the Z score rema<strong>in</strong>s high at about 200 per cent, two thirds of the upper bound. Thisimportant effect of past behavior <strong>in</strong> export<strong>in</strong>g is usuall y <strong>in</strong>terpreted as the evide nce of sunk en try costs, ash<strong>in</strong>ted <strong>in</strong> the theoretical background.However, there is no statistically significant evidence that firms <strong>in</strong> <strong>Vietnam</strong> with higher TFP <strong>level</strong>self-select <strong>in</strong>to serv<strong>in</strong>g foreign mar kets. In the regression us<strong>in</strong>g the p ooled data se t, the effect o f the logarithmof TFP last year on the Z score th is year is negative at the significance <strong>level</strong> of 10 per cent. Th is implies thereis a negative relationship between TFP <strong>level</strong> <strong>in</strong> the previous year and the likelihood to be an exporter this year.This effect becomes statistically <strong>in</strong>significant, tho ugh still negative, <strong>in</strong> the dynamic random-effectsspecification whose results are rep orted <strong>in</strong> column (2). When we exclude the laggeddependent variable <strong>from</strong>19
the set of <strong>in</strong>dependent variables and run the estimation of equation (16) <strong>in</strong> random-effects probit specificationfor only those firms with persistent export status, we also have no evidence at standard significance <strong>level</strong>s toreject the null hypothesis that there is no effec t of TFP on the probability to exp ort of firms. TF P seems to bean <strong>in</strong>significant factor <strong>in</strong> the self-selection <strong>in</strong>to foreign markets of firms <strong>in</strong> this sample.Table 4: PROBABILITY MODEL OF EXPORTING(Dependen t variable: Exporter t )Independen t Variables (1) (2) (3) (4) (5) (6)Exporter t-13.2613 1.9915 3.2339 1.8659(0. 1377) *** (0. 2362) *** (0. 1348) *** (0. 2491) ***n(TFP a t-1)L -0.1313 -0.1189 0.1071(0.0678) (0. 1189) (0. 1226)Ln(Labor Productivity a t-1)-0.1801(0.0748) -0.6498(0.1660) -0.1800( 0.1317)Ln(Capital a t-1) 0.1235 0.3810 0.7995 0.1401 0.7936 0.8485(0.0417) *** (0.0855) *** (0.0863) *** (0.0413) *** (0.1663) *** (0.0862) ***Age a t-10.0840 -0.0624 0.4016 0.0657 0.3684 0.4294(0.0957) (0.1661) (0.1973) ** (0.0954) (0.1983) * (0.1972) **Age Squared t-1 -0.0629 -0.0128 -0.1963 -0.0577 -0.2265 -0.2095(0.0427) (0.0781) (0.1016) * (0.0427) (0.0981) ** (0.1025) **Capital Intensity a t-1 -0.1171(0.0514) ** -0.3083(0.0956) *** -0.7567(0.1171) *** -0.0929(0.0413) ** -0.3569(0.0807) *** -0.7565(0.1173) ***Wage a t-1 0.0459 0.1177 0.1433 0.0658 0.3158 0.2046(0.0593) (0.1017) (0.0868) * (0.0658) (0.1255) ** (0.0985) **Foreign 0.2375 1.7035 2.3851 0.2785 2.3878 2.6000(0.2174) (0.4338) *** (0.4264) *** (0.2148) (0.5614) *** (0.4196) ***Industry dummies <strong>in</strong>cluded <strong>in</strong>cluded <strong>in</strong>cluded <strong>in</strong>cluded <strong>in</strong>cluded <strong>in</strong>cludedRegion dummiesYear 2004<strong>in</strong>cluded0.4516<strong>in</strong>cluded0.4966<strong>in</strong>cluded-0.1624<strong>in</strong>cluded0.4619<strong>in</strong>cluded0.5692<strong>in</strong>cluded-0.1555(0.1265) *** (0.1731) *** (0.1440) (0.1258) *** (0.1851) *** (0.1431)Constants -1.9556 -2.0403 -0.6115 -2.0015 -2.5153 -0.8243(0.2980) *** (0.4560) *** (0.5163) (0.2969) *** (0.5710) *** (0.5249)Observations1601 3051 1526 1635 3051 1558Log likelihood -261.93 -551.69 -484.48 -267.33 -567.84 -491.70Chi2 1536.15 271.16 253.30 1570.81 203.94 261.76Note:*** , ** , and * <strong>in</strong>dicate significance at 1%, 5%, and 10% <strong>level</strong>s, respectively; Standard errors <strong>in</strong>parentheses; (1) and (4): Probit <strong>in</strong> pooled data; (2) and (5): Heckman’s random-effects dynamicprobit; (3) and (6): Random-effects probit <strong>in</strong> the sample of non-status-switchers; Number ofobservations <strong>in</strong> (2) and (5) <strong>in</strong>cludes those with miss<strong>in</strong>g data due to lagg<strong>in</strong>g of dependent variable;Superscript ( a ) <strong>in</strong>dicates a <strong>level</strong> relative to <strong>in</strong>dustry mean.20
Besides TFP, we also use labor productivity as a measure of productivity of firms <strong>in</strong> f<strong>in</strong>d<strong>in</strong>g theeffect of productivity on their export<strong>in</strong>g behavior. In the pooled probit model whose results are reported <strong>in</strong>column (4), labor productivity shows itself as a determ<strong>in</strong>ant with a negative effect on the probability ofexport<strong>in</strong>g with the significance <strong>level</strong> of 5 per cent. The <strong>level</strong> of the marg<strong>in</strong>al effect of this factor is even largerwhen we estimate <strong>in</strong> the Heckman’s dynamic random-effects probit model and the evidence is even strongerwhen it is statistically significant at 1 per cent. The effect derived <strong>in</strong> the estimation for the sub-sample ofno-status-switchers also shows a negative sign. However, it is not statistically significant.<strong>Firm</strong> size and capital <strong>in</strong>tensity are factors that have strong evidence as good predictors for exportstatus of firms. A firm hav<strong>in</strong>g larger capital scale <strong>in</strong> a year is more likely to be an exporter the next year. Thisevidence can be confirmed by the results of all the estimation specifications we run and at 1 per cent ofsignificance <strong>level</strong>. However, the relation between past capital <strong>in</strong>tensity and recent export status is negative.This effect is highly significant. This implies those firms that use labor-<strong>in</strong>tensive technology have higherprobability to export.It is also shown <strong>in</strong> the estimation results, especially those <strong>in</strong> estimations with value added perworker be<strong>in</strong>g used as a measure of productivity, that firm age is a predictor of export probability. The signs ofcoefficients of age and age squared <strong>in</strong> column (5) are positive and negative, respectively. This fact impliesthat firms with more years of experience <strong>in</strong> bus<strong>in</strong>ess are more likely to serve foreign markets via export<strong>in</strong>g,and the marg<strong>in</strong>al value of this experience deteriorates over time. This is also supported by the results <strong>in</strong>column (6). However, when TFP is <strong>in</strong>cluded <strong>in</strong> the set of <strong>in</strong>dependent variables <strong>in</strong> the place of laborproductivity, this evidence can be seen only <strong>in</strong> the estimation <strong>in</strong> the sub-sample of no-status-switchers.We also have evidence to argue that firms with more skilled labors are more likely to export. Theeffect of average wage, which we use to proxy for labor skill, is positive <strong>in</strong> all estimation specifications, andstatistically significant at standard <strong>level</strong>s <strong>in</strong> our preferred specification that <strong>in</strong>cludes labor productivityvariable, as well as <strong>in</strong> the sub-sample of firms with persistent export status. <strong>Firm</strong>s with foreign capital are alsomore likely to be exporters. This evidence is significant <strong>in</strong> all of our preferred specifications at 1 per cent<strong>level</strong>.The estimation results also give h<strong>in</strong>ts about firms <strong>in</strong> which <strong>in</strong>dustries hav<strong>in</strong>g more chances to export.As compared to firms <strong>in</strong> “other <strong>in</strong>dustries” which we take as reference <strong>in</strong>dustry, firms <strong>in</strong> Garments, Leather,Textiles,Food and Beverage, and Wood and Wood Products <strong>in</strong>dustries have higher probability of export<strong>in</strong>g.The coefficients of these <strong>in</strong>dustry dummies are positive and statistically significant at standard significance<strong>level</strong>s. There are also significant evidence about the difference <strong>in</strong> export<strong>in</strong>g probability of firms <strong>in</strong> Paper andPaper Products, Chemical and Chemical Products, and Metals and Metal Products <strong>in</strong>dustries as compared tothat of the reference <strong>in</strong>dustry. The coefficients of dummy variables of these <strong>in</strong>dustries are negative. Other<strong>in</strong>dustries show no statistically significant difference. Regard<strong>in</strong>g to regional difference, we have nostatistically significant evidence. Besides, when we deal with time dummies, we see that there are morechances for firms to export <strong>in</strong> the year 2004, with the significance <strong>level</strong> of 1 per cent for the coefficient of thedummy for the year 2004 when the year 2003 be<strong>in</strong>g taken as reference year. Effects of <strong>in</strong>teraction variablesare also estimated to elaborate further effect details. However, there are no substantial changes <strong>in</strong> the results.Therefore, we choose not to report them.We now turn to the discussion of these f<strong>in</strong>d<strong>in</strong>gs. About the important role of lagged export status <strong>in</strong>21
predict<strong>in</strong>g the probability of export<strong>in</strong>g of firms, we f<strong>in</strong>d this fact is <strong>in</strong> l<strong>in</strong>e with f<strong>in</strong>d<strong>in</strong>gs <strong>in</strong> almost all othercountries be<strong>in</strong>g tested. This effect is significant not only <strong>in</strong> the simple probit specification <strong>in</strong> the pooled databut also <strong>in</strong> the dynamic random-effects specification <strong>in</strong> which we control for unobserved firm-specifictime-<strong>in</strong>variant effect <strong>in</strong> the dynamic process. Therefore, the f<strong>in</strong>d<strong>in</strong>g supports the argument that there aresubstantial sunk costs <strong>in</strong>volv<strong>in</strong>g <strong>in</strong> enter<strong>in</strong>g export markets that firms <strong>in</strong> <strong>Vietnam</strong> are <strong>in</strong>curr<strong>in</strong>g. This is whatmost people expect to have <strong>in</strong> the case of <strong>Vietnam</strong>. <strong>Firm</strong>s <strong>in</strong> the country are just offspr<strong>in</strong>gs <strong>in</strong> the worldmarkets, produce just those traditional products that face fierce competition, and face many obstacles not onlyoutside but also <strong>in</strong>side the country <strong>in</strong> their effort to reach foreign markets. Except those firms that have someluck when foreign customers pay the cost to f<strong>in</strong>d their doors, other firms face high entry cost. This also leadsto the phenomenon of high persistence <strong>in</strong> export status, especially <strong>in</strong> those firms with dynamic management.Besides the positive effect of lagged export status, we also f<strong>in</strong>d the same effect direction of firm sizeand age. The existence of substantial entry costs is one possible reason. Because of these substantial entrycosts <strong>in</strong> <strong>Vietnam</strong>, those firms that have more resources and experience are more able to overcome thesehurdles and therefore more likely to become exporters or rema<strong>in</strong> as exporters. In addition, <strong>in</strong> an emerg<strong>in</strong>gcountry like <strong>Vietnam</strong>, a firm with relatively larger size and more experienced will have advantage becausetheir status assures foreign partners a reliable and feasible trad<strong>in</strong>g partnership. Moreover, most large and agedfirms <strong>in</strong> <strong>Vietnam</strong>’s manufactur<strong>in</strong>g sector are state-owned or used to be so before be<strong>in</strong>g privatized. They haveacquired susta<strong>in</strong>able establishment, significant market power and good export status due to the privileges theyhave had up to now.The <strong>in</strong>terpretation of the estimation results gives another <strong>in</strong>terest<strong>in</strong>g fact about the characteristics ofexport<strong>in</strong>g firms <strong>in</strong> <strong>Vietnam</strong>: <strong>Firm</strong>s that are more likely to be exporters <strong>in</strong> <strong>Vietnam</strong> are produc<strong>in</strong>glabor-<strong>in</strong>tensive products or us<strong>in</strong>g labor-<strong>in</strong>tensive technology. These firms use more skilled labors. However,they have lower value added per worker. This reflects the actual state of the manufactur<strong>in</strong>g sector of thedevelop<strong>in</strong>g economy of <strong>Vietnam</strong>. As we can also see <strong>from</strong> the estimation results, garments, leather products,textiles, foods and beverages, and wood and wood products are those products <strong>in</strong> the manufactur<strong>in</strong>g sectorthat have more chances to be exported. Actually, ma<strong>in</strong> sources of value added <strong>from</strong> abroad <strong>in</strong> these <strong>in</strong>dustriesare <strong>from</strong> sell<strong>in</strong>g their process<strong>in</strong>g services. In other words, they are ma<strong>in</strong>ly export<strong>in</strong>g labor services. These<strong>in</strong>dustries, by nature, are labor- as well as skill-<strong>in</strong>tensive. Cheap labor and labor skills are usually consideredas competitive advantage of <strong>Vietnam</strong> as a whole. High worker skills and low process<strong>in</strong>g service price are alsoused as important tools <strong>in</strong> compet<strong>in</strong>g for foreign contracts. The f<strong>in</strong>d<strong>in</strong>g about the positive effect of foreignownership and export<strong>in</strong>g probability can support this argument. Foreign firms <strong>in</strong>vest <strong>in</strong> <strong>Vietnam</strong> to takeadvantage of cheap labor and skill for their export-oriented production. Of course, f<strong>in</strong>ancial and managerialstrengths, market experience and market l<strong>in</strong>ks can also be possible explanations for higher export<strong>in</strong>gprobability of foreign-owned firms.The <strong>in</strong>significant effect of TFP on export<strong>in</strong>g probability needs more <strong>in</strong>sights. Although it seemscontrary to theoretical background, this f<strong>in</strong>d<strong>in</strong>g is actually not new <strong>in</strong> this literature. As we have stated <strong>in</strong> theIntroduction section, no significant effect of productivity can also be observed <strong>in</strong> the case of Indonesia[Blalock and Gertler (2004)], Korea [Aw et al. (2000)], Italia [Castellani et al. (2002)], Sweden [Hansson andLund<strong>in</strong> (2004)], Turkey [Yasar and Rejesus ( 2005)], the U.K. [Greenaway and Kneller (2004)], Mexico[Clerides et al. (1998)], some develop<strong>in</strong>g countries <strong>in</strong> Africa [Bigsten et al. (2004)] or even <strong>in</strong> the UnitedStates [Bernard and Jensen (2004)]. There are some possible <strong>in</strong>terpretations. It may be that TFP is actually not22
an important factor that guides firms to sell to foreign markets, as compared to other observed and unobservedfactors. For example, it is possible that ow<strong>in</strong>g to forward-look<strong>in</strong>g managerial strategy or other unobservedfirm-specific factors, certa<strong>in</strong> firm-specific observable advantages such as size, age or skilled labor sources, oreven to some positive exogenous shock, some firms can become exporter regardless of their TFPdisadvantage. Furthermore, because of the high persistence <strong>in</strong> export<strong>in</strong>g status, this firm may cont<strong>in</strong>ueexport<strong>in</strong>g. If there are considerable numbers of firms with low TFP that can export <strong>in</strong> that way, our estimate ofproductivity effect is more likely to be <strong>in</strong>significant. If it is the case, the learn<strong>in</strong>g-by-export<strong>in</strong>g may be a gooddeterm<strong>in</strong>ant for the superiority of exporters that we f<strong>in</strong>d at the beg<strong>in</strong>n<strong>in</strong>g of this section. Another possibleexplanation for the f<strong>in</strong>d<strong>in</strong>g of the <strong>in</strong>significance <strong>in</strong> TFP effect is that TFP is actually important but themagnitude of the importance varies across foreign markets or across commodities, even across commoditieswith<strong>in</strong> a narrowly-def<strong>in</strong>ed <strong>in</strong>dustry. Therefore, when we estimate the coefficient for TFP variable withoutcontroll<strong>in</strong>g for the heterogeneity among foreign markets or commodities, the effect of TFP may be rendered<strong>in</strong>significant. Damijan et al. (2004) do exam<strong>in</strong>e this matter. They f<strong>in</strong>d <strong>in</strong> the case of Slovenian firms that whileit is obvious that higher productivity <strong>level</strong> is required to start export<strong>in</strong>g to advanced countries, this is not thecase for firms that start export<strong>in</strong>g to less-developed countries. They also f<strong>in</strong>d that different foreign marketsrequire different entry costs. The heterogeneous entry costs also generate a positive relationship between thenumber of foreign markets served by firms and their productivity <strong>level</strong>s. If this is the case, <strong>in</strong> order for ourmodel to be more relevant <strong>in</strong> f<strong>in</strong>d<strong>in</strong>g the effect of productivity, we need more <strong>in</strong>formation about firms’export<strong>in</strong>g markets and products. However, this <strong>in</strong>formation is not available <strong>in</strong> the data we use, h<strong>in</strong>der<strong>in</strong>g us<strong>from</strong> exam<strong>in</strong><strong>in</strong>g this possibility.VI. CONCLUDING REMARKSThis paper contributes an empirical analysis to the exam<strong>in</strong>ation of the role of sunk cost and heterogeneouscharacteristics of firms <strong>in</strong> the explanation of behavioral difference among firms <strong>in</strong> their export<strong>in</strong>g decisions.Given the panel of firm-<strong>level</strong> data, appropriate microeconometric methods are made possible for use to testfor determ<strong>in</strong>ants of firms’ export behaviors <strong>in</strong> the dynamic format that properly controls for unobserved firmeffects and simultaneity, two important hurdles usually seen <strong>in</strong> the related literature. Therefore, the estimationresults are expected to give more accurate <strong>in</strong>terpretation of the real situation <strong>in</strong> <strong>Vietnam</strong>.Most of the ma<strong>in</strong> f<strong>in</strong>d<strong>in</strong>gs <strong>in</strong> this paper are <strong>in</strong> l<strong>in</strong>e with theoretical prediction or empirical f<strong>in</strong>d<strong>in</strong>gs <strong>in</strong>other countries, such as the superiority of exporters over non-exporters <strong>in</strong> a range of characteristics <strong>in</strong>clud<strong>in</strong>gtotal factor productivity, firm size, firm age, or labor skill; the persistence of export status due to sunk entrycosts; or the important role of firm size, firm age or foreign ownership <strong>in</strong> predict<strong>in</strong>g the probability ofexport<strong>in</strong>g of firms. Besides, the paper also provides proper empirical firm-<strong>level</strong> evidence about exportdecision determ<strong>in</strong>ants that are idiosyncratic to a develop<strong>in</strong>g country under a fast track of reform like <strong>Vietnam</strong>.<strong>Firm</strong>s that use labor-<strong>in</strong>tensive technology, employ more skilled labors, or offer competitive labor service aremore likely to be <strong>in</strong>volved <strong>in</strong> serv<strong>in</strong>g foreign markets; and such labor-<strong>in</strong>tensive and skill-<strong>in</strong>tensive <strong>in</strong>dustriesas garments, textiles, leather products, wood and wood products, and foods and beverages seem possesscomparative advantage <strong>in</strong> the world market. The <strong>in</strong>significant effect of total factor productivity may alsoreflect the real situation of <strong>Vietnam</strong> as a country <strong>in</strong> reform with unstable and diversified structure of exportmarkets and commodities. Besides, higher probability of export<strong>in</strong>g for firms <strong>in</strong> the year 2004 as compared tothat <strong>in</strong> 2003 can also be <strong>in</strong>terpreted as a general improvement <strong>in</strong> the country’s economy <strong>in</strong> its process of23
<strong>in</strong>tegration <strong>in</strong>to the world trad<strong>in</strong>g system, at least between the two years.Besides the contribution to the literature <strong>in</strong> exam<strong>in</strong><strong>in</strong>g the relationship between firm heterogeneityand export decision, some implications for trade policy makers can be expected <strong>from</strong> the analysis of this paper.It is obvious <strong>from</strong> f<strong>in</strong>d<strong>in</strong>gs <strong>in</strong> this paper that entry costs are a huge barrier for firms <strong>in</strong> go<strong>in</strong>g abroad. Help<strong>in</strong>gfirms <strong>in</strong> gett<strong>in</strong>g over this barrier will not only create room for more firms to export but also pave a easy wayfor the entry-exit process, that <strong>in</strong> turn boosts the process of resource reallocation accord<strong>in</strong>g to the country’sadvantage, not to mention the reallocation of resource towards more successful firms. Together with theevidence about the reserve effect of export<strong>in</strong>g on firm characteristics or the determ<strong>in</strong>ants of export <strong>in</strong>tensity,the f<strong>in</strong>d<strong>in</strong> gs <strong>in</strong> this paper can give proper suggestions on which firms should be supported <strong>in</strong> export<strong>in</strong>g for thepurpose of economic growth, on the measures used <strong>in</strong> <strong>in</strong>terven<strong>in</strong>g the labor market or on trade-related<strong>in</strong>dustrialization policies.This paper deals only with the determ<strong>in</strong>ants of the decision to export or not to export of firms.However, we all know that export<strong>in</strong>g behavior is not only to decide whether to export or not. It also <strong>in</strong>volvesthe decision on which lev el of export <strong>in</strong>volvement (i.e., the decision on the export share <strong>in</strong> total sales), or onwhich produc ts to produce for exports and which markets to export to. Besides, the f<strong>in</strong>d<strong>in</strong>gs of this paper alsogive a h<strong>in</strong>t on the existence of the learn<strong>in</strong>g-by-export<strong>in</strong>g effect <strong>in</strong> the case of <strong>Vietnam</strong>. All of these ideas arepossible for further exam<strong>in</strong>ation <strong>in</strong> future studies.24
APPENDIX(1) Estimation of total factor productivity.The basic framework of the approach is as follows. The production function to be estimated is assumed tohave the form of Cobb- Douglas type, with labor and capital as <strong>in</strong>put factors and value-added as output. Theestimation will be run across <strong>in</strong>dustries. The estimation equation of firm i at time t (<strong>in</strong> logarithmic form)isvt= β + β l + β k + ε(A.1)ol tkttwherevt, ltand k tare log of value-added, labor (the freely variable <strong>in</strong>put) and capital (state variable<strong>in</strong>put) at time t , respectively, andεtis the error term whose explanation will come soon later. We drop thesubscript i for ease of expression. To produce, the firm uses also <strong>in</strong>termediate <strong>in</strong>put, which is subtracted outof the total production to calculate the value-added. The predicted productivity is the exponent of the sum ofconstant coefficient and the error term. Stat<strong>in</strong>g differently, it is calculated as:TFPˆt= exp( v − ˆ β l − ˆ β k ) . (A.2)tl tktThe key po<strong>in</strong>t that is different <strong>from</strong> OLS estimation is that the error term has two components,ωtand ηt, where ωtis the transmitted productivity component that may be correlated with <strong>in</strong>put choices andηtthe <strong>in</strong>dependently and identically distributed (iid) one that is uncorrelated with the choice of <strong>in</strong>puts.is not observable to econometricians, which leads to the problem of simultaneity stated <strong>in</strong> the ma<strong>in</strong> text.Those estimators that ignore this problem (like OLS) will have <strong>in</strong>consistent results.ωtIn the framework of Lev<strong>in</strong>sohn and Petr<strong>in</strong> (2003), the demand for <strong>in</strong>termediate <strong>in</strong>putm tis assumedto depend on the firm’s state variablektandωt:mt= m k , ω )(A.3)t(t tWith the assumption that this demand function is monotonically <strong>in</strong>creas<strong>in</strong>g <strong>in</strong>ωt, we have ωtas a functionofktandmt:Now, the estimation equation can be rewritten asω = ω k , m )(A.4)tt(t tvt= β l + φ ( k , m ) + η(A.5)l ttttt25
whereφ = +(A.6)t( kt, mt) β0 + βkk tωt( kt, mt)This new form of estimation equation will be estimated <strong>in</strong> two stages, as proposed by Lev<strong>in</strong>sohn and Petr<strong>in</strong>(2003) and Petr<strong>in</strong> et al. (2004). The coefficient βlwill be consistently estimated <strong>in</strong> the first stage us<strong>in</strong>g theOLS method after substitut<strong>in</strong>g a third-order polynomial approximatio n <strong>in</strong> k tand ω t<strong>in</strong> place ofφt( kt, mt) . The second stage identifies the coefficient β k, after mak<strong>in</strong>g a consistent non-parametricapproximation to the expectation ofω and us<strong>in</strong>g GM M approach.tWe use the program “levpet” written <strong>in</strong> Stata® by Petr<strong>in</strong> et al. (2004). Value added of a firm used toestimate production of the firm is the total sales subtracted by total purchases of raw materials and<strong>in</strong>termediategoods and energy cost. The values of total sales of firms <strong>in</strong> each <strong>in</strong>dustry have been adjusted tobe expressed <strong>in</strong> real 2002 terms, us<strong>in</strong>g <strong>in</strong>dustry-<strong>level</strong> producer price <strong>in</strong>dices ( PPI) obta<strong>in</strong>ed <strong>from</strong> the websiteof General Statistics Office of <strong>Vietnam</strong> [GSO (2007)]. Total purch ases of raw materials and <strong>in</strong>termediategoods are adjusted to real 2002 term, us<strong>in</strong>g the general PPI of <strong>in</strong>dustrial pr oducts. Energy consumption isadjusted to real 2002 term by the PPI of electricity. We accept this because no <strong>in</strong>form ation about energy priceis available. The freely variable <strong>in</strong>put is labor. The <strong>level</strong> of labor <strong>in</strong>put is the number of total employees. It isthe sum of total permanent workers and the adjusted temporary workers. The number of adjusted temporaryworkers is the total number of paid short-term wor kers multiplied by average length of employment for eachof these workers and then divided by the average length of employment of permanent employees. Due to theunavailability of the <strong>level</strong>s of average length of employment of temporary workers <strong>in</strong> the years 2002 and 2003,we use that of 2004 to derive the adjusted temporary workers for the years 2002 and 2003. The capitalvariable is the net-book value of mach<strong>in</strong>ery and equipment, expressed <strong>in</strong> real 2002 term by us<strong>in</strong>g PPI ofMach<strong>in</strong>ery and Equipment Industry. Proxies for unobservable shocks a re energy expenditure and totalpurchases of raw materials and <strong>in</strong>termediate goods. All the variables <strong>in</strong> this estimation are <strong>in</strong> logarithmicforms. The number of bootstrap replications is 200. Coeffic ients of the production function (i.e. βland βk)are reported <strong>in</strong> Table A.1, together with their p-values. There are no convergence problems <strong>in</strong> estimat<strong>in</strong>gexcept that for Metals and Metal Products Industry and Electronics Industry. We can solve the problem for the<strong>in</strong>dustry of Metals and Metal Products by divid<strong>in</strong>g the <strong>in</strong>dustry <strong>in</strong>to 2 sub-samples: one of firms that haveover 50 adjusted employees and the other not larger than 50 employees, before estimat<strong>in</strong>g. This is reasonabledue to the reason<strong>in</strong>g that firms with size of over 50 workers have very different production functions ascompared to those firms hav<strong>in</strong>g smaller size, especially <strong>in</strong> the metals-related production. We give up theestimation of production function of Electronics Industry, because it is impossible to solve the problem <strong>in</strong>such a small sample (19 firms).After hav<strong>in</strong>g all the coefficients, we calculate TFP <strong>level</strong>s for firms by us<strong>in</strong>g (A.2).26
Table A.1:COEFFICIENTS OF PRODUCTION FUNCTIONIndustries Labor Capital ObservationsFood and Beverage 0.399 0.243 489(0.000) *** (0.072) *Textiles 0.513 0.518 185(0.000) (0.010)**Garments 0.679 0.322 183(0.000) *** (0.014) **Leather 0.396 0.73864( 0.025) ** (0.034) **Wood & Wood Products0.453 0.299 348(0.000) (0.082) *Paper 0.324 0.508164(0.034) ** (0.03Chemical & Chemical Products 0.794 0.536175( 0.000) *** (0.045) **Rubber, Plastic and Non-metallic Products 0.479 0.392 183(0.001) (0.131)Metals and Metal Products (50 employee s or less) 0.482 0.463119(0.008) (0.118)Metals and Metal Products (over 50 employees) 0.564 0.256 176(0.000) (0.098) *Mach<strong>in</strong>ery and Equipment 0.424 0.541 175(0.003) (0.089) *Construction Materials 0.475 0.3248(0.000) (0.006) ***Others0.494(0.000) 0.383(0.003) ***322Note: Estimated by us<strong>in</strong>g Lev<strong>in</strong>sohn and Petr<strong>in</strong> (2003) method, with value-added as outpu t and rawmaterials and consu mption of energy as pro xies for observed productivity; p-values <strong>in</strong>parentheses; *** , ** , <strong>in</strong>dicate significance at 1%, 5%, and 10% <strong>level</strong>s, respectively.5) **27
(2) Table of estimation results with coeffici ents of dumm ies <strong>in</strong>cludedTable A.2: PROBABILITY MODEL OF EXPORTING(Dependentvariable: Exporter)Independen t Variables (1) (2) (3) (4) (5) (6)Exporter t-13.2613 1.9915 3.2339 1.8659(0.1377) (0.2362) (0.1348) (0.2491) n(TFP a t-1)L -0.1313 -0.1189 0.1071( 0.0678) * ( 0.1189) (0.1226)Ln(Labor Productivity a t-1)-0.1801(0.0748) -0.6498(0. 1660) *** -0.1800( 0.1317)Ln(Capital a t-1)0.1235(0. 0417) *** 0.3810(0.0855) 0.7995(0.0863) 0.1401(0.0413) 0.7936(0.1663) 0.8485(0.0862) ge a t-1A 0.0840 -0.0624 0.4016 0.0657 0.3684 0.4294( 0.0957) ( 0.1661) (0.1973) ( 0.0954) ( 0.1983) * (0.1972) Age Squared a t-1-0.0629( 0.0427)-0.0128( 0.0781)-0.1963( 0.1016) * -0.0577(0.0427)-0.2265(0.0981) -0.2095(0.1025) Capital Intensity a t-1-0.1171(0.0514) -0.3083(0.0956) -0.7567(0.1171) -0.0929(0.0413) -0.3569(0.0807) -0.7565(0.1173) Wage a t-1 0.0459 0.1177 0.1433 0.0658 0.3158 0.2046(0.0593) ( 0.1017) (0.0868) (0.0658) (0. 1255) ** (0. 0985) **Foreign 0.2375 1.7035 2.3851 0.2785 2.3878 2.6000(0.2174) (0.4338) *** (0.4264) *** (0.2148) (0.5614) *** (0.4196) ***Industry 1 0.1415(0.2505)1.3817(0.4562) *** 1.8770(0.4684) *** 0.1547(0.2498)1.4603(0.5004) *** 1.8099(0.4657) ***Industry 2 0.5686 2.3144 2.8170 0.5655 3.0934 2.7327(0.2955) * (0.5604) *** (0.5882) *** (0.2955) * (0.7182) *** (0.5893) ***Industry 3 0.5802 3.0011 4.1246 0.6043 3.4353 4.1280(0.3298) * (0.6697) *** (0.6095) *** (0.3272) * (0.7857) *** (0.6068) ***Industry 4 0.4209 2.4296 4.2674 0.4514 3.2677 4.2477(0.4663) (0.7490) *** (0.9977) *** (0.4562) (0.8853) *** (1.0027) ***Industry 5 0.3397 1.2613 1.7664 0.3460 2.3900 1.6701(0.2598) (0.4160) *** (0.4905) *** (0.2605) (0.6241) *** (0.4891) ***Industry 6 -0.0981 -0.5406 -1.2450 -0.1255 -1.8013 -1.3340(0.3240) (0.5074) (0.6623) * (0.3256) (0.7295) ** (0.6654) **Industry 7 -0.9088 -1.5743 -1.2559 -0.8718 -1.9250 -1.3524(0.3389) *** (0.4936) *** (0.6215) ** (0.3356) *** (0.5882) *** (0.6203) **Industry 8 0.0784 0.2188 -0.1247 0.0705 -0.0254 -0.1823(0.2979) (0.4571) (0.5774) (0.2989) (0.4849) (0.5767)Industry 9 -0.2493 -0.8929 -1.2056 -0.2420 -1.3014 -1.2899(0.2944) (0.6182) (0.5727) ** (0.2940) (0.6476) ** (0.5683) **Industry 10 -0.2590 0.0267 -0.6462 -0.2513 0.0855 -0.738928
(0.3254) (0.4484) (0.6159) (0.3229) (0.4925) (0.6150)Industry 11 0.0025 -0.7624 0.5754(0.4814) (0.7946) (0.9752)Industry 12 -0.2493 -0.5279 0.5428 -0.2348 -0.4110 0.5173(0.3224) (0.4966) (0.5677) (0.3185) (0.6251) (0.5656)Year 2004 0.4516 0.4966 -0.1624 0.4619 0.5692 -0.1555(0.1265) *** (0.1731) *** (0.1440) (0.1258) *** (0.1851) *** (0.1431)Region 1 -0.0072 -0.0973 -0.3651 0.0144 -0.1068 -0.19520.2309 0.3683 0.4296 0.2290 0.4053 0.4235Region 2 -0.0690 -0.3944 -0.0663 -0.0857 -0.7134 0.01710.2718 0.4519 0.4940 0.2707 0.5347 0.4894Region 3 -0.0008 0.0717 0.6811 0.0069 0.7226 0.7880(0.2308) (0.3623) (0.4217) (0.2287) (0.4317) * (0.4170) *Region 4 0.0055 -0.4092 -0.2427 0.0267 -0.1753 -0.0682(0.2778) (0.4510) (0.5305) (0.2769) (0.4877) (0.5234)Constants -1.9556 -2.0403 -0.6115 -2.0015 -2.5153 -0.8243(0.2980) *** (0.4560) *** (0.5163) (0.2969) *** (0.5710) *** (0.5249)Observations 1601 3051 1526 1635 3051 1558Log likelihood -261.93 -551.69 -484.48 -267.33 -567.84 -491.70Chi2 1536.15 271.16 253.30 1570.81 203.94 261.76Not e:*** , ** , and * <strong>in</strong>dicate significance at 1% , 5%, and 10% <strong>level</strong>s, respectively; Standard errors <strong>in</strong>parentheses; (1) and (4): Probit <strong>in</strong> pooled data; (2) and (5): Heckman’s random-effects dynamicprobit; (3) and (6): Random-effects probit <strong>in</strong> the sample of non-status-switchers; Number ofobservations <strong>in</strong> (2) and (5) <strong>in</strong>cludes those with miss<strong>in</strong>g data due to lagg<strong>in</strong>g of dependent variable;Superscript( a ) <strong>in</strong>dicates a <strong>level</strong> relative to <strong>in</strong>dustry mean29
REFERENCESAlvarez, R. and R.A. Lopez, “Export<strong>in</strong>g and Performance: <strong>Evidence</strong> <strong>from</strong> Chilean Plants,” Canadian Journalof Economics 28(4) (2005):1384-1400.Arellano M. and S. Bond, “Some Tests of Specification for Panel <strong>Data</strong>: Monte Carlo <strong>Evidence</strong> and anApplication to Employment Equations,” Review of Economic Studies 58 (1991):277-297.Arnold, J.M. and K. Huss<strong>in</strong>ger, “Export Behavior and <strong>Firm</strong> Productivity <strong>in</strong> German Manufactur<strong>in</strong>g: A<strong>Firm</strong>-<strong>level</strong> Analysis,” Review of World Economics 141(2) (2005):219-243.Aw, B.Y., X. Chen and M.J. Roberts, “<strong>Firm</strong>-Level <strong>Evidence</strong> on Productivity Differentials, Turnover, andExports <strong>in</strong> Taiwanese Manufactur<strong>in</strong>g,” NBER Work<strong>in</strong>g Paper No. 6235 (1997).Aw, B. Y., S. Chung and M.J. Roberts, “Productivity and Turnover <strong>in</strong> the Export Market: Micro-Level<strong>Evidence</strong> <strong>from</strong> the Republic of Korea and Taiwan (Ch<strong>in</strong>a),” The World Bank Economic Review 14(2000):65-90.Baldw<strong>in</strong> , R.E., “Openness and Growth: What’s the Empirical Relationship?” NBER Work<strong>in</strong>g Papers No.9578 (2003).Bernard , A.B. and J.B. Jensen, “Exporters, Jobs, and Wages <strong>in</strong> U.S. Manufactur<strong>in</strong>g: 1976-1987,” Brook<strong>in</strong>gs Paperson Economic Activity: Microeconomics (1995):67-119.Bernard , A.B. and J.B. Jensen, “Exporters, Skill-Upgrad<strong>in</strong>g, and the Wage Gap,” Journal of InternationalEconomics 42 (1) (1997):3-31.Bernard, A.B. and J.B. Jensen, “Exceptional Exporter Performance: Cause, Effect, or Both?” Journal ofInternational Economics 47(1) (1999):1-25.Bernard, A.B. and J.B. Jensen, “Why some <strong>Firm</strong>s Export,” The Review of Economics and Statistics 86(2)(2004):561-569.Bernard, A.B., S. Redd<strong>in</strong>g and P.K. Schott, “Comparative Advantage and Heterogeneous <strong>Firm</strong>s,” Review ofEconomic Studies 74(1)( 2007a):31-66.Bernard, A.B., S. Redd<strong>in</strong>g and P.K. Schott, “<strong>Firm</strong>s and International Trade,” CEPR Discussion Paper No. 6277(2007b).Bigsten, A., Collier, P., Dercon, S., Fafchamps, M., Gauthier, B., Gunn<strong>in</strong>g, J.W., Oduro, A., Oostendorp, R.,Pattillo, C., Soderbom., M., Teal, F. and Zeufack, A., “Do African Manufactur<strong>in</strong>g <strong>Firm</strong>s Learn <strong>from</strong>Export<strong>in</strong>g,” The Journal of Development Studies 40(3) (2004):115–141.Blalock , G.. and P.J. Gertler, “Learn<strong>in</strong>g <strong>from</strong> Export<strong>in</strong>g Revisited <strong>in</strong> a Less Developed Sett<strong>in</strong>g,” Journal ofDevelopment Economics 75 (2004):397-416.Castellani, D., “Export Behavior and Productivity Growth: <strong>Evidence</strong> <strong>from</strong> Italian Manufactur<strong>in</strong>g <strong>Firm</strong>s,”Review of World Economics 138(4) (2002):605-628.Clerides, S.K., S. Lach and J.R. Tybout, “Is Learn<strong>in</strong>g by Export<strong>in</strong>g Important? Micro-Dynamic <strong>Evidence</strong><strong>from</strong> Colombia, Mexico, and Morocco,” Quarterly Journal of Economics CXIII (1998):903-947.Damijan, J.P., S. Polanec and J. Prasnikar, “Self-Selection, Export Market Heterogeneity and ProductivityImprovements: <strong>Firm</strong> Level <strong>Evidence</strong> From Slovenia,” Katholieke Universiteit Leuven, LICOSDiscussion Paper 148/2004 (2004).Delgado, M., J. Far<strong>in</strong>as, and S. Ruano, “<strong>Firm</strong> Productivity and Export Markets: a Nonparametric Approach,”Journal of International Economics 57 (2002):397-422.30
Falvey, R., D. Greenaway and Z. Yu, “Extend<strong>in</strong>g the Melitz Model to Asymmetric Countries,” University ofNott<strong>in</strong>gham Research Paper, No. 2006/07 (2006).Gourlay, A. and J. Seaton, “Expla<strong>in</strong><strong>in</strong>g the Decision to Export: <strong>Evidence</strong> <strong>from</strong> UK <strong>Firm</strong>s,” AppliedEconomics Letters, 11(3) (2004):153-158.GSO, “Industrial Complete Survey 30/6/1998,” General Statistics Office of <strong>Vietnam</strong> (1998),http://www.gso.gov.vn/default_en.aspx?tabid=479&idmid=4&ItemID=4362GSO, “The Real Situation of Enterprises Through the Results of Surveys Conducted <strong>from</strong> 2002 to 2005,”General Statistics Office of <strong>Vietnam</strong> (2005),http://www.gso.gov.vn/default_en.aspx?tabid=479&idmid=4&ItemID=4362.GSO, “ Producers Price Index of Industrial Product (Previous=100),” Trade, Price and Tourism, Statistical<strong>Data</strong>, General Statistics Office of <strong>Vietnam</strong> (2007),http://www.gso.gov.vn/default_en.aspx?tabid=472&idmid=3&ItemID=5170Greenaway, D. and R. Kneller, “Export<strong>in</strong>g and Productivity <strong>in</strong> the United K<strong>in</strong>gdom,” Oxford Review ofEconomic Policy 20(3) (2004):358-371.Hahn, C.H., “Export<strong>in</strong>g and Performance of Plants: <strong>Evidence</strong> <strong>from</strong> Korean Manufactur<strong>in</strong>g,” NBER Work<strong>in</strong>gPaper No. 10208 (2004).Hansson, P. and N. N. Lund<strong>in</strong>, “Exports as an Indicator on or Promoter of Successful Swedish Manufactur<strong>in</strong>g<strong>Firm</strong>s <strong>in</strong> the 1990s,” Review of World Economics 140(3) (2004):415-445.Heckman, J.J., "Statistical Models for Discrete Panel <strong>Data</strong>," <strong>in</strong> Structural Analysis of Discrete Panel <strong>Data</strong> withEconometric Applications, edited by C. F. Manski and D. McFadden, Cambridge, MA:MIT Press(1981a).Heckman, J.J., "Heterogeneity and State Dependence," <strong>in</strong> Studies of Labor Markets, edited by S. Rosen.Chicago: The National Bureau of Economic Research, The University of Chicago Press (1981b).Helmers, C. and N. Trofimenko, “Size Matters? Counter<strong>in</strong>tuitive F<strong>in</strong>d<strong>in</strong>gs on Export Subsidies,” Spr<strong>in</strong>g 2007Midwest Trade Meet<strong>in</strong>g (2007).Helpman, E., M. Melitz and Y. Rub<strong>in</strong>ste<strong>in</strong>, “Estimat<strong>in</strong>g Trade Flows: Trad<strong>in</strong>g Partners and Trad<strong>in</strong>g Volumes,”NBER Work<strong>in</strong>g Papers No. 12927 (2007).Honore, B.E. and E. Kyriazidou, “Panel <strong>Data</strong> Discrete Choice Models with Lagged Dependent Variables,”Econometrica, Vol. 68(4) (2000):839-874.Lev<strong>in</strong>sohn, J. and P. Petr<strong>in</strong>, “Estimat<strong>in</strong>g Production Functions Us<strong>in</strong>g Inputs to Control for Unobservables,”The Review of Economic Studies 70(2) (2003):317-341.Mar<strong>in</strong>, D., “Is the Export-Led Growth Hypothesis Valid for Industrialized Countries?” Review of Economicsand Statistics 74 (4) (1992):678–688.Med<strong>in</strong>a-Smith, E.J., “Is the Export-Led Growth Hypothesis Valid for Develop<strong>in</strong>g Countries? A Case Study ofCosta Rica,” UNCTAD, Policy Issues <strong>in</strong> International Trade and Commodities, Study Series No. 07(2001).Melitz, M., “The Impact of Trade on Intra-Industry Reallocations and Aggregate Industry Productivity,”Econometrica, 71(6) (2003):1695-1725.Melitz, M. and G. Ottaviano, “Market Size, Trade and Productivity,” NBER Work<strong>in</strong>g Paper No. 11393 (2005).Moen, O., “The Born Globals, a New Generation of Small European Exporters,” International Market<strong>in</strong>gReview 19(2) (2002):156-175.31
PEdition,Olley S. and A. Pakes, “The Dynamics of Productivity <strong>in</strong> the Telecommunications Equipment Industry”,Econometrica, 64 (1996):1263-1297.Petr<strong>in</strong>, A., J. Lev<strong>in</strong>sohn and B. Poi, “Production Function Estimation <strong>in</strong> Stata Us<strong>in</strong>g Inputs to Control forUnobservables,” Stata Journal (2004).Roberts, M.J. and J.R. Tybout, “The Decision to Export <strong>in</strong> Colombia: An Empirical Model of Entry with SunkCosts,” The American Economic Review 87(4) (1997):545-564.Rodriguez, F., “Openness and Growth: What have we learned,” Wesleyan Economics Work<strong>in</strong>g Papers No.2006-011 (2006).S<strong>in</strong>ani, E. and Hobdari B., “Export Market Participation: The Importance of Sunk Costs and Spillovers,”Copenhagen Bus<strong>in</strong>ess School Work<strong>in</strong>g Paper Series (2007).SME TAC, “Results of Enterprise Survey <strong>in</strong> 30 Northern Prov<strong>in</strong>ces and Cities <strong>in</strong> 2005,” SME TechnicalAssistance Center <strong>in</strong> Hanoi (2005).Steward, M.B., “Redprob - A Stata Program for the Heckman Estimator of the Random Effects DynamicProbit Model,” Stata Journal (2006).Van Dijk, M., “The Determ<strong>in</strong>ants of Export Performance <strong>in</strong> Develop<strong>in</strong>g Countries: The Case of IndonesianManufactur<strong>in</strong>g,” E<strong>in</strong>dhoven Centre for Innovation Studies Work<strong>in</strong>g Paper 02.02 (2002).Wagner, J., “HExports and Productivity: A Survey of the <strong>Evidence</strong> <strong>from</strong> <strong>Firm</strong>-<strong>level</strong> <strong>Data</strong>H,” HThe World EconomyH30(1) (2007):60-82.Wooldridge, J.M., “Introductory Econometrics: A Modern Approach,” 2PLearn<strong>in</strong>g (2003).ndSouth-Western, ThomsonYasar, M. and R.M. Rejesus, “Export Status and <strong>Firm</strong> Performance: <strong>Evidence</strong> <strong>from</strong> a Matched Sample,”Economics Letters 88 (2005):397-402.32