Strategic Plan June 24, 2008 - StopWaste.Org
Strategic Plan June 24, 2008 - StopWaste.Org
Strategic Plan June 24, 2008 - StopWaste.Org

You also want an ePaper? Increase the reach of your titles
YUMPU automatically turns print PDFs into web optimized ePapers that Google loves.
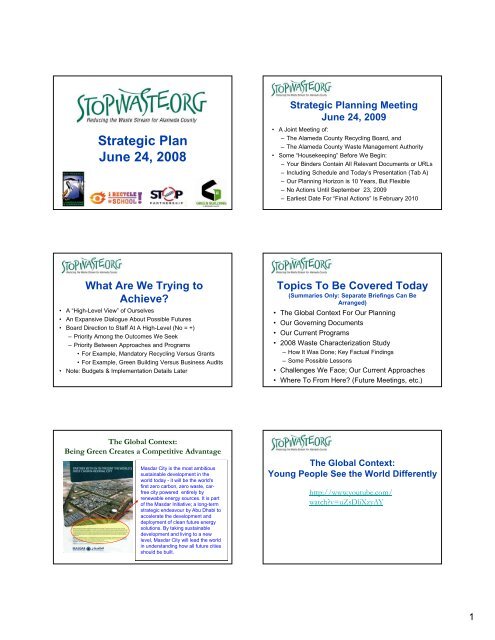
<strong>Strategic</strong> <strong>Plan</strong><strong>June</strong> <strong>24</strong>, <strong>2008</strong><strong>Strategic</strong> <strong>Plan</strong>ning Meeting<strong>June</strong> <strong>24</strong>, 2009• A Joint Meeting of:– The Alameda County Recycling Board, and– The Alameda County Waste Management Authority• Some “Housekeeping” Before We Begin:– Your Binders Contain All Relevant Documents or URLs– Including Schedule and Today’s Presentation (Tab A)– Our <strong>Plan</strong>ning Horizon is 10 Years, But Flexible– No Actions Until September 23, 2009– Earliest Date For “Final Actions” Is February 2010What Are We Trying toAchieve?• A “High-Level View” of Ourselves• An Expansive Dialogue About Possible Futures• Board Direction to Staff At A High-Level (No = +)– Priority Among the Outcomes We Seek– Priority Between Approaches and Programs• For Example, Mandatory Recycling Versus Grants• For Example, Green Building Versus Business Audits• Note: Budgets & Implementation Details LaterTopics To Be Covered Today(Summaries Only: Separate Briefings Can BeArranged)• The Global Context For Our <strong>Plan</strong>ning• Our Governing Documents• Our Current Programs• <strong>2008</strong> Waste Characterization Study– How It Was Done; Key Factual Findings– Some Possible Lessons• Challenges We Face; Our Current Approaches• Where To From Here? (Future Meetings, etc.)The Global Context:Being Green Creates a Competitive AdvantageMasdar City is the most ambitioussustainable development in theworld today - it will be the world'sfirst zero carbon, zero waste, carfreecity powered entirely byrenewable energy sources. It is partof the Masdar Initiative; a long-termstrategic endeavour by Abu Dhabi toaccelerate the development anddeployment of clean future energysolutions. By taking sustainabledevelopment and living to a newlevel, Masdar City will lead the worldin understanding how all future citiesshould be built.The Global Context:Young People See the World Differentlyhttp://www.youtube.com/watch?v=uZsDliXzyAY1
PurposeMethodology• Why?– Provide detailed data and analysis on what’s in wastestream to inform future program direction– Identify and quantify waste streams and materialtypes– Compare to previous studies (2000 & 1995)– Where possible, evaluate program progress• Four season sorting and sampling in <strong>2008</strong>• Five waste streams: single family, multi-family,commercial, roll-offoff and self-haul• Material types – 48• Physical sorts (1,100 samples, minimum 200 lbs. each)• Visual sorts for certain loads (1,200 observations)• Data for all jurisdictions• Self-Hauler surveys• “Divertability analysis”Manual Sort4
(Add more photos)• Click through quickly with minimal speaking pointsIntroduction to Results• Tons & Proportions• Material definitions– 9 major groups– 48 types under those• Sector (Collection method)– Single Family– Multi-Family– Commercial– Roll-Off– Self-Haul• Activity (Generator)– Residential– Commercial– Construction– Manufacturing• Jurisdiction– 17 Member Agencies• Previous Studies– 1995 & 2000Waste CompositionHaz. Waste, 1.0% Special, 3.5% Paper, 20.9%Inerts, 11.4%Plastic, 9.9%<strong>Org</strong>anic,40.3%Glass, 3.0%Metal, 4.3%Yard Waste,5.7%5
Historic Comparison of Composition45.0%40.0%35.0%30.0%25.0%20.0%15.0%10.0%5.0%0.0%19952000<strong>2008</strong>Self-Haul22%Roll-Off26%2000Waste by Sector(Collection Method)SingleFamily21%Comm'l23%Self-Haul23%Roll-Off23%<strong>2008</strong>Multi-Family8%SingleFamily23%Multi-Family11%Comm'l20%Changes by SectorRoll-Off By ActivityWasteStream1995 2000 <strong>2008</strong> % Change2000 – <strong>2008</strong>Single Family 333,000 332,700 275,000 - 17%Multi-Family 112,000 123,000 132,000 + 7%Commercial 265,000 354,000 237,000 -33%Roll-Off 339,000 406,000 273,000 -33%Self-Haul 466,000 336,000 269,000 -20%Total* 1,514,000 1,553,000 1,187,000 -<strong>24</strong>%Manufacturing9%Construction7%Residential12%Commercial72%*Note: Waste delivered directly to out-of-county facilities or MRF residuals are not included.Self-Haul by ActivityConstruction15%Manufacturing1%Construction21%Waste By Activity2000Mfg5%Residential33%Construction5%<strong>2008</strong>Mfg2%Residential53%Commercial13%Residential71%Comm'l41%Comm'l40%6
Changes By Activity(1995, 2000, <strong>2008</strong>)Activity 1995 Tons 2000 Tons <strong>2008</strong> Tons % Change2000 – <strong>2008</strong>Residential 641,000 518,000 631,000 22%Commercial 539,000 637,000 469,000 ‐26%Construction <strong>24</strong>4,000 322,000 60,000 ‐81%Manufacturing 90,000 76,000 27,000 ‐64%Next Steps• <strong>StopWaste</strong> Staff Review– Countywide– Sector– Activity• Member Agency Staff Review• Database & Other Sources of Information– In depth analysis• Feed Into the <strong>Strategic</strong> <strong>Plan</strong>ning ProcessTotal 1,514,000 1,553,000 1,187,000 -<strong>24</strong>%Questions?Waste CharacterizationSome Lessons LearnedLesson 1Target Materials Still ImportantTarget 2000% of TotalFood WasteUnpainted Wood<strong>2008</strong>% of TotalChange2000-<strong>2008</strong>12% 14% 2%9% 4% ‐5%Other paper8% 9% 1%Yard Waste7% 4% ‐3%Mixed paper5% 3% ‐2%Cardboard5% 2% ‐3%Composite Bulky5% 2% ‐3%Film Plastic4% 4% ‐1%Crushable Inerts4% 3% ‐1%Newspaper3% 1% ‐2%% of Total Waste 61% 61% 0%Lesson 2Progress, But Work Left To DoTarget 2000 <strong>2008</strong> % Change2000-<strong>2008</strong>Food Waste 185,000 222,000 20%Unpainted Wood 137,000 61,000 -55%Other paper 122,000 135,00011%Yard Waste 109,000 68,000 -38%Mixed paper 79,000 53,000 -33%Cardboard 77,000 36,000 -53%Composite Bulky 76,000 37,000 -51%Film Plastic 67,000 58,000 -13%Crushable Inerts 57,000 49,000 - 14%Newspaper 42,000 9,000 -79%Subtotal 951,000 728,000 -23%7
Lesson 3Hard to Recycle Materials Important• Even though we have targeted 60% of the waste stream,still have 40% left• Hard to recycle materials include:– Treated wood and other C&D: 13%– Misc organics: 10%– Plastics: 4%– Hazardous Waste (incl. electronics): 1%Lesson 4Be Ready for the Rebound• Construction activity downsubstantially• 70% of the overall decreasein tons is due to construction• Most susceptible to a rebound• Most impact on total• Current in-county capacityinadequate• Ordinances may not beenough by themselvesConstruction 2000 <strong>2008</strong>ActivityTotal Tons 321,000 60,000% Total 21% 5%Total 2000-<strong>2008</strong> Change - 366,000Construction Change - 261,000% Due to Construction Change 70%*Overall decline in construction materialsacross all sectors/activities is 40%.Nine ChallengesSpanning Three AreasQuestions?Challenge 1• Multiplicity of Objectives– Tons to Landfill Reduced– Waste Prevention vs. Material Recovery– Other CoIWMP Goals and Objectives: e.g., RemoveHazardous Waste From the Waste Stream– Sustainable Consumption Patterns (Natural Gas,Electricity, and Water Use, GHG Emissions, Others)Challenge 2• Limited Control– Many Decisions Are Outside the County, CA, or US– Commodity Market Prices Fluctuate• Current Approach:– Limited Participation in State and National Coalitions– Considerably More Local Coalition Building (e.g., GB, BFL)– No Clear Approach to Commodity Price Fluctuations• Current Approach:– Weighted Average Project Evaluation Scores– Try to Accommodate Everyone To Some Extent8
Challenge 3• Fragmented Control– Franchise Terms Are Jurisdictional Decisions• Services Offered• Relative Rates for Service Categories (Customer Incentives)• Incentives for Franchisee to Support Diversioni• Materials are Controlled by the Franchisee– Desire for Local Uniqueness and Autonomy Is Natural• Current Approach:– Model Ordinances, Franchise Language, Etc.– <strong>StopWaste</strong> Regional and Sub-Regional RoleChallenge 4• Diversion Is Not a Top Priority– Plenty of Landfill Capacity in Alameda County– Dollar Savings From Diversion Are Often Modest• Current Approach:– Multiple Benefits Used To Broaden Support– Technical Assistance and Specialized Outreach(for example, GHG Benefits of Recycling)Challenge 5• Public Perceptions and Misunderstanding– Example: Glass in Compost– Example: The “Yuck Factor” With Food Scraps• Current Approach:– Education of the Next Generation– Mass Media For Some Topics (e.g., Food Scraps)Challenge 6• Siting Issues for Material Processing,Composting, and Manufacturing Facilities– Land, Labor, and Energy Are Expensive Here– The NIMBY Syndrome– No Incentive For Jurisdictions to Host Facilities• Current Approach:– Try, Try AgainChallenge 7• Financial Incentives Not Always Aligned– Landfill Disposal Is Relatively Inexpensive– Price Signals to Customers Not Always Clear– Revenue Loss From Recycling Is a Penalty• Current Approach:– Be Willing to Impose Disposal Fees– Buy Down the Cost of Diversion In Various Ways– Offer Franchise Negotiation AssistanceChallenge 8• Mission Success = Declining Revenues• Current Approach:– Some Diversification of Income (e.g., Wind Revenue)– But No Clear Approach At Present9
Challenge 9• Need Many Technical and Managerial Skills– Wide Range of Programmatic Skills– Emerging Needs: Enforcement, Communications,Economic Development, Revenue Audits, ???• Current Approach:– Use Consultants Extensively– Ask Staff To Be Flexible– But Need A More Explicit ApproachOther Challenges?Comments?Schedule• Six Discussion Topics Over the SummerWhere To From Here?Four Types of Materials Management Decisions• September 23 Joint Meeting• November Seminar• February “Final” Decisions• FY10-11 BudgetVirgin MaterialsProductionMaterialsProcessingConsumptionDiscardThe Six Topics:– Communications & Long-Term Behavior Change– Targets & Measurement– Buildings & Landscapes– Operations & Maintenance– Facilities & Collection– RevenueLandfillsHHW10