Modelling Swelling Rock Behaviour in Tunnelling.pdf - Plaxis
Modelling Swelling Rock Behaviour in Tunnelling.pdf - Plaxis
Modelling Swelling Rock Behaviour in Tunnelling.pdf - Plaxis

You also want an ePaper? Increase the reach of your titles
YUMPU automatically turns print PDFs into web optimized ePapers that Google loves.
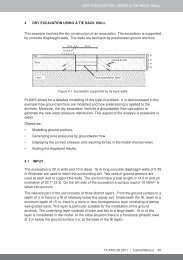
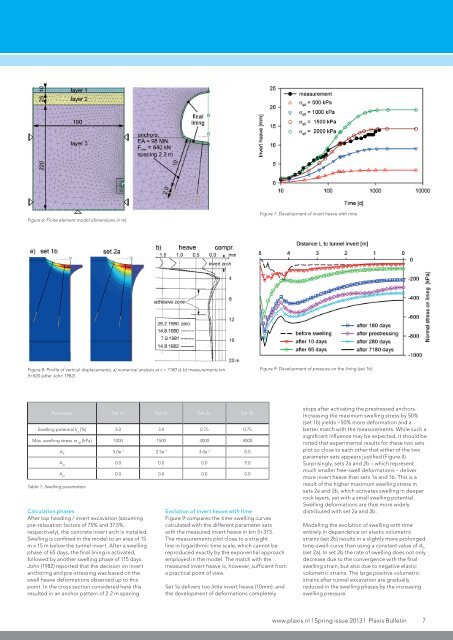
Figure 6: F<strong>in</strong>ite element model (dimensions <strong>in</strong> m)Figure 7: Development of <strong>in</strong>vert heave with timeFigure 8: Profile of vertical displacements, a) numerical analysis at t = 7180 d, b) measurements km5+820 (after John 1982)Figure 9: Development of pressure on the l<strong>in</strong><strong>in</strong>g (set 1b)Parameter Set 1a Set 1b Set 2a Set 2b<strong>Swell<strong>in</strong>g</strong> potential k q[%] 3.0 3.0 0.75 0.75Max. swell<strong>in</strong>g stress s q0[kPa] 1000 1500 4000 4000Table 1: <strong>Swell<strong>in</strong>g</strong> parametersA 05.0e -3 2.5e -3 3.0e -3 0.0A el0.0 0.0 0.0 9.0A pl0.0 0.0 0.0 0.0Calculation phasesAfter top head<strong>in</strong>g / <strong>in</strong>vert excavation (assum<strong>in</strong>gpre-relaxation factors of 75% and 37.5%,respectively), the concrete <strong>in</strong>vert arch is <strong>in</strong>stalled.<strong>Swell<strong>in</strong>g</strong> is conf<strong>in</strong>ed <strong>in</strong> the model to an area of 15m x 15 m below the tunnel <strong>in</strong>vert. After a swell<strong>in</strong>gphase of 65 days, the f<strong>in</strong>al l<strong>in</strong><strong>in</strong>g is activated,followed by another swell<strong>in</strong>g phase of 115 days.John (1982) reported that the decision on <strong>in</strong>vertanchor<strong>in</strong>g and pre-stress<strong>in</strong>g was based on theswell heave deformations observed up to thispo<strong>in</strong>t. In the cross section considered here thisresulted <strong>in</strong> an anchor pattern of 2.2 m spac<strong>in</strong>g.Evolution of <strong>in</strong>vert heave with timeFigure 9 compares the time-swell<strong>in</strong>g curvescalculated with the different parameter setswith the measured <strong>in</strong>vert heave <strong>in</strong> km 5+373.The measurements plot close to a straightl<strong>in</strong>e <strong>in</strong> logarithmic time scale, which cannot bereproduced exactly by the exponential approachemployed <strong>in</strong> the model. The match with themeasured <strong>in</strong>vert heave is, however, sufficient froma practical po<strong>in</strong>t of view.Set 1a delivers too little <strong>in</strong>vert heave (10mm), andthe development of deformations completelystops after activat<strong>in</strong>g the prestressed anchors.Increas<strong>in</strong>g the maximum swell<strong>in</strong>g stress by 50%(set 1b) yields ~50% more deformation and abetter match with the measurements. While such asignificant <strong>in</strong>fluence may be expected, it should benoted that experimental results for these two setsplot so close to each other that either of the twoparameter sets appears justified (Figure 4).Surpris<strong>in</strong>gly, sets 2a and 2b – which representmuch smaller free-swell deformations – delivermore <strong>in</strong>vert heave than sets 1a and 1b. This is aresult of the higher maximum swell<strong>in</strong>g stress <strong>in</strong>sets 2a and 2b, which activates swell<strong>in</strong>g <strong>in</strong> deeperrock layers, yet with a small swell<strong>in</strong>g potential.<strong>Swell<strong>in</strong>g</strong> deformations are thus more widelydistributed with set 2a and 2b.<strong>Modell<strong>in</strong>g</strong> the evolution of swell<strong>in</strong>g with timeentirely <strong>in</strong> dependence on elastic volumetricstra<strong>in</strong>s (set 2b) results <strong>in</strong> a slightly more prolongedtime-swell-curve than us<strong>in</strong>g a constant value of A 0(set 2a). In set 2b the rate of swell<strong>in</strong>g does not onlydecrease due to the convergence with the f<strong>in</strong>alswell<strong>in</strong>g stra<strong>in</strong>, but also due to negative elasticvolumetric stra<strong>in</strong>s. The large positive volumetricstra<strong>in</strong>s after tunnel excavation are graduallyreduced <strong>in</strong> the swell<strong>in</strong>g phases by the <strong>in</strong>creas<strong>in</strong>gswell<strong>in</strong>g pressure.www.plaxis.nl l Spr<strong>in</strong>g issue 2013 l <strong>Plaxis</strong> Bullet<strong>in</strong> 7