Nessie II Autonomous Underwater Vehicle - Xsens
Nessie II Autonomous Underwater Vehicle - Xsens
Nessie II Autonomous Underwater Vehicle - Xsens
- No tags were found...

You also want an ePaper? Increase the reach of your titles
YUMPU automatically turns print PDFs into web optimized ePapers that Google loves.
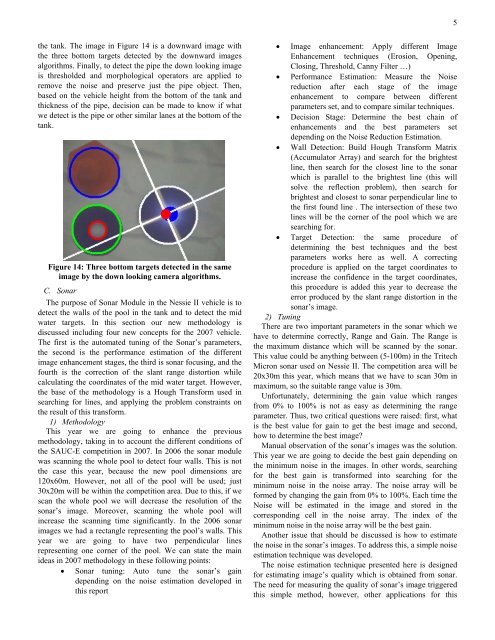
5the tank. The image in Figure 14 is a downward image withthe three bottom targets detected by the downward imagesalgorithms. Finally, to detect the pipe the down looking imageis thresholded and morphological operators are applied toremove the noise and preserve just the pipe object. Then,based on the vehicle height from the bottom of the tank andthickness of the pipe, decision can be made to know if whatwe detect is the pipe or other similar lanes at the bottom of thetank.Figure 14: Three bottom targets detected in the sameimage by the down looking camera algorithms.C. SonarThe purpose of Sonar Module in the <strong>Nessie</strong> <strong>II</strong> vehicle is todetect the walls of the pool in the tank and to detect the midwater targets. In this section our new methodology isdiscussed including four new concepts for the 2007 vehicle.The first is the automated tuning of the Sonar’s parameters,the second is the performance estimation of the differentimage enhancement stages, the third is sonar focusing, and thefourth is the correction of the slant range distortion whilecalculating the coordinates of the mid water target. However,the base of the methodology is a Hough Transform used insearching for lines, and applying the problem constraints onthe result of this transform.1) MethodologyThis year we are going to enhance the previousmethodology, taking in to account the different conditions ofthe SAUC-E competition in 2007. In 2006 the sonar modulewas scanning the whole pool to detect four walls. This is notthe case this year, because the new pool dimensions are120x60m. However, not all of the pool will be used; just30x20m will be within the competition area. Due to this, if wescan the whole pool we will decrease the resolution of thesonar’s image. Moreover, scanning the whole pool willincrease the scanning time significantly. In the 2006 sonarimages we had a rectangle representing the pool’s walls. Thisyear we are going to have two perpendicular linesrepresenting one corner of the pool. We can state the mainideas in 2007 methodology in these following points:• Sonar tuning: Auto tune the sonar’s gaindepending on the noise estimation developed inthis report• Image enhancement: Apply different ImageEnhancement techniques (Erosion, Opening,Closing, Threshold, Canny Filter …)• Performance Estimation: Measure the Noisereduction after each stage of the imageenhancement to compare between differentparameters set, and to compare similar techniques.• Decision Stage: Determine the best chain ofenhancements and the best parameters setdepending on the Noise Reduction Estimation.• Wall Detection: Build Hough Transform Matrix(Accumulator Array) and search for the brightestline, then search for the closest line to the sonarwhich is parallel to the brightest line (this willsolve the reflection problem), then search forbrightest and closest to sonar perpendicular line tothe first found line . The intersection of these twolines will be the corner of the pool which we aresearching for.• Target Detection: the same procedure ofdetermining the best techniques and the bestparameters works here as well. A correctingprocedure is applied on the target coordinates toincrease the confidence in the target coordinates,this procedure is added this year to decrease theerror produced by the slant range distortion in thesonar’s image.2) TuningThere are two important parameters in the sonar which wehave to determine correctly, Range and Gain. The Range isthe maximum distance which will be scanned by the sonar.This value could be anything between (5-100m) in the TritechMicron sonar used on <strong>Nessie</strong> <strong>II</strong>. The competition area will be20x30m this year, which means that we have to scan 30m inmaximum, so the suitable range value is 30m.Unfortunately, determining the gain value which rangesfrom 0% to 100% is not as easy as determining the rangeparameter. Thus, two critical questions were raised: first, whatis the best value for gain to get the best image and second,how to determine the best image?Manual observation of the sonar’s images was the solution.This year we are going to decide the best gain depending onthe minimum noise in the images. In other words, searchingfor the best gain is transformed into searching for theminimum noise in the noise array. The noise array will beformed by changing the gain from 0% to 100%. Each time theNoise will be estimated in the image and stored in thecorresponding cell in the noise array. The index of theminimum noise in the noise array will be the best gain.Another issue that should be discussed is how to estimatethe noise in the sonar’s images. To address this, a simple noiseestimation technique was developed.The noise estimation technique presented here is designedfor estimating image’s quality which is obtained from sonar.The need for measuring the quality of sonar’s image triggeredthis simple method, however, other applications for this