Taxation statistics 2010–11 - Australian Taxation Office
Taxation statistics 2010–11 - Australian Taxation Office
Taxation statistics 2010–11 - Australian Taxation Office

Create successful ePaper yourself
Turn your PDF publications into a flip-book with our unique Google optimized e-Paper software.
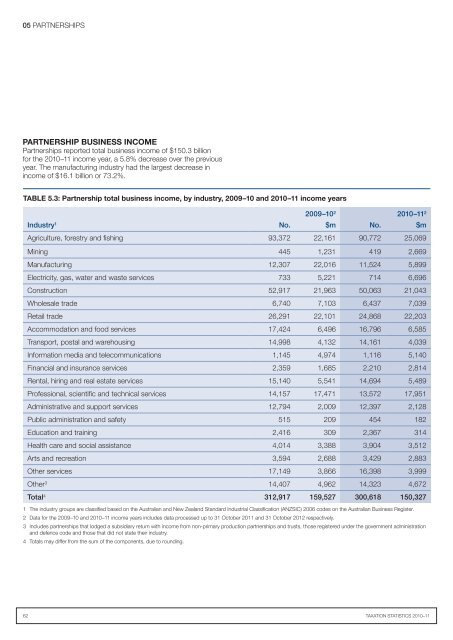
05 PARTNERSHIPSPARTNERSHIP BUSINESS INCOMEPartnerships reported total business income of $150.3 billionfor the <strong>2010–11</strong> income year, a 5.8% decrease over the previousyear. The manufacturing industry had the largest decrease inincome of $16.1 billion or 73.2%.TABLE 5.3: Partnership total business income, by industry, 2009–10 and <strong>2010–11</strong> income yearsIndustry 1 2009–10 2 <strong>2010–11</strong> 2No. $m No. $mAgriculture, forestry and fishing 93,372 22,161 90,772 25,069Mining 445 1,231 419 2,669Manufacturing 12,307 22,016 11,524 5,899Electricity, gas, water and waste services 733 5,221 714 6,696Construction 52,917 21,963 50,063 21,043Wholesale trade 6,740 7,103 6,437 7,039Retail trade 26,291 22,101 24,868 22,203Accommodation and food services 17,424 6,496 16,796 6,585Transport, postal and warehousing 14,998 4,132 14,161 4,039Information media and telecommunications 1,145 4,974 1,116 5,140Financial and insurance services 2,359 1,685 2,210 2,814Rental, hiring and real estate services 15,140 5,541 14,694 5,489Professional, scientific and technical services 14,157 17,471 13,572 17,951Administrative and support services 12,794 2,009 12,397 2,128Public administration and safety 515 209 454 182Education and training 2,416 309 2,367 314Health care and social assistance 4,014 3,388 3,904 3,512Arts and recreation 3,594 2,688 3,429 2,883Other services 17,149 3,866 16,398 3,999Other 3 14,407 4,962 14,323 4,672Total 4 312,917 159,527 300,618 150,3271 The industry groups are classified based on the <strong>Australian</strong> and New Zealand Standard Industrial Classification (ANZSIC) 2006 codes on the <strong>Australian</strong> Business Register.2 Data for the 2009–10 and <strong>2010–11</strong> income years includes data processed up to 31 October 2011 and 31 October 2012 respectively.3 Includes partnerships that lodged a subsidiary return with income from non-primary production partnerships and trusts, those registered under the government administrationand defence code and those that did not state their industry.4 Totals may differ from the sum of the components, due to rounding.62 <strong>Taxation</strong> <strong>statistics</strong> <strong>2010–11</strong>