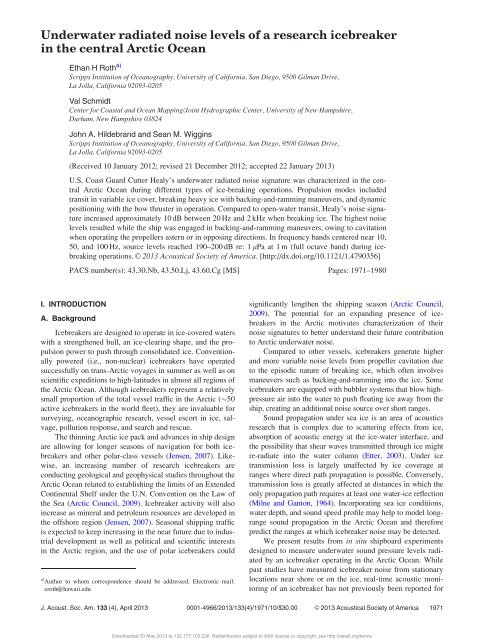
Underwater radiated noise levels of a research ice.pdf
Underwater radiated noise levels of a research ice.pdf
Underwater radiated noise levels of a research ice.pdf

You also want an ePaper? Increase the reach of your titles
YUMPU automatically turns print PDFs into web optimized ePapers that Google loves.
FIG. 2. Sound speed pr<strong>of</strong>ile (left)and ray path diagram (right) used toestimate launch angles for thebottom-bounce and direct path intersectionat the sonobuoy depth. Thehorizontal range at which this occursallows derivation <strong>of</strong> the slant rangefor transmission loss modeling.recordings were made. Portions <strong>of</strong> the sonobuoy recordings inclose proximity to the ship were clipped due to high <strong>noise</strong> <strong>levels</strong>and were not used for analysis. Although we assume that<strong>noise</strong> generated by the Healy’s propulsion and machinerydominate the <strong>radiated</strong> <strong>noise</strong>, the sounds <strong>of</strong> breaking <strong>ice</strong> mayalso be included in our recordings.B. Acoustic recording equipmentThe Sparton AN/SSQ-57B is a low frequency analysisand recording (LOFAR) sonobuoy that provides omnidirectionalpassive acoustic data between 10 Hz and 30 kHz. Thehydrophone depth was selected to be 122 m (400 ft) for <strong>noise</strong>measurements in deep water. A frequency modulated radiosignal was transmitted from the sonobuoys’ very high frequency(VHF) transmitter at the sea surface to an omnidirectionalantenna mounted atop Healy’s mast. Signalswere passed to an antenna splitter/amplifier, two ICOMR100 frequency modulated (FM) radio receivers, a SoundBlaster Audigy 2NX analog-to-digital (A/D) converter, andlaptop computer. The data were sampled at 48 kHz andrecorded using the real-time data acquisition s<strong>of</strong>tware ISH-MAEL (Mellinger, 2001).Sonobuoys scuttle after 8 h, but more <strong>of</strong>ten they wouldfirst exceed the transmission range for sufficient VHF reception(5 km). Because sonobuoys were not designed for <strong>ice</strong>coveredwaters, several deployments failed as the pack <strong>ice</strong>reconsolidated aft <strong>of</strong> Healy’s stern. The increase in surroundingpressure sometimes caused damage to the surface electronicsor hydrophone cable. There were also instanceswhere Healy would reverse direction due to <strong>ice</strong> conditions,and the sonobuoy was either destroyed or experienced intermittentdata loss due to contact with the ship.C. Hydrophone calibrationThe Sparton Corporation provides nominal calibrationcurves for the sonobuoy model used in these measurements.FIG. 3. (Color online) During transit in variable <strong>ice</strong> cover on August 27, 2008: (A) Healy’s ship track (gray line) relative to the sonobuoy deployment (small blackcircle), range estimate <strong>of</strong> the sonobuoy to the ship (large circle), as well as position and heading <strong>of</strong> Healy at 05:58:40 (arrow). The sonobuoy drifted with speedsover 1 knot (0.5 m/s), depending on surface currents, wind, and pack <strong>ice</strong> dynamics. Coordinate system origin is at 81 42.82 0 N, 143 59.65 0 W. (B) Images every5 min (time in upper left corner) from the Al<strong>of</strong>t-Conn camera provide an estimate <strong>of</strong> local sea <strong>ice</strong> coverage (/10 in upper right corner).J. Acoust. Soc. Am., Vol. 133, No. 4, April 2013 Roth et al.: Icebreaker <strong>noise</strong> in the Arctic Ocean 1973Downloaded 30 May 2013 to 132.177.103.226. Redistribution subject to ASA l<strong>ice</strong>nse or copyright; see http://asadl.org/terms
FIG. 4. During August 27 transit: (A) vessel speed-over-ground (solid) andpropeller shaft rotational speeds (starboard ¼ dashed; port ¼ dotted). (B)Source level estimates (dB re: 1 lPa at 1 m) centered around 55.6 Hz (49–62 Hz band) for 1/3 octave band and 56.6 Hz (40–80 Hz band) for 1-octaveband. Sea <strong>ice</strong> coverage estimates are shown at 5-min intervals along the top<strong>of</strong> the graph.Because actual calibration values may vary slightly in manufacturing,several sonobuoys were saved from the samemanufacturing batches as those used in the field. Postexperimentcalibrations <strong>of</strong> the hydrophones were conductedFIG. 5. During August 27 transit: (A) estimated source level <strong>of</strong> Healy transitingin 8/10’s <strong>ice</strong> cover at 05:26:30; range to the sonobuoy was approximately2 km. (B) Estimated source level <strong>of</strong> Healy transiting in 3/10’s <strong>ice</strong>cover at 05:51:20; range to the sonobuoy was approximately 4 km.at the Transducer Evaluation Center (TRANSDEC) facilityin San Diego, CA.Calibration runs were performed at a depth <strong>of</strong> 6 m tomeasure the received sensitivity <strong>of</strong> each sonobuoy inFIG. 6. (Color online) During backing-and-ramming operations on August 28, 2008: (A) ship track (gray line) relative to the sonobuoy deployment (smallblack circle), range estimate to the sonobuoy (large circle), as well as the position and heading <strong>of</strong> Healy at 23:10:10 (arrow). Coordinate system origin is at82 3.73 0 N, 142 28.40 0 W. (B) Images every 5 minutes (time in upper left corner) from the Al<strong>of</strong>t-Conn camera estimate local sea <strong>ice</strong> coverage (/10 in upperright corner).1974 J. Acoust. Soc. Am., Vol. 133, No. 4, April 2013 Roth et al.: Icebreaker <strong>noise</strong> in the Arctic OceanDownloaded 30 May 2013 to 132.177.103.226. Redistribution subject to ASA l<strong>ice</strong>nse or copyright; see http://asadl.org/terms
esponse to calibrated source transducers transmitting differentfrequency tones from 10 Hz to 30 kHz at a distance <strong>of</strong>2-10 m. An expected transfer function or frequency responsecalibration was computed based on the sensitivity <strong>of</strong> thetransducer elements in addition to the signal conditioningprovided by the amplifiers in the hydrophone, radio, andA/D converter. There was an uncertainty <strong>of</strong> 61–2 dB associatedwith the calculated transfer function compared to themeasured calibration response. Once the transfer functionwas applied to the raw data, measurements were reported asreceived pressure <strong>levels</strong> (dB re: 1 lPa rms).D. Signal processingThe MATLAB-based (The MathWorks Inc., Natick, MA)s<strong>of</strong>tware package TRITON (Wiggins and Hildebrand, 2007)was used for first-level signal processing to determinewhether data were clipped or not <strong>of</strong> suitable quality due topoor VHF radio transmission. In general, if the hydrophonewas within 1 km <strong>of</strong> Healy, the data were clipped and notused. When the sonobuoy was greater than 5 km from Healy,it became difficult for the radio receiver to acquire continuousdata with good quality.Spectral measurements are calculated from 1 or 5 s samples<strong>of</strong> continuous data with no overlap between each spectralaverage using the Goertzel algorithm to calculate power spectraldensities from discrete-time fast Fourier transforms(FFTs). All spectra were processed with a Hanning windowand 48 000-point FFT length, yielding 1 Hz frequency bins.For comparative analysis, spectral measurements are reportedusing 1 Hz bins as well as 1/3 and 1 octave bands based on astarting frequency <strong>of</strong> 10 Hz. After correcting for transmissionloss, measurements are reported as source <strong>levels</strong> at 1 m.E. Source/receiver range and azimuthTo estimate source <strong>levels</strong> from measured received <strong>levels</strong>,range estimation from the ship to the sonobuoy wasrequired to calculate transmission losses. In correcting fortransmission loss, a range dependent spreading loss <strong>of</strong>20 log 10 (R) was assumed, where R is the source/receiverslant range in meters. Ray-trace refraction and reflectionanalysis was used to estimate the distance between Healy’ssonar and the sonobuoy hydrophone. The time differencebetween arrivals resulting from direct path and first bottomreflection <strong>of</strong> the ship’s 12 kHz echo sounder were measuredin the sonobuoy acoustic data. These direct-path/first-reflectiontime differences were converted to ranges between theship and the sonobuoy through an iterative procedure inwhich an acoustic propagation model, incorporating themeasured sound speed pr<strong>of</strong>ile, local water depth, and depth<strong>of</strong> the sonobuoy hydrophone, were adjusted until theobserved time difference was matched (Fig. 2 and supplementaryFigs. 1 and 2). 1 Over the relatively short propagationranges used for this study (1–5 km), we found that20 log 10 (R) was a good approximation for the transmissionloss. The geometry and range <strong>of</strong> our measurements are suchthat direct path propagation is all but guaranteed, and soundscattering or reradiating from the water-<strong>ice</strong> interface is notthought to contribute meaningfully to our measurements.FIG. 7. During August 28 backing-and-ramming operations: (A) vesselspeed-over-ground (solid) and propeller shaft rotational speed (starboard ¼dashed; port ¼ dotted). (B) Source level estimates (dB re: 1 lPa at 1 m) centeredaround 11.3 Hz (10–13 Hz), 55.6 Hz (49–62 Hz), 111 Hz (98–123 Hz),1.12 kHz (0.985–1.24 kHz), and 11.3 kHz (9.93–12.5 kHz) for 1/3 octavebands, respectively. Spectral estimates for full octave bands are centeredaround 14.1 Hz (10–20 Hz), 56.6 Hz (40–80 Hz), 113 Hz (80–160 Hz),0.905 kHz (0.640–1.28 kHz), and 7.24 kHz (5.12–10.24 kHz), respectively.The ship was consistently in 8/10’s <strong>ice</strong> cover.J. Acoust. Soc. Am., Vol. 133, No. 4, April 2013 Roth et al.: Icebreaker <strong>noise</strong> in the Arctic Ocean 1975Downloaded 30 May 2013 to 132.177.103.226. Redistribution subject to ASA l<strong>ice</strong>nse or copyright; see http://asadl.org/terms
Because the sonobuoys drifted due to pack <strong>ice</strong> movements,winds, and ocean currents, the relative bearing <strong>of</strong> thesonobuoy to the ship, and hence the azimuthal aspect <strong>of</strong> theship that was measured at any instant is not known. Thereforeazimuthal variations in the ship’s <strong>radiated</strong> <strong>noise</strong> are notconsidered in the analysis. When directionality in shipgenerated<strong>noise</strong> due to propeller cavitation has been previouslyobserved, it is described as a dipole with smalleramplitudes on the ship’s bow and stern (Arveson and Vendittis,2000). Limited visual observations <strong>of</strong> the sonobuoydeployments indicated that the sonobuoy likely remainedabaft the beam when Healy was transiting. This may lead toslightly decreased measurements from those produced in accordancewith the ANSI standard (ANSI, 2009), whichspecifies measurements within 30 <strong>of</strong> the ship’s beam.F. Ancillary dataHealy is equipped with a ship-wide computerized datalogging system that records and stores data from the navigation,oceanographic, engineering, and communications systems.Several <strong>of</strong> these ancillary measurements were used foranalysis, including Healy’s position, heading, and speed overground, as well as environmental information such as thelocal sea <strong>ice</strong> coverage, which was estimated from time-lapseimages to the nearest 10%. The engineering data provided thetime along with corresponding port and starboard propellershaft speeds averaged from the cycloconverter readings andconverted from percentages to pure shaft rpm’s.III. RESULTSSeveral transient and continuous acoustic events wereselected as case studies for analysis that most accuratelyreflect Healy’s <strong>noise</strong> signature. Propulsion modes includetransit in varying pack <strong>ice</strong> conditions, backing-and-rammingmaneuvers, and dynamic positioning.A. Transit in variable <strong>ice</strong> coverDuring August 27, Healy transited from nearly completesea <strong>ice</strong> cover to an open-water polynya (Fig. 3 and supplementaryFig. 1). Healy’s transition from <strong>ice</strong>-breaking toopen water is evident at approximately 05:37 when propellershaft rpm’s decreased and speed over ground (SOG)increased as the resistance to movement abated in openwater [Fig. 4(A)]. A time series <strong>of</strong> source level estimatescentered near 50 Hz shows a decrease in mean level duringthe transition from <strong>ice</strong>-breaking to open water [at 05:37 inFig. 4(B)]. Moreover, large amplitude <strong>noise</strong> peaks [e.g.,05:22 and 05:24 in Fig. 4(B)] are reduced when the ship isoperating in open water.A comparison <strong>of</strong> source spectrum <strong>levels</strong> while Healy istransiting through 8/10’s and 3/10’s <strong>ice</strong> cover is shown inFigs. 5(A) and 5(B), respectively. At 10 Hz, both source spectraexhibit similar <strong>levels</strong> <strong>of</strong> about 182–183 dB re: 1 lPa 2 /Hz at1 m (1 Hz bins). Above 20 Hz, however, there is a 10 dB differenceon average between the two source spectra. In <strong>ice</strong>coveredwaters, the full octave band remains approximatelyflat between 100 and 300 Hz [Fig. 5(A)], while in open waterthe full octave band slopes steadily downward with frequencyup to 2 kHz [Fig. 5(B)]. In the 1 Hz bin spectra, underwater<strong>noise</strong> <strong>levels</strong> are higher by as much as 15 dB between 200 Hzand 2 kHz during moderate <strong>ice</strong>-breaking conditions whencompared to open-water transit. In both spectra, elevated <strong>levels</strong>between 3 and 5 kHz are attributed to the acoustic chirpFIG. 8. (Color online) During backing-and–ramming on August 28–29, 2008: (A) ship track (gray line) relative to the sonobuoy deployment (small blackcircle), range estimate to sonobuoy (large circle) as well as the position and heading <strong>of</strong> Healy at 00:25:00 (arrow). Coordinate system origin is at 82 3.27 0 N,142 30.27 0 W. (B) Images every 5 min (time in upper left corner) from the Al<strong>of</strong>t-Conn camera estimate local sea <strong>ice</strong> coverage (/10 in upper right corner).1976 J. Acoust. Soc. Am., Vol. 133, No. 4, April 2013 Roth et al.: Icebreaker <strong>noise</strong> in the Arctic OceanDownloaded 30 May 2013 to 132.177.103.226. Redistribution subject to ASA l<strong>ice</strong>nse or copyright; see http://asadl.org/terms
from the ship’s Knudsen sub-bottom pr<strong>of</strong>iler. Narrowbandpeaks at 12 kHz are due to the ping produced by Healy’s Sea-Beam 2102 multibeam echo sounder.B. Backing-and-ramming in full <strong>ice</strong> coverOn August 28, a sonobuoy recording was made duringmultiple backing-and-ramming maneuvers [Fig. 6(A) andsupplementary Fig. 2]. Twenty-five minutes <strong>of</strong> the recordingwere analyzed while the ship was in consistent 8/10’s <strong>ice</strong>cover [Fig. 6(B)]. The port and starboard screws were notoperated simultaneously in the same direction as the shipattempted to change its heading in the <strong>ice</strong> [Fig. 7(A)]. Thenon-synchronous operation <strong>of</strong> the two screws complicatedattempts to correlate rpm’s with source <strong>levels</strong> during this recording.Positive (i.e., forward) rpm movement and subsequentincreases in SOG characterize ramming. Negative (i.e.,sternward) rpm movement and subsequent increases in SOGcharacterize backing. The ship reached 6–7 kn (3.1–3.6 m/s)forward speed before progress was halted by the pack <strong>ice</strong>.Reversing the direction <strong>of</strong> the screws, the ship backed up,reaching speeds around 3 kn (1.5 m/s) before attempting tomake forward progress again. This alteration in SOG indicatesthat the ship was breaking heavy <strong>ice</strong> while making forwardprogress into the hole created by the previous ram.The modulation in SOG over the course <strong>of</strong> the recordingcorresponds with the source level time series shown in Fig.7(B). Healy’s <strong>noise</strong> signature was examined in frequencybands by orders <strong>of</strong> magnitude (i.e., centered near 10 1 ,10 2 ,10 3 , and 10 4 Hz), including one centered near 50 Hz, to see ifthe distribution <strong>of</strong> source <strong>levels</strong> was frequency dependent.For the time series centered near 10, 50, and 100 Hz, source<strong>levels</strong> increased 10 dB in several instances, correlating withnegative rpm’s <strong>of</strong> one or both <strong>of</strong> the ship’s propeller shafts.The effect is shown to a lesser extent in frequency bandscentered near 1 and 10 kHz. The highest estimated sourcelevel reached during this recording was about 195 dB re:1 lPa at 1 m, in full octave bands at 10 and 50 Hz.Another recording was made during several hours <strong>of</strong>Healy backing-and-ramming in heavy <strong>ice</strong> cover during August28–29 [Fig. 8(A)]. Thirty-five minutes were analyzed,while the ship was in 9/10’s <strong>ice</strong> cover [Fig. 8(B)]. For thespectral time series centered near 50, 100, and 1000 Hz,source <strong>levels</strong> quickly increased 10–15 dB in several instances,again correlating with rapid deceleration <strong>of</strong> the ship from forwardmovements and sternward operation <strong>of</strong> the screws (Fig.9). However, in this case, the same effect also is seen with thehigher frequency band centered near 1 kHz. The highestsource level reached during this recording was about 200 dBre: 1 lPa at 1 m, in full octave bands at 50 and 100 Hz.When the ship is engaged in backing-and-rammingmaneuvers, the largest modulation in Healy’s <strong>noise</strong> signatureresults from severe cavitation <strong>of</strong> the propellers while operatingastern. In bands centered near 10, 50, and 100 Hz, source<strong>levels</strong> were shown to increase 5–15 dB during backing-andrammingmaneuvers. Specifically, <strong>noise</strong> <strong>levels</strong> increased10–15 dB in the 50 Hz and 100 Hz bands while operatingastern propulsion as compared to operating forward propulsionwhile breaking <strong>ice</strong>.C. Dynamic positioning in full <strong>ice</strong> coverOn August 31, a recording was made during deep seadredging operations [Fig. 10(A)]. Twenty-five minutes <strong>of</strong>data were analyzed while the ship was using its bow thrusterFIG. 9. During backing-and-ramming on August 28–29: (A) vessel speedover-ground(solid) and propeller shaft rotational speed (starboard ¼ dashed;port ¼ dotted). (B) Source level estimates (dB re: 1 lPa at 1 m) centeredaround 55.6 Hz (49–62 Hz), 111 Hz (98–123 Hz), and 1.12 kHz (0.985–1.24 kHz) for 1/3 octave bands, respectively. Spectral estimates for fulloctave bands are centered around 56.6 Hz (40–80 Hz band), 113 Hz (80–160 Hz band), and 0.905 kHz (0.640–1.28 kHz band), respectively (gray sectionindicates loss <strong>of</strong> acoustic data). The ship was in consistent 9/10’s <strong>ice</strong>cover.J. Acoust. Soc. Am., Vol. 133, No. 4, April 2013 Roth et al.: Icebreaker <strong>noise</strong> in the Arctic Ocean 1977Downloaded 30 May 2013 to 132.177.103.226. Redistribution subject to ASA l<strong>ice</strong>nse or copyright; see http://asadl.org/terms
(Ross, 1976). Depending upon the operating cavitation parameter,each propeller blade produces cavitation for a shortperiod when their angles <strong>of</strong> attack are less than the nominaladvance ratio. The resultant burst <strong>of</strong> cavitation <strong>noise</strong> is brief.Because one blade invariably cavitates sooner than theothers, the bursts first occur once per revolution. As the otherblades begin cavitating, the <strong>noise</strong> bursts become more frequent,finally occurring at blade rate—the number <strong>of</strong> bladesmultiplied by the rotational frequency.Cavitation inception usually depends more on the shipwake than on the design <strong>of</strong> the propeller. For severe wakes,stall is likely to occur when the propeller blade passes behindthe stern post, or so-called “shadow zone” (Ross, 1976). Icebreakersare unique in this regard as they invariably encountera situation during backing and ramming where the ship’spropeller shafts are rotating at nearly full speed, yet the SOG<strong>of</strong> the vessel falls due to increased resistance from pack <strong>ice</strong>.At this moment, there is not only stagnant fluid flow in theshadow zone but everywhere around the propeller. The dropin dynamic pressure <strong>of</strong> flow velocity around the propellerblades causes increased cavitation inception simultaneouslyfor all the propeller blades, resulting in the highest <strong>noise</strong> <strong>levels</strong>produced by the <strong>ice</strong>breaker.Other <strong>noise</strong> sources are propulsion machinery and dieselgenerators. Diesel-electric drives—like the propulsion systemfound on Healy—employ four-stroke medium-speeddiesels that are quite noisy compared to slow-speed directdriveengines and produce multiple tones attributed to pistonslap. These four-stroke medium speed diesels can radiate asmany as 100 harmonics <strong>of</strong> their rotational frequencies (Ross,1976). This <strong>noise</strong> source usually becomes important when aship is operating at slow speeds, for example, whenFIG. 12. Source <strong>levels</strong> averagedfrom the August 27–29 recordings,together with the ship’s port andstarboard propeller shaft speeds(RPM) as (A) two-dimensional plotand (B) three-dimensional plot. Thepoint-size increases and the color <strong>of</strong>each point changes (scale bar onright) in 5 dB increments. The shipfrequently transitioned from reverseto forward motion, and the propellershaft rotation quickly changeddirection.J. Acoust. Soc. Am., Vol. 133, No. 4, April 2013 Roth et al.: Icebreaker <strong>noise</strong> in the Arctic Ocean 1979Downloaded 30 May 2013 to 132.177.103.226. Redistribution subject to ASA l<strong>ice</strong>nse or copyright; see http://asadl.org/terms
<strong>ice</strong>breakers maneuver through substantially thick, <strong>ice</strong>coveredwaters. For this reason, Healy’s engines are locatedon the main deck to reduce <strong>noise</strong> for the sonar systems.Ross (1976) has suggested that the total <strong>noise</strong> <strong>radiated</strong>by a surface ship may be estimated fromSPL ¼ 126 þ 15 logðHPÞin dB re: 1lPa at 1 m;where HP ¼ horsepower. As an example, if Healy’s maximumshaft horsepower is 30 000 HP at 130 rpm, then thesource level would be about 193 dB re: 1lPa at 1 m, which issimilar to those peak values presented here for low frequenciesduring low SOG when operating in pack <strong>ice</strong>.V. CONCLUSIONSThe presence <strong>of</strong> sea <strong>ice</strong> represents a significant obstacleto vessels operating anywhere in polar waters, and requiresspecially constructed ships and navigational skills (Brigham,2000). The thinning Arctic <strong>ice</strong> pack is allowing for longer seasons<strong>of</strong> navigation for <strong>ice</strong>breakers and other polar-class vessels.Increases in vessel traffic around the Arctic Ocean mayresult in an increase in the risk <strong>of</strong> disturbance from ship <strong>noise</strong>on migrating and foraging whales as well as other marine animals.In an effort to better predict these risks, protocols forthe measurement <strong>of</strong> <strong>radiated</strong> ship <strong>noise</strong> (ANSI, 2009) shouldbe expanded specifically to <strong>ice</strong>breakers operating in polarregions with <strong>ice</strong>-covered waters. Combined with a more thoroughunderstanding <strong>of</strong> under-<strong>ice</strong> acoustic propagation, standardmeasurements such as these will allow better management<strong>of</strong> our shared Arctic resources.ACKNOWLEDGMENTSSupport for the field program was provided by the Centerfor Coastal and Ocean Mapping/Joint Hydrographic Center(CCOM/JHC) and the U.S. Coast Guard. The authors wouldlike to thank Jon Childs <strong>of</strong> the U.S. Geological Survey forproviding funding and support for this work. We also thankLarry Mayer <strong>of</strong> CCOM/JHC, who provided field support andallowed us to conduct acoustic measurements opportunisticallyduring the HLY-0805 cruise; Philip McGillivary <strong>of</strong> theU.S. Coast Guard, who encouraged us to initiate the study;the crew <strong>of</strong> USCGC Healy, especially engineering <strong>of</strong>f<strong>ice</strong>rsLCDR Doug Petrusa and ENS Lisa Myatt, who provided engineeringdata recorded during our acoustic measurements;and Don Ross who provided valuable insight and guidance onunderwater <strong>noise</strong> <strong>research</strong>. Funding for this work has beenprovided by the U.S. Interagency Extended Continental ShelfTask Force, consisting <strong>of</strong> representatives from the Department<strong>of</strong> State, NOAA, Department <strong>of</strong> Interior (USGS, MMS), U.S.Coast Guard, National Science Foundation, and ArcticResearch Commission, among others. Neither the ExtendedContinental Task Force, nor individual agencies endorse theconclusions <strong>of</strong> this study.1 See supplementary material at http://dx.doi.org/10.1121/1.4790356 forsupplemental Figs. 1 and 2.ANSI (2009). S12.64, American National Standard, Quantities and Proceduresfor Description and Measurement <strong>of</strong> <strong>Underwater</strong> Sound from Ships.Part 1. General Requirements (Acoustical Society <strong>of</strong> America, NewYork).Arctic Council (2009). Arctic Marine Shipping Assessment 2009 Report,2nd printing (Arctic Council, Tromsï, Norway), p. 194.Arveson, P. T., and Vendittis, D. J. (2000). “Radiated <strong>noise</strong> characteristics<strong>of</strong> a modern cargo ship,” J. Acoust. Soc. Am. 107(1), 118–129.Berkson, J., and DuPree, G. (1998). “USCGC Healy: The United States’new polar <strong>research</strong> <strong>ice</strong>breaking vessel,” www.uscg.mil/history/webcutters/HealyNarrative.<strong>pdf</strong> (Last viewed January 27, 2010).Brigham, L. W. (2000). The Emerging International Polar NavigationCode: Bi-Polar Relevance? (Cambridge University Press, Cambridge,UK), p. 221–243.Cosens, S. E., and Dueck, L. P. (1993). “Icebreaker <strong>noise</strong> in LancasterSound, N.W.T., Canada: Implications for marine mammal behavior,” MarineMammal Sci. 9(3), 285–300.Etter, P. C. (2003). <strong>Underwater</strong> Acoustic Modeling and Simulation (SponPress, New York), p. 384.Jakobsson, M., Macnab, R., Mayer, L., Anderson, R., Edwards, M., Hatzky,J., Schenke, H. W., and Johnson, P. (2008). “An improved bathymetricportrayal <strong>of</strong> the Arctic Ocean: Implications for ocean modeling and geological,geophysical and oceanographic analyses,” Geophys. Res. Lett. 35,L07602.Jensen, Ø. (2007). “The IMO guidelines for ships operating in arctic <strong>ice</strong>coveredwaters: From voluntary to mandatory tool for navigation safetyand environmental protection,” FNI-rapport 2/2007 (The Fridtj<strong>of</strong> NansenInstitute, Lysaker, Norway), p. 32.Mayer, L. A., and Armstrong, A. A. (2008). USCGC Icebreaker Healy(WAGB-20) U.S. Law <strong>of</strong> the Sea Cruise to Map the Foot <strong>of</strong> the Slope and2500-m Isobath <strong>of</strong> the US Arctic Ocean Margin (Center for Coastal andOcean Mapping/Joint Hydrographic Center, University <strong>of</strong> New Hampshire,Durham. NH), p. 179.Mellinger, D. K. (2001). Ishmael 1.0 User’s Guide. NOAA Technical ReportOAR-PMEL-120 (NOAA Pacific Marine Environmental Laboratory, Seattle,WA), p. 30.Milne, A. R., and Ganton, J. H. (1964). “Ambient <strong>noise</strong> under Arctic-Sea<strong>ice</strong>,” J. Acoust. Soc. Am. 36(5), 855–863.O’Rourke, R. (2012). Coast Guard Polar Icebreaker Modernization: Backgroundand Issues for Congress (Congressional Research Serv<strong>ice</strong>, Washington,DC), p. 4–6.Ross, D. (1976). Mechanics <strong>of</strong> <strong>Underwater</strong> Noise (Pergamon, New York), p.375.Wiggins, S. M., and Hildebrand, J. A. (2007). “High-Frequency AcousticRecording Package (HARP) for broad-band, long-term marine mammalmonitoring,” in International Symposium on <strong>Underwater</strong> Technology2007 and International Workshop on Scientific Use <strong>of</strong> Submarine Cablesand Related Technologies 2007, Tokyo, Japan, Institute <strong>of</strong> Electrical andElectronics Engineers.1980 J. Acoust. Soc. Am., Vol. 133, No. 4, April 2013 Roth et al.: Icebreaker <strong>noise</strong> in the Arctic OceanDownloaded 30 May 2013 to 132.177.103.226. Redistribution subject to ASA l<strong>ice</strong>nse or copyright; see http://asadl.org/terms