Synthesis, structure and luminescence of Er3+-doped ... - UPV
Synthesis, structure and luminescence of Er3+-doped ... - UPV
Synthesis, structure and luminescence of Er3+-doped ... - UPV

You also want an ePaper? Increase the reach of your titles
YUMPU automatically turns print PDFs into web optimized ePapers that Google loves.
Journal <strong>of</strong>Materials ChemistryDynamic Article Links C
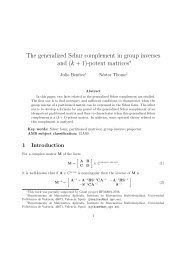
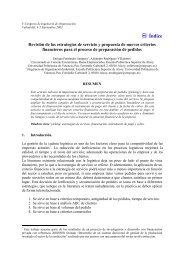
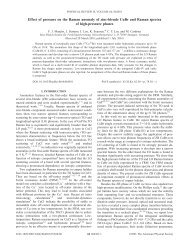
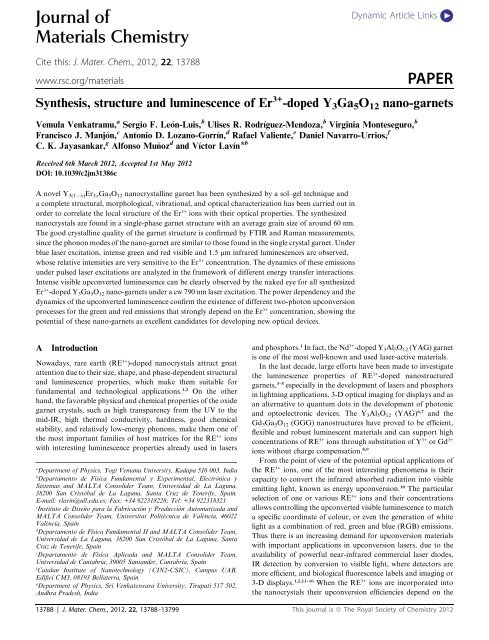
RE 3+ ion concentration, the size <strong>of</strong> the nanocrystals, the intra- orinter-particle energy transfer processes, <strong>and</strong> the rate <strong>of</strong> themultiphonon relaxation. 1,2,16 Hence, there is a need for a rigoroussearch for RE 3+ -<strong>doped</strong> hosts with low-energy phonons, highquantum efficiencies, <strong>and</strong> optimized nanocrystal size <strong>and</strong> RE 3+concentrations in order to have the most efficient <strong>luminescence</strong>properties.Among the trivalent RE 3+ ions, the erbium (Er 3+ ) ion isa versatile optically active ion for upconversion since its energylevel<strong>structure</strong> contains several metastable multiplets. 17 Further,it provides interesting laser emissions at around 1.5 mm, associatedwith the 4 I 13/2 / 4 I 15/2 transition <strong>and</strong> widely used in opticaltelecommunication <strong>and</strong> range-finding applications, <strong>and</strong> ataround 2.9 mm, associated with the 4 I 11/2 / 4 I 13/2 transition usedin medical applications. Moreover, an efficient upconversionlaser in the visible region pumped by an infrared laser diode hasbeen obtained with a higher efficiency than that achieved bysecond harmonic generation techniques due to broad pumpingmechanisms. 18–20This work presents for the first time, as far as we know, thesynthesis <strong>of</strong> Er 3+ -<strong>doped</strong> Y 3 Ga 5 O 12 (YGG) nano-garnet using aneasy citrate sol–gel method, as well as the study <strong>of</strong> the correlationbetween the nanocrystal <strong>structure</strong> <strong>and</strong> morphology <strong>and</strong> theStokes <strong>and</strong> upconverted <strong>luminescence</strong> properties. This characterizationwas carried out as a function <strong>of</strong> the concentration<strong>of</strong> the optically active ion in order to carefully control theEr 3+ <strong>luminescence</strong> in the nano-garnet.BExperimentalNanocrystalline yttrium gallium garnets <strong>of</strong> compositionY 3(1 x) Er 3x Ga 5 O 12 , with x ¼ 0.01, 0.05 <strong>and</strong> 0.1 <strong>and</strong> hereaftercalled YGG1Er, YGG5Er <strong>and</strong> YGG10Er, were successfullysynthesized by the citrate sol–gel method in an air atmosphere. 21Stoichiometric molar ratios <strong>of</strong> high-purity Ga(NO 3 ) 3 $9H 2 O,Y(NO 3 ) 3 $4H 2 O <strong>and</strong> Er(NO 3 ) 3 $5H 2 O materials were dissolved in25 ml <strong>of</strong> 1 M HNO 3 under stirring at 353 K for 3 h. Then citricacid, with a molar ratio <strong>of</strong> metal ions to citric acid <strong>of</strong> 1 : 2, wasadded to the solution, which was stirred for a further 2 h <strong>and</strong>finally dried at 363 K for 36 h. This process created a gel that wasfired at 773 K for 4 h in order to remove the residual nitrates <strong>and</strong>organic compounds <strong>and</strong> the subsequently obtained powdersample was finally calcined at 1173 K for 16 h.The HRTEM micrographs (FEI-TECNAI G2 microscope at200 kV) were used to study the morphology <strong>and</strong> the nano<strong>structure</strong><strong>of</strong> the YGG powder. The X-ray diffraction patterns<strong>of</strong> the YGG nano-garnets were measured using the CuK a1(1.5406 A) radiation in the range <strong>of</strong> 2q ¼ 10–80 , with a step size<strong>of</strong> 0.02 (PANalytical X’Pert Pro). The infrared absorptionspectrum was recorded using a FTIR spectrometer (BrukerIFS66), whereas the Raman spectrum was obtained in backscatteringgeometry (Horiba Jobin Yvon LabRAM HR UV)with resolution better than 2 cm 1 <strong>and</strong> exciting with the unfocused632.8 nm radiation <strong>of</strong> a 30 mW He–Ne laser.The visible <strong>and</strong> NIR diffuse reflectance spectrum in the rangefrom 200 to 1800 nm was measured using an integrating spherewith a Cary 6000i (Varian). The <strong>luminescence</strong>s <strong>of</strong> the Er 3+ -<strong>doped</strong>YGG nano-garnet powders were measured by exciting at 488 nmusing the laser line <strong>of</strong> an Ar + laser (2060-10 Beamlock SpectraPhysics) for the visible range or at 790 nm using a Ti:sapphirelaser (3900S Spectra Physics) pumped by the Ar + laser for theNIR range. These emissions were focused with a convergent lensonto a 0.75 m single-grating monochromator (Jobin YvonSpex750M) with a resolution <strong>of</strong> 0.1 nm <strong>and</strong> then detected eitherwith a photomultiplier tube (Hamamatsu R928) or an InGaAsdetector. Moreover, under a cw 790 nm laser excitation, the green<strong>and</strong> red upconverted <strong>luminescence</strong>s were focused with a convergentlens onto a fiber coupled 0.303 m single-grating spectrograph(Andor Shamrock SR-303i-B) <strong>and</strong> detected with a cooledCCD detector (Newton DU920N). The <strong>luminescence</strong> decaycurves <strong>and</strong> the dynamics <strong>of</strong> the upconverted emissions weremeasured by exciting the Er 3+ ions with a 10 ns pulsed opticalparametric oscillator OPO (EKSPLA/NT342/3/UVE) usinga digital storage oscilloscope (LeCroy WS424) coupled to thedetection system. All spectra were corrected for the spectralresponse <strong>of</strong> the equipment.CResults <strong>and</strong> discussionC.1 Morphological <strong>and</strong> structural propertiesThe HRTEM micrographs <strong>of</strong> the synthesized powder obtained,shown in Fig. 1, reveal that nanocrystalline powder has beenobtained in the form <strong>of</strong> agglomerated nanocrystals in differentshapes with different sizes ranging from 40 to 60 nm. The existence<strong>of</strong> aggregated particles has been ascribed to the bridging <strong>of</strong>adjacent particles through the hydrogen bonding <strong>of</strong> water <strong>and</strong>the significant capillary action generated during the dryingprocess in the precursors. 22 HRTEM images show that the latticespacing between different layers <strong>of</strong> Er 3+ -<strong>doped</strong> nanoparticles isaround 4.60 A, which corresponds to the (220) plane <strong>of</strong> the cubicphase <strong>of</strong> the YGG nano-garnets. The distance between the layerscorresponding to the (220) plane in bulk YGG is 4.34 A, which issmaller than the distance obtained for the nanocrystal. Thus,from the HRTEM pictures it can be concluded that an increase inthe lattice parameter <strong>of</strong> the nanoparticles is accompanied bya decrease in their sizes.X-ray diffraction measurements reveal well-defined Braggreflections <strong>of</strong> the nanocrystalline powder samples, indicating thatthe material under study is well-crystallized in a single phase <strong>of</strong>cubic crystalline <strong>structure</strong>, 23 without appreciable changes due tothe Er 3+ doping concentration (see Fig. 2 for the YGG1Er nanogarnet).These patterns have been indexed to the Y 3 Ga 5 O 12(YGG) garnet <strong>structure</strong> with an Ia 3d (no. 230) space group <strong>and</strong>refined by both the Le Bail <strong>and</strong> the Rietveld method 24 using theFULLPROF program. 25 The Le Bail fitting allows getting moreaccurate values <strong>of</strong> the shape <strong>and</strong> cell parameters in terms <strong>of</strong>pr<strong>of</strong>ile matching, being a reliable first step before carrying out theRietveld fitting, since it gives more accurate results for both theshape <strong>and</strong> the lattice as starting values for the refinement. TheRietveld fitting, carried out after adding the atomic positions tothe Le Bail output, has been done by the refinement <strong>of</strong> 21parameters, a pseudo-Voigt pr<strong>of</strong>ile function, <strong>and</strong> a polynomialfunction with six refinable coefficients for the background. Thecell parameters <strong>and</strong> the reliability factors for both fittings aresummarized in Table 1. The fittings are quite good <strong>and</strong> only smalldifferences have been found for the amplitudes <strong>of</strong> a few peaks, ascan be observed in Fig. 2 for the Le Bail refinement. The averageThis journal is ª The Royal Society <strong>of</strong> Chemistry 2012 J. Mater. Chem., 2012, 22, 13788–13799 | 13789
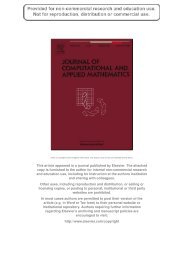
Fig. 1 High resolution transmission electron microscope (HRTEM)micrographs <strong>of</strong> the YGG nano-garnets.crystallite size has been estimated to be around 60 nm for thethree samples under study from the full width at half maximum(FWHM) <strong>of</strong> the diffraction peak at 32.71 using the Scherrerequation along with the <strong>structure</strong> <strong>of</strong> the YGG unit cell, 26 confirmingthe estimations made using the HRTEM micrographs.The YGG garnet crystal <strong>structure</strong> can be described asa network <strong>of</strong> GaO 6 octahedra <strong>and</strong> GaO 4 tetrahedra linked byshared oxygen ions at the corners <strong>of</strong> the polyhedra (see Fig. 2).These polyhedra are arranged in chains along the three crystallographicdirections <strong>and</strong> form dodecahedral cavities which areoccupied by the Y 3+ ions. Thus the YGG garnet possesses threecrystallographically distinct cation sites, 27 i.e., the Ga 3+ ions arelocated both in 24(d) tetrahedral S 4 sites <strong>and</strong> 16(a) octahedral S 6sites with fourfold <strong>and</strong> sixfold coordination, respectively, whilethe Y 3+ ions are located in a 24(c) dodecahedral D 2 site witha coordination number <strong>of</strong> 8. The O 2 ions occupy the 96(h) siteswith each one being a member <strong>of</strong> one tetrahedron, one octahedron,<strong>and</strong> two dodecahedra. Due to ionic size considerations inFig. 2 (Top) X-ray diffraction pattern (upper) <strong>and</strong> Le Bail refinement(lower) <strong>of</strong> the YGG1Er nano-garnet. The lower part <strong>of</strong> the figure showsthe difference between the observed <strong>and</strong> the calculated plots <strong>and</strong> thevertical marks are the allowed reflections for this material in the Ia 3d (no.230) space group. (Bottom) unit cell <strong>of</strong> the YGG crystal, where thespheres show the position <strong>of</strong> the Y 3+ ions occupying a D 2 point symmetrysite <strong>and</strong> the S 4 <strong>and</strong> S 6 site positions <strong>of</strong> the Ga 3+ ions.Table 1 Cell parameters <strong>and</strong> reliability factors obtained from the Le Bail<strong>and</strong> the Rietveld refinementsa ( A) V ( A 3 ) c 2 R p R wp R expLe Bail fitting12.2833(3) 1853.296 5.00 7.87 10.3 4.62Rietveld fitting12.2816(5) 1852.528 14.5 13.0 17.8 4.69the YGG lattice, the RE 3+ ions are expected to predominantlyenter into the distorted dodecahedral sites by replacing the Y 3+ions <strong>and</strong> to be coordinated to eight O 2 ions. 28The vibrational modes <strong>of</strong> the different polyhedra <strong>of</strong> YGG canbe studied by FTIR <strong>and</strong> Raman spectroscopy. 29 The FTIRspectrum <strong>of</strong> the YGG nano-garnet powder, shown in Fig. 3,13790 | J. Mater. Chem., 2012, 22, 13788–13799 This journal is ª The Royal Society <strong>of</strong> Chemistry 2012
Fig. 3FTIR <strong>and</strong> Raman spectra <strong>of</strong> the YGG nano-garnets.consists <strong>of</strong> two main b<strong>and</strong>s with superimposed peaks whoseenergies range from 520 to 1100 cm 1 , in addition to differentbroad peaks at higher energies. The peaks with maxima ataround 590, 620, 640, 685 <strong>and</strong> 840 cm 1 correspond to theformation <strong>of</strong> the nanocrystalline YGG <strong>and</strong> are assigned tothe characteristic metal–oxygen stretching vibrational modes <strong>of</strong>the GaO 4 tetrahedra in the garnet <strong>structure</strong>. 23,30The Raman spectrum <strong>of</strong> the YGG nano-garnets has beenmeasured in the 100–2500 cm 1 range <strong>and</strong> the observed modesare summarized in Table 2. The primitive cell <strong>of</strong> a garnet latticecontains four formula units (80 atoms) 31 in which, from a factorgroup analysis, there are 25 Raman-active modes that can beclassified as 3 A 1g ,8E g <strong>and</strong> 14 T 2g modes. 32 It is worth notingthat out <strong>of</strong> 25 predicted Raman-active modes, 17 <strong>of</strong> them areexperimentally observed for nanocrystalline YGG <strong>and</strong> arecompared with vibrational modes <strong>of</strong> YGG single crystals 29 (seeTable 2). A quite good agreement is observed between thevibrational modes <strong>of</strong> the nano-YGG <strong>and</strong> the YGG single-crystal<strong>and</strong>, in general, only slight shifts in frequency have been foundbetween the Raman modes <strong>of</strong> nanocrystals <strong>and</strong> those <strong>of</strong> the bulkTable 2 Comparison <strong>of</strong> the energies <strong>of</strong> the experimental Raman vibrationalmodes (in cm 1 ) <strong>of</strong> the YGG nano-garnets <strong>and</strong> single crystalVibrational phononmodeYGG nano-garnet(present work)YGG singlecrystal (ref. 29)T 2g 119 119 (theory)E g 133 134T 2g 151 155 (theory)T 2g 175 176T 2g 187 180T 2g 243 243T 2g 272 274E g 286 287E g 300 324A 1g 357 356T 2g 393 392E g 411 412T 2g 420 432A 1g 528 529T 2g 594 596T 2g 612 611E g — 635T 2g 752 754material, <strong>and</strong> these are within the accuracy limits <strong>of</strong> themeasurements.The Raman spectrum <strong>of</strong> garnets has been interpreted on thebasis <strong>of</strong> the vibrational modes <strong>of</strong> the tetrahedral GaO 4 <strong>and</strong>octahedral GaO 6 units, considering that the vibrations <strong>of</strong> thedifferent polyhedra are strongly coupled to each other. 33,34 Whilethe assignment <strong>of</strong> the different Raman modes to the differentvibrations in terms <strong>of</strong> eigenmodes is very clear in the Y 3 Al 5 O 12(YAG) crystal, 35 the same situation is not so evident in theY 3 Ga 5 O 12 (YGG) crystal. 29 The Raman spectrum <strong>of</strong> YGGcan be divided into two main regions: the low-frequency region(100–340 cm 1 ) <strong>and</strong> the high-frequency region (340–800 cm 1 ).Starting with the latter <strong>and</strong> according to Saine et al. (1982), 34 theb<strong>and</strong>s comprised in the 340–450 cm 1 <strong>and</strong> the 580–700 cm 1ranges can be attributed to the antisymmetric stretching modes<strong>of</strong> the GaO 6 <strong>and</strong> GaO 4 polyhedra, respectively. However, theb<strong>and</strong> at 360 cm 1 can be assigned to the symmetric stretchingmode <strong>of</strong> the GaO 4 tetrahedron coupled with a rotational modeinvolving the whole tetrahedron. Finally, the b<strong>and</strong> observed ataround 760 cm 1 is mainly due to the symmetric stretching mode<strong>of</strong> the GaO 4 tetrahedron, even if a weaker contribution due to theantisymmetric stretching mode <strong>of</strong> the same polyhedron could bepresent. 34The b<strong>and</strong>s in the low energy region are mainly due to theO–Ga–O bending modes <strong>of</strong> the Ga-related polyhedra <strong>and</strong> tolattice modes related to the movements <strong>of</strong> the Ga-related polyhedraagainst the Y 3+ ions, which can also be considered asstretching or bending modes <strong>of</strong> the YO 8 dodecahedra. In thissense, it is important to note that the stretching <strong>and</strong> bendingforces <strong>of</strong> Y 3+ ions in YO 8 dodecahedra are considerably smallerthan those <strong>of</strong> GaO 4 tetrahedra <strong>and</strong> similar to those <strong>of</strong> GaO 6octahedra in garnets. 29 In particular, the two lowest-energy E gphonons at 133 <strong>and</strong> 286 cm 1 have frequencies that exhibita strong dependence on the lattice parameter <strong>and</strong> correspondinglyon the RE 3+ mass, being the smallest in frequency attributedto the translation <strong>of</strong> YO 8 units. On the other h<strong>and</strong>, the T 2gmodes at 187 <strong>and</strong> 272 cm 1 have been shown to be almostvolume-independent <strong>and</strong> this behavior could be related tocanceling contributions due to the intermixing <strong>of</strong> octahedral <strong>and</strong>dodecahedral molecular modes. 29 Therefore, all these lowfrequencyE g <strong>and</strong> T 2g modes could yield important informationregarding the occupation <strong>of</strong> the dodecahedral sites by the Er 3+ions. In fact, since this is a low-energy phonon site, the multiphononrelaxation probabilities in the YGG nano-garnets maybe considered one <strong>of</strong> the lowest found in oxide matrices, <strong>and</strong>could yield high quantum efficiencies for the emitting levels <strong>of</strong>the Er 3+ ions.Despite the measured FTIR <strong>and</strong> Raman spectra confirmingthe good crystalline quality <strong>of</strong> these nanocrystals <strong>of</strong> garnet<strong>structure</strong>, there are a few Raman <strong>and</strong> IR peaks above 1100 cm 1whose explanation is not easy, although it is accepted that theirpresence is related to the anions attached to the nano-garnetcrystal surface during the synthesis process. In principle, thepresence <strong>of</strong> these anionic groups on the nanoparticles surface ispotentially undesirable since they may act as quenching traps,diminishing the <strong>luminescence</strong> <strong>and</strong> lifetimes <strong>of</strong> the RE 3+ emittinglevels. The peak at around 1500 cm 1 2could be assigned to CO 3carbonate groups, while the b<strong>and</strong>s in the range from 2000 to2350 cm 1 could arise from the carbon dioxide in air. Finally,This journal is ª The Royal Society <strong>of</strong> Chemistry 2012 J. Mater. Chem., 2012, 22, 13788–13799 | 13791
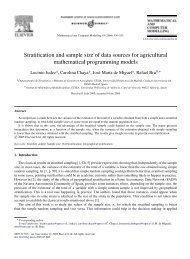
another b<strong>and</strong> at around 3550 cm 1 (not shown) is associated withthe OH anionic groups arising from the water adsorbed duringthe exposure <strong>of</strong> dried powder to air. The presence <strong>of</strong> high energyvibrations may indicate that the heat treatment was not enoughto remove either the carbonate or the hydroxyl ions from thenanocrystal surface, since these b<strong>and</strong>s have been shown todisappear after synthesis at a higher temperature. 23C.2 Absorption <strong>and</strong> <strong>luminescence</strong>For optical applications special interest is devoted to the analysis<strong>of</strong> the local <strong>structure</strong> around the RE 3+ ions in the matrix, since itrules the fine <strong>structure</strong> splitting <strong>of</strong> the free-ion multiplets <strong>and</strong> theforced intra-configurational 4f–4f electric-dipole transitionprobabilities in the visible range. The optical properties <strong>of</strong> theRE 3+ ions <strong>and</strong>, therefore, their interest for optical applicationsdepend on the final environment <strong>of</strong> these ions. 36As already mentioned, the Er 3+ ions will predominantlyenter the distorted dodecahedral sites by replacing the Y 3+ ions.Thus the eight oxygen lig<strong>and</strong>s surrounding the optically activeEr 3+ ion create a local environment with orthorhombic D 2point symmetry. As a consequence, the D 2 crystal-field interactionfelt by the optically active ion will completely remove thedegeneracy <strong>of</strong> the 2S+1 L J multiplets <strong>of</strong> the free-Er 3+ ion, giving riseto (2J + 1)/2 Stark, or crystal-field, levels labeled according to theirreducible representations obtained from group theory. 36The room temperature (RT) diffuse reflectance spectrum <strong>of</strong>the YGG5Er nano-garnet in the UV-visible-NIR range is givenin Fig. 4. The peaks observed correspond to intra-configurational4f 11 –4f 11 electronic transitions starting from the 4 I 15/2ground state to the different excited levels <strong>of</strong> the Er 3+ ion. All thetransitions are assumed to be electric dipole in nature, except forthat to the 4 I 13/2 first excited state that shows a magnetic dipolecontribution. 37 The labels <strong>of</strong> the different transitions <strong>of</strong> the Er 3+ion in the YGG nano-garnet have been assigned according to thewell-known Dieke’s diagram for this ion in the LaCl 3 crystal 38<strong>and</strong> the energies <strong>of</strong> the Stark levels <strong>of</strong> Er 3+ in a YGG singlecrystal summarized by Morrison <strong>and</strong> Leavitt. 39 A partial energylevel diagram <strong>of</strong> the Er 3+ ion in the YGG nano-garnet is given inFig. 5. The sharp peak pr<strong>of</strong>iles found for all the electronicFig. 4 Diffuse reflectance spectrum <strong>of</strong> the YGG5Er nano-garnet powderin the UV-visible-NIR range at RT. All transitions start from the 4 I 15/2ground state to the indicated levels.Fig. 5 Partial energy level diagram <strong>of</strong> the Er 3+ ion showing differentradiative transitions (downward solid lines) related to the <strong>luminescence</strong>after a 4 I 15/2 / 4 F 7/2 ground state absorption (GSA) under a direct laserexcitation at 488 nm. The multiphonon (zig-zag lines) <strong>and</strong> energy transfer(dashed lines) non-radiative relaxation processes are also shown.transitions confirms that the Er 3+ ions are incorporated in thenanocrystalline <strong>structure</strong> <strong>of</strong> the garnet. From these data, <strong>and</strong> theemission b<strong>and</strong>s presented later, it can be stated that theabsorption transitions at RT start mainly from the four Starklevels <strong>of</strong> the 4 I 15/2 ground state with lowest energies, which areseparated around 350 cm 1 from the Stark levels with higherenergies. The intense b<strong>and</strong> at around 240 nm, strongly overlappedwith the absorbance <strong>of</strong> the YGG matrix, can be assignedto the Er 3+ –O 2 charge transfer state, although different4f 11 / 4f 10 5d inter-configurational transition b<strong>and</strong>s <strong>of</strong> theEr 3+ ion have also been observed in this range. 40When the Er 3+ ions are resonantly excited to the 4 F 7/2 level witha cw 488 nm blue laser radiation, the luminescent 2 H 11/2 <strong>and</strong> 4 S 3/2thermalized levels are immediately populated through nonradiativemultiphonon relaxation processes <strong>and</strong> green, red, <strong>and</strong>NIR <strong>luminescence</strong> are measured (see Fig. 6). However, theseemissions not only start from the 2 H 11/2 <strong>and</strong> 4 S 3/2 thermalizedlevels but also from the 4 F 9/2 , 4 I 11/2 , <strong>and</strong> 4 I 13/2 multiplets populatedthrough different non-radiative de-excitations. The onlynon-emitting level is the 4 I 9/2 one, from which the expectedemissions at around 800 <strong>and</strong> 1700 nm are not observed, evenunder a direct excitation <strong>of</strong> the Er 3+ ions to this level. Theemission b<strong>and</strong>s are assigned in Fig. 6 <strong>and</strong> their sharp peakpr<strong>of</strong>iles further confirm that the Er 3+ ions are incorporated inthe YGG nano-crystals. Similar observations are found forEr 3+ -<strong>doped</strong> Lu 3 Ga 5 O 12 (LuGG) 3 <strong>and</strong> Gd 3 Ga 5 O 12 (GGG)nanocrystals 5 <strong>and</strong> single crystals. 41Of special interest are the emission b<strong>and</strong>s from the 4 I 13/2multiplet at around 1.5 mm shown in Fig. 6. The peak positions<strong>and</strong> spectral pr<strong>of</strong>iles <strong>of</strong> these b<strong>and</strong>s are similar to those in theabsorption spectrum, although their relative intensities strongly13792 | J. Mater. Chem., 2012, 22, 13788–13799 This journal is ª The Royal Society <strong>of</strong> Chemistry 2012
In order to check the existence <strong>of</strong> these energy transfer channelsin the YGG nano-garnets, the lifetimes <strong>of</strong> the emitting levelswere measured for the YGG1Er, YGG5Er <strong>and</strong> YGG10Er nanogarnets<strong>and</strong> are reported in Fig. 7. It is known that at very lowconcentrations <strong>of</strong> the optically active ions, for which the interactionsbetween them are negligible, the decay <strong>of</strong> the <strong>luminescence</strong>can be described by a single exponential. However, athigher concentrations the active ions are closer to each other <strong>and</strong>the energy transfer processes become more efficient, causinga non-exponential decay. 42 For this reason, an effective lifetime(s eff ) can be evaluated by using the following equation 3,5ðt$IðtÞ$dts eff ¼ ð(1)IðtÞ$dtthat for the samples with higher Er 3+ concentrations probabilities,in the presence <strong>of</strong> energy transfer processes, can be expressed as1¼ 1 þ W ET (2)s eff s 0where W ET is the energy transfer probability <strong>and</strong> s 0 is theintrinsic lifetime <strong>of</strong> the thermalized levels, involving radiative<strong>and</strong> non-radiative multiphonon de-excitation probabilities, <strong>and</strong>Fig. 6 (Top) Luminescence spectra <strong>of</strong> the YGG1Er <strong>and</strong> YGG10Er(overimposed) nano-garnets in the visible-NIR range at RT. The spectraare normalized to the intensity <strong>of</strong> the 2 H 11/2 , 4 S 3/2 / 4 I 15/2 green emission.(Bottom) 1.5 mm 4 I 13/2 / 4 I 15/2 NIR <strong>luminescence</strong> <strong>of</strong> the YGG1Er nanogarnet.The different b<strong>and</strong>s are correlated to transitions between the 4 I 13/2<strong>and</strong> 4 I 15/2 Stark levels. The degeneracies <strong>of</strong> the ground <strong>and</strong> the first excitedmultiplets are given in parenthesis. The inset figure shows the relativeintensities <strong>of</strong> the 4 I 13/2 / 4 I 15/2 emission <strong>and</strong> the lifetime <strong>of</strong> the 4 I 13/2 levelas a function <strong>of</strong> the Er 3+ concentration.differ. The fact that the ground <strong>and</strong> the first excited multiplets <strong>of</strong>the Er 3+ ion in the garnet crystal show a particular Stark splittingwith two groups <strong>of</strong> levels separated by a few hundred cm 1 giverise to four b<strong>and</strong>s with a rich <strong>structure</strong> <strong>of</strong> peaks between thedifferent Stark levels. The identification <strong>of</strong> these b<strong>and</strong>s is given inFig. 6.The dependence <strong>of</strong> the <strong>luminescence</strong> with the Er 3+ concentrationfor the 4 F 9/2 , 4 I 11/2 <strong>and</strong> 4 I 13/2 emitting levels are clearlyobserved around 660, 975 <strong>and</strong> 1500 nm, <strong>and</strong> the emissionsstarting from the first two levels in the YGG10Er nano-garnetare included in red in Fig. 6 for comparison. The relative intensity<strong>of</strong> the weak 4 F 9/2 / 4 I 15/2 red emission between 645 <strong>and</strong>680 nm compared to the green one increases by a factor <strong>of</strong>around 4.5 when the concentration <strong>of</strong> Er 3+ ions increases from1 to 10 mol%. This factor is around 11 for the 4 I 11/2 / 4 I 15/2 NIRemission at 975 nm <strong>and</strong> 7.5 for the 4 I 13/2 / 4 I 15/2 NIR emission at1.5 mm, as shown in the inset <strong>of</strong> Fig. 6. The enhancement <strong>of</strong> theseemissions with the increase <strong>of</strong> the Er 3+ ion concentration can beascribed to different cross-relaxation processes involving theground state <strong>and</strong> the emitting levels.Fig. 7 Er 3+ <strong>luminescence</strong> decay curves <strong>of</strong> the (top) green, red <strong>and</strong>(bottom) NIR emissions in YGG1Er, YGG5Er <strong>and</strong> YGG10Er nanogarnetsat RT under resonant laser excitations.This journal is ª The Royal Society <strong>of</strong> Chemistry 2012 J. Mater. Chem., 2012, 22, 13788–13799 | 13793
can be measured if the concentration <strong>of</strong> Er 3+ ions is low enoughto neglect ion–ion interaction <strong>and</strong>, therefore, the energy transferprobabilities.Two different temporal regimes can be observed in the YGGnano-garnets according to the order <strong>of</strong> magnitude <strong>of</strong> the lifetimes<strong>of</strong> the four emitting levels <strong>of</strong> the Er 3+ ions. On one h<strong>and</strong>, thosefrom the 2 H 11/2 , 4 S 3/2 , <strong>and</strong> the 4 F 9/2 levels with typical lifetimes <strong>of</strong>the order <strong>of</strong> tens <strong>of</strong> microseconds <strong>and</strong>, on the other h<strong>and</strong>, those<strong>of</strong> the 4 I 11/2 <strong>and</strong> 4 I 13/2 metastable levels with longer lifetimes <strong>of</strong>hundreds or thous<strong>and</strong>s <strong>of</strong> microseconds. Moreover, differentdynamics are found for each emitting level.Under resonant laser excitation at 525 nm, the s eff at RT <strong>of</strong> the2H 11/2 <strong>and</strong> 4 S 3/2 thermalized levels is found to be around 100, 45,<strong>and</strong> 10 ms for the YGG1Er, YGG5Er, <strong>and</strong> YGG10Er nanogarnets,respectively (see Fig. 7). The green <strong>luminescence</strong> decaycurve for the lowest Er 3+ concentration is quasi-exponential,indicating a homogeneous distribution <strong>and</strong> therefore an Er 3+ –Er 3+ distance large enough to, in a first approximation, neglectthe energy transfer processes. Its effective value <strong>of</strong> around 100 msis lower than the 125 ms found in Er 3+ -<strong>doped</strong> GGG nanocrystalswith the same concentration, 5 probably due to differences in themultiphonon probabilities for both matrices <strong>and</strong> indicatinga slightly higher radiative transition probability <strong>of</strong> the Er 3+ ion inthe YGG nano-garnet. At higher Er 3+ concentrations, theobserved non-exponential nature <strong>of</strong> the <strong>luminescence</strong> decays isaccompanied by a shortening <strong>of</strong> the lifetime that is related toenergy transfer processes between Er 3+ ions <strong>and</strong>/or to differentquenching traps (impurities <strong>and</strong>/or defective sites). 4 The resonantcross-relaxation channels that depopulate these thermalizedlevels are the ( 4 S 3/2 , 4 I 15/2 / 4 I 13/2 , 4 I 9/2 ) <strong>and</strong> ( 4 S 3/2 , 4 I 15/2 / 4 I 9/2 ,4I 13/2 ) cross-relaxation channels, labeled as I <strong>and</strong> II in Fig. 5. Thefirst channel involves two nearby interacting Er 3+ ions, oneexcited at the 4 S 3/2 emitting level <strong>and</strong> the other one at the 4 I 15/2ground state. The first Er 3+ ion (the donor <strong>of</strong> energy) de-excitatesto the 4 I 13/2 first excited multiplet <strong>and</strong> transfers non-radiativelythe energy <strong>of</strong> the transition to the other Er 3+ ion (the acceptor <strong>of</strong>energy) that promotes from the 4 I 15/2 ground state to the 4 I 9/2level. The second channel takes place between different levels,but the point is that both channels finally feed the 4 I 11/2 level,after a fast non-radiative relaxation from the 4 I 9/2 level <strong>and</strong> the4I 13/2 lowest emitting level, which further increases their<strong>luminescence</strong>.Assuming the intrinsic lifetime s 0 is equal to the effectivelifetime measured for the YGG1Er sample, i.e. considering thatthe energy transfer probability can be ignored, the Er 3+ –Er 3+ rate<strong>of</strong> energy transfer W ET <strong>of</strong> the green emitting levels can be estimatedfor the higher Er 3+ concentrations using eqn (2). W ET ¼12 200 s 1 for the YGG5Er <strong>and</strong> W ET ¼ 90 000 s 1 for theYGG10Er nano-garnets, which are comparable or much higherthan the intrinsic (radiative plus multiphonon) probability <strong>of</strong>10 000 s 1 obtained for the 2 H 11/2 <strong>and</strong> 4 S 3/2 thermalized levels <strong>of</strong>the Er 3+ ions. This rough estimation allows the conclusion thatthe energy transfer probability starts to be quite important in thequenching <strong>of</strong> the green <strong>luminescence</strong> for concentrations <strong>of</strong>around 5 mol% <strong>of</strong> Er 3+ ions. The competition between thespontaneous radiative de-excitation <strong>and</strong> the cross-relaxationprocesses gives rise to an effective decrease in the <strong>luminescence</strong> <strong>of</strong>the 2 H 11/2 <strong>and</strong> 4 S 3/2 thermalized levels that, analyzing the areaunder the <strong>luminescence</strong> decay curves, can be estimated to bearound 65% for the YGG5Er, reaching around 90% for theYGG10Er nano-garnet.On the other h<strong>and</strong>, the <strong>luminescence</strong> decay curves <strong>of</strong> the 4 F 9/2level for the three samples are quasi-exponential, as shown in theinset <strong>of</strong> Fig. 7 for the low-<strong>doped</strong> sample, <strong>and</strong> have a similardynamics that gives the same effective lifetime <strong>of</strong> around 9.6 msfor all the Er 3+ concentrations studied. This result is quitesurprising <strong>and</strong> indicates that no efficient energy transfer processinvolves any Er 3+ ion in this level; i.e., no resonant or quasiresonantcross-relaxation channels exist involving the Er 3+ ionsin the 4 F 9/2 multiplet <strong>and</strong>, hence, no quenching <strong>of</strong> the red <strong>luminescence</strong>is observed in the YGG nano-garnets. On the contrary,the quenching <strong>of</strong> the <strong>luminescence</strong> from the 4 I 9/2 is rather efficient,since no <strong>luminescence</strong> was measured even at low Er 3+concentrations. This behavior can be associated with low radiativeprobabilities, high multiphonon relaxation probabilities<strong>and</strong> the existence <strong>of</strong> different cross-relaxation channels, beingthe resonant ones, namely the ( 4 I 9/2 , 4I 9/2 / 4 I 13/2 , 4S 3/2 ),( 4 I 9/2 , 4 I 11/2 / 4 I 13/2 , 4 F 9/2 ) <strong>and</strong> ( 4 I 9/2 , 4 I 9/2 / 4 I 11/2 , 4 F 9/2 ) channelslabeled as III, IV <strong>and</strong> V in Fig. 5.The <strong>luminescence</strong> decay curve <strong>of</strong> the 4 I 11/2 / 4 I 15/2 emissionobtained under a 970 nm resonant laser excitation is particularlyinteresting since it shows a non-exponential character even forthe lowest Er 3+ concentration. Thus the energy transfer processesare also rather efficient for Er 3+ ions in this level, due to the( 4 I 11/2 , 4 I 11/2 / 4 I 15/2 , 2 H 11/2 ) <strong>and</strong> ( 4 I 11/2 , 4 I 13/2 / 4 F 9/2 , 4 I 15/2 )resonant cross-relaxation channels, labeled as VI <strong>and</strong> VIII inFig. 5, <strong>and</strong>, most probably, to quenching traps.The <strong>luminescence</strong> decay curves <strong>of</strong> the 4 I 13/2 / 4 I 15/2 transitionfor all the Er 3+ ion concentrations are single exponential, pointingto diffusion mechanisms <strong>of</strong> energy transfer. 43,44 From thedecay curves, lifetimes <strong>of</strong> the 4 I 13/2 level have been determinedby single exponential fits <strong>and</strong> found to be around 5.75, 3.25 <strong>and</strong>1.85 ms for the YGG1Er, YGG5Er <strong>and</strong> YGG10Er nano-garnets,respectively. The variation <strong>of</strong> the lifetime <strong>of</strong> 4 I 13/2 level with theEr 3+ concentration is shown in the inset <strong>of</strong> Fig. 6, where it isobserved that the lifetimes are decreasing monotonically with theincrease <strong>of</strong> the Er 3+ ion concentration. This effect can be associatedeither with the ( 4 I 13/2 , 4 I 13/2 / 4 I 15/2 , 4 I 9/2 ) resonant crossrelaxationchannel, labeled as VII in Fig. 5, or, most probably,with energy transfer from Er 3+ ions to the quenching traps.C.3 IR-to-visible energy frequency upconversionThe phenomenon <strong>of</strong> energy upconversion in RE 3+ -<strong>doped</strong>matrices involves different mechanisms that, after the absorption<strong>of</strong> low-energy photons, give rise to an emission <strong>of</strong> higher energyphotons. It is a two-step or multi-step non-radiative process inwhich the main feature is the existence <strong>of</strong> at least one metastableintermediate state, which acts as a reservoir for the opticallyactive ions, <strong>and</strong> at least one excited level at higher energy fromwhich the RE 3+ ions finally return to the ground state afteremitting photons. The RE 3+ ions have shown an importantcapability to obtain upconverted <strong>luminescence</strong> in many matrices,including oxide <strong>and</strong> fluoride ones, with important applications inoptical devices such as upconverted visible laser, optical amplifiersor white light displays. 10Two possible mechanisms can be responsible for the population<strong>of</strong> the excited emitting level: the excited state absorption13794 | J. Mater. Chem., 2012, 22, 13788–13799 This journal is ª The Royal Society <strong>of</strong> Chemistry 2012
(ESA) <strong>and</strong> the energy transfer upconversion (ETU). The formerinvolves only one optically active ion successively promoted tothe upper levels by the resonant absorption <strong>of</strong> two or more laserphotons, whereas the latter is a many-body mechanism involvingtwo or more nearby interacting optically active ions. Bothmechanisms are not mutually exclusive <strong>and</strong> can coexist toeffectively contribute to the population <strong>of</strong> the excited emittinglevel, although usually one <strong>of</strong> them dominates the upconversionprocess. 2,14,45The IR-to-visible upconversion <strong>luminescence</strong> has beenmeasured at RT by exciting the YGG1Er, YGG5Er <strong>and</strong>YGG10Er nano-garnets under 790 nm cw laser excitation in thesame experimental conditions. As usual in these kinds <strong>of</strong> nonlinearoptical phenomena, the obtained high-energy visibleemissions are visible to the naked eye. The emissions observedafter exciting with a laser pump power <strong>of</strong> around 770 mW, <strong>and</strong>presented in Fig. 8, consist <strong>of</strong> two distinct b<strong>and</strong>s, the first onewith peaks ranging from 515 to 570 nm gives green light <strong>and</strong> isascribed to the ( 2 H 11/2 , 4 S 3/2 ) / 4 I 15/2 transitions, whereas thesecond one shows red emission peaks between 645 <strong>and</strong> 680 nmassociated with the 4 F 9/2 / 4 I 15/2 transition. The upconversionspectra <strong>of</strong> the YGGEr nano-garnets are similar to those <strong>of</strong> theLuGG <strong>and</strong> GGG garnets <strong>doped</strong> with similar Er 3+ ionconcentrations. 3,5Fig. 8 NIR to green <strong>and</strong> red upconverted <strong>luminescence</strong> <strong>of</strong> the Er 3+ ionsin YGG1Er, YGG5Er <strong>and</strong> YGG10Er nano-garnets after a 790 nm cwlaser excitation resonantly with the 4 I 15/2 / 4 I 9/2 transition at RT fora pump power <strong>of</strong> 770 mW.It is worth noting that the main feature observed whencomparing the upconverted <strong>luminescence</strong>s for the three nanogarnetsunder study is that the relative intensities <strong>of</strong> the green <strong>and</strong>red upconverted emissions strongly depend on the Er 3+ concentration,as can be observed in Fig. 8. This feature opens thepossibility <strong>of</strong> a tunability <strong>of</strong> the upconverted <strong>luminescence</strong> thatcan be exploited in different optical devices.The green-to-red intensity ratio obtained for the YGG1Er isaround 10, quite similar to that obtained under blue laser excitation.However, this ratio decreases almost to 3 for the YGG5Ernano-garnet, slightly but significantly smaller than in the Stokesexperiments, <strong>and</strong> it dramatically falls to around 0.4 for theYGG10Er with the highest doping concentration <strong>of</strong> Er 3+ ions,which is a factor 5 times smaller when exciting with the blue laserrather than with the IR laser. These differences are due to thenon-linear character <strong>of</strong> the upconversion processes <strong>and</strong> thepresence <strong>of</strong> new <strong>and</strong> concentration-dependent mechanisms thatpopulate the 4 F 9/2 red emitting level more efficiently, as will beshown later.A first step in the analysis <strong>of</strong> the mechanisms involved in theIR-to-visible upconversion process is the measurement <strong>of</strong> thedependence <strong>of</strong> the upconverted emission intensities on the IRlaser pump power for the three nano-garnets under study. It isknown that the upconversion intensity I UC will be proportionalto a power n <strong>of</strong> the IR excitation intensity I IR ; i.e., I UC f (I IR ) n ,where n is the number <strong>of</strong> IR photons absorbed per visible photonemitted. 46 The evaluated values for n are 2.05, 1.69, <strong>and</strong> 1.57 forgreen emissions <strong>and</strong> 1.92, 1.65 <strong>and</strong> 1.46 for red emissions for theYGG1Er, YGG5Er <strong>and</strong> YGG10Er nano-garnets, respectively(see Fig. 9). The nearly quadratic dependency observed for all theintensities with the laser pump power indicates that two quanta<strong>of</strong> energy equivalent to two 790 nm IR photons are involved inthe population <strong>of</strong> the 2 H 11/2 , 4 S 3/2 , <strong>and</strong> 4 F 9/2 emitting levels, byeither a two-photon ESA or by two-Er 3+ ETU mechanisms.Although a strictly quadratic dependence may be expected, anexperimentally observed decrease in the slopes <strong>of</strong> the upconvertedemission intensities versus pump power may occur,reaching a linear dependency in the limit <strong>of</strong> infinitely largeupconversion rates. 46An easy way to distinguish which is the main mechanismresponsible for the upconversion processes is through themeasurement <strong>of</strong> the dynamics <strong>of</strong> the upconversion <strong>luminescence</strong>after a 790 nm laser pulsed excitation, <strong>and</strong> their comparison withthe temporal evolution <strong>of</strong> the Stokes emission exciting resonantlyat each level. For this purpose the temporal evolution <strong>of</strong> greenupconverted emissions has been measured for all Er 3+ -<strong>doped</strong>nano-garnets, exciting with a 790 nm pulsed OPO laser, <strong>and</strong> isshown in Fig. 10 (black curves). The curves <strong>of</strong> all nano-garnetshave been compared with the <strong>luminescence</strong> decay curves (seegreen curves in Fig. 10) obtained under blue laser excitation, withan energy resonant with the 4 I 15/2 / 4 F 7/2 transition, after whichthe Er 3+ ions immediately relax to the green emitting thermalizedlevels. Different dynamics are observed for the three nanogarnetsstudied, indicating different degrees <strong>of</strong> mixing betweenthe ESA <strong>and</strong> ETU mechanisms depending on the Er 3+concentrations.As already mentioned, the ESA <strong>and</strong> ETU mechanisms maycoexist to effectively contribute to the population <strong>of</strong> the excitedemitting level, although usually one <strong>of</strong> them dominates theThis journal is ª The Royal Society <strong>of</strong> Chemistry 2012 J. Mater. Chem., 2012, 22, 13788–13799 | 13795
Fig. 9 Dependence <strong>of</strong> the green (closed symbol) <strong>and</strong> the red (opensymbol) upconverted emission intensities <strong>of</strong> the Er 3+ ions in YGG1Er,YGG5Er <strong>and</strong> YGG10Er nano-garnets with the laser pump power at RT.Fig. 10 Temporal evolution <strong>of</strong> the green upconverted <strong>luminescence</strong> <strong>of</strong>the Er 3+ ions in YGG1Er, YGG5Er <strong>and</strong> YGG10Er nano-garnets aftera 790 nm laser pulsed excitation. The <strong>luminescence</strong> decay curves <strong>of</strong> thegreen emission under direct excitation <strong>of</strong> the 2 H 11/2 <strong>and</strong> 4 S 3/2 multiplets at525 nm are also included for comparison.upconversion process. In the case <strong>of</strong> ESA, when the nano-garnetis excited with the 790 nm laser pulse, the Er 3+ ions in the groundstate reach the intermediate 4 I 9/2 level through a ground stateabsorption (GSA) process <strong>and</strong>, during the same laser pulse,absorb a second IR photon to promote to the high energy levels,a mechanism labelled as ESA1 in Fig. 11. However, since 4 I 9/2cannot be considered a metastable level, it is more probable thatthe Er 3+ ions immediately relax non-radiatively to the 4 I 11/2 <strong>and</strong>the 4 I 13/2 levels, typically in the femtosecond range, beforeabsorbing the second laser photon. In this process they follow theresonant channels labelled as ESA2 <strong>and</strong> ESA3, to reach the 4 F 3/2<strong>and</strong> the 2 H 11/2 levels, respectively, which finally result in population<strong>of</strong> both 2 H 11/2 <strong>and</strong> 4 S 3/2 thermalized green emitting levels.Of these two excited state absorption mechanisms, ESA3 is moreprobable due to the longer lifetime <strong>of</strong> the 4 I 13/2 level, although theefficiency <strong>of</strong> the ESA mechanism lies also in the resonance <strong>of</strong> theabsorption processes, one from the ground state to the intermediatelevel <strong>and</strong> a second one from this level to the emitting one.In any <strong>of</strong> these cases, <strong>and</strong> as a fingerprint <strong>of</strong> this mechanism, thetemporal evolution <strong>of</strong> the green upconverted emission from theemitting level, <strong>and</strong> hence its lifetime, after the laser pulsefollowing an ESA mechanism should be exactly the same as thatobtained by exciting this level resonantly through a pure groundstate absorption (GSA).On the other h<strong>and</strong>, if the ETU mechanism dominates theupconversion process, one or different energy transfer processescould take place between nearby Er 3+ ions in the ground <strong>and</strong>in the intermediate 4 I 11/2 <strong>and</strong> 4 I 13/2 states. The most resonantFig. 11 Partial energy level <strong>structure</strong> <strong>of</strong> Er 3+ ions showing the differentradiative (downward solid lines), multiphonon (zig-zag lines), excitedstate absorption (ESA, upward solid lines) <strong>and</strong> energy transfer (romannumbers) processes related to the green <strong>and</strong> red upconverted emissionsunder a 790 nm laser excitation.13796 | J. Mater. Chem., 2012, 22, 13788–13799 This journal is ª The Royal Society <strong>of</strong> Chemistry 2012
cross-relaxation channels involving these intermediate levels, aswell as the 4 I 9/2 level, are presented in Fig. 11 labelled as III <strong>and</strong>VI, as discussed in the previous section. This non-radiativeinteraction also depends strongly on the inter-ionic distancesbetween the optically active ions <strong>and</strong> starts after the laser pulse,needing some time to promote the Er 3+ ions to the emitting level.Thus there is an initial rise in the temporal evolution <strong>of</strong> theemission intensity after the laser pulse. The efficiency <strong>of</strong> thismechanism depends on the concentration <strong>of</strong> Er 3+ ions <strong>and</strong> theresonance between the emission <strong>and</strong> absorption pr<strong>of</strong>iles <strong>of</strong> thetransitions involved.The temporal evolution <strong>of</strong> the upconverted green <strong>luminescence</strong>in the YGG nano-garnet, shown in Fig. 10, has an initial risefrom the non-zero population <strong>of</strong> the emitting state followed bya slow decrease in the population. The non-zero population <strong>of</strong>the thermalized levels is the fingerprint <strong>of</strong> the ESA processeswhile the following rise indicates that a second mechanism isfeeding the emitting levels through ETU mechanisms. Since thelifetimes <strong>of</strong> the intermediate levels are involved in the process, theintensity <strong>of</strong> the upconverted emission reaches its maximum ataround 10 ms after the laser pulse for the YGG1Er. This delay isquite similar for the YGG5Er <strong>and</strong> it decreases to 1.5 ms for theYGG10Er, being almost negligible due to the highly efficientenergy transfer processes involving the de-excitation <strong>of</strong> thethermalized levels. In order to obtain quantitative values <strong>of</strong> thepercentage <strong>of</strong> ESA <strong>and</strong> ETU mechanisms in the green upconvertedemission, the Stokes <strong>luminescence</strong> decay curve <strong>of</strong> theemitting level under resonant excitation, with an initial value thatequals the value <strong>of</strong> the non-zero initial value at t ¼ 0, is superimposedon the temporal evolution <strong>of</strong> the intensity <strong>of</strong> theupconverted emission after a laser pulsed at 790 nm at RT. 47Comparing the area under the temporal evolution <strong>of</strong> the Stokes<strong>luminescence</strong> with the total area, it can be concluded that theESA <strong>and</strong> the ETU mechanisms share the responsibility <strong>of</strong> theupconverted green <strong>luminescence</strong> <strong>of</strong> the YGG1Er nano-garnetswith nearly 50% for each mechanism. In the case <strong>of</strong> the YGG5Er<strong>and</strong> YGG10Er nano-garnets, the ETU is the dominant mechanismwith a percentage that increases with the Er 3+ concentration(see Fig. 10).With regards to the 4 F 9/2 / 4 I 15/2 red upconverted emission,there is one relevant point to consider that has been commentedon previously; an increase <strong>of</strong> the red emission compared to thegreen one that is much larger compared with the relative intensitiesobtained from 488 nm direct laser excitation <strong>and</strong> that isdirectly dependent on the Er 3+ concentration. This should indicatedifferent natures in the non-linear mechanisms involved foreach level. 41 In order to analyze the mechanisms involved in theupconversion process for the red emission, its temporal evolutionsunder a 790 nm laser pulse for the nano-garnets studied areshown in Fig. 12 (black curves), together with the temporalevolution <strong>of</strong> the red emission exciting resonantly at 525 nm the2H 11/2 <strong>and</strong> 4 S 3/2 thermalized levels (green curves) <strong>and</strong> at 655 nmthe 4 F 9/2 level (red curves).None <strong>of</strong> the upconverted <strong>luminescence</strong> dynamics for the YGGnano-garnets studied follow a pure exponential behavior,contrary to the red emission after a resonant excitation into the4F 9/2 level (see Fig. 7 <strong>and</strong> 12), making the dynamics <strong>of</strong> this levelquite complex. Moreover, from Fig. 11 it can be observed thatnone <strong>of</strong> the ESA mechanisms that can be induced after a 790 nmFig. 12 Temporal evolution <strong>of</strong> the red upconverted <strong>luminescence</strong> <strong>of</strong> theEr 3+ ions in YGG1Er, YGG5Er <strong>and</strong> YGG10Er nano-garnets after a 790nm pulsed excitation. The <strong>luminescence</strong> decay curves <strong>of</strong> the red emissionunder direct excitation <strong>of</strong> the 4 F 9/2 level at 655 nm (thin line) <strong>and</strong> excitingat 525 nm the 4 I 15/2 / 2 H 11/2 transition (thick line) are also included forcomparison.laser excitation can be used to resonantly feed the 4 F 9/2 level fromwhich the red emission takes place. From the dynamics <strong>of</strong> the redupconverted emissions <strong>of</strong> the YGG1Er nano-garnet obtainedexciting at 790 nm <strong>and</strong> at 525 nm resonantly with the 2 H 11/2 level,it can be concluded that, for such a relatively low Er 3+ concentration,the 4 F 9/2 is populated through radiative <strong>and</strong> multiphononrelaxation from the 2 H 11/2 <strong>and</strong> 4 S 3/2 thermalized levels.For higher Er 3+ concentrations, the longer temporal evolutionsreveal the presence <strong>of</strong> a different energy transfer mechanisms thatfeed the red emitting level. Thus the only way to populate thislevel after a 790 nm laser excitation is from the thermalized 2 H 11/2<strong>and</strong> 4 S 3/2 levels, populated using the above-mentioned mechanisms,<strong>and</strong> through an efficient, resonant energy transfer crossrelaxationmechanism labeled as VIII in Fig. 5 <strong>and</strong> 11, in whichthe 4 I 11/2 <strong>and</strong> the 4 I 13/2 levels act as reservoir metastable levels.Taking into account that the lifetime <strong>of</strong> the 4 F 9/2 level is independent<strong>of</strong> the Er 3+ concentration, the long lifetimes <strong>of</strong> thesemetastable levels even at such high concentrations as that in theYGG10Er nano-garnet confirm the existence <strong>of</strong> cross-relaxationchannels that feeds the red emitting level.The enhancement <strong>of</strong> the red emission with respect to the greenone as a function <strong>of</strong> the Er 3+ concentration indicates that theETU mechanism, which populates the 4 F 9/2 level, is more effectivethan those corresponding to the 2 H 11/2 <strong>and</strong> 4 S 3/2 thermalizedlevels. Thus a tunability <strong>of</strong> the intensities <strong>of</strong> the combined greenThis journal is ª The Royal Society <strong>of</strong> Chemistry 2012 J. Mater. Chem., 2012, 22, 13788–13799 | 13797
<strong>and</strong> red upconverted emissions is possible in the Er 3+ -<strong>doped</strong>YGG nano-garnets.DConclusionsThe synthesis <strong>of</strong> Er 3+ -<strong>doped</strong> Y 3 Ga 5 O 12 (YGG) nanocrystals hasbeen successfully carried out via a citrate sol–gel synthesis. X-raydiffraction measurements confirm that the nanocrystals areformed in a single phase <strong>of</strong> the garnet <strong>structure</strong> with an averagegrain size <strong>of</strong> 60 nm, whereas HRTEM pictures show that thenanoparticles are agglomerated in interconnected spherical <strong>and</strong>elliptical shapes. The vibrational properties <strong>of</strong> the YGG nanogarnetsdetermined by Raman <strong>and</strong> FTIR spectroscopy alsoconfirm the good crystalline nature <strong>of</strong> the single phase nanoparticles<strong>and</strong> show that several impurities are attached to thenanocrystal surface. The peaks observed in the absorption <strong>and</strong><strong>luminescence</strong> spectra are due to the incorporation <strong>of</strong> the Er 3+ions into the low-phonon energy dodecahedral site, replacing theY 3+ position, since the interaction <strong>of</strong> the Er 3+ ions with theoxygen lig<strong>and</strong>s in a D 2 local point symmetry completely breaksthe degeneracy <strong>of</strong> the free-Er 3+ multiplets. When exciting the Er 3+ions in the blue range, intense green, red <strong>and</strong> infrared emissionsare observed, starting from four emitting levels, whose intensitiesstrongly depend on the Er 3+ concentration. Different <strong>luminescence</strong>dynamics observed for the different emitting levels for thehigher <strong>doped</strong> nano-garnets indicate the presence <strong>of</strong> differentcross-relaxation mechanisms between Er 3+ ions <strong>and</strong> the transfer<strong>of</strong> energy to quenching traps. The red-to-green intensity ratiosincrease due to cross-relaxation channels that efficiently quenchthe radiative de-excitation <strong>of</strong> the 2 H 11/2 , 4 S 3/2 green emittinglevels, whereas that <strong>of</strong> the 4 I 9/2 red emitting level is not affected.Under cw 790 nm laser excitation the Er 3+ -<strong>doped</strong> YGG nanogarnetsshow bright <strong>and</strong> intense green <strong>and</strong> red upconverted<strong>luminescence</strong>. Different dynamics are observed for the green <strong>and</strong>red upconverted emissions. Both ESA <strong>and</strong> ETU mechanisms areinvolved in the upconverted green <strong>luminescence</strong> <strong>of</strong> the YGG1Ernano-garnets with nearly 50% for each mechanism, whereasETU is dominant in the upconverted green <strong>luminescence</strong> <strong>of</strong> theYGG5Er <strong>and</strong> YGG10Er nano-garnets. The enhancement <strong>of</strong> thered emission with respect to the green one for the high-<strong>doped</strong>nano-garnets is ascribed to the existence <strong>of</strong> cross-relaxationchannels activated by the infrared laser. This ETU mechanismpopulates the 4 F 9/2 level more efficiently than those correspondingto the 2 H 11/2 <strong>and</strong> 4 S 3/2 thermalized levels. These resultsindicate that a tunability <strong>of</strong> the intensities <strong>of</strong> the combined green<strong>and</strong> red upconverted emissions is possible in the Er 3+ -<strong>doped</strong>YGG nano-garnets, making the YGG nano-garnet a potential<strong>and</strong> interesting material in different optical devices such as intwo-dimensional displays or upconversion lasers.AcknowledgementsThis work has been partially supported by Ministerio de Cienciae Innovacion <strong>of</strong> Spain (MICCIN) under The National Program<strong>of</strong> Materials (MAT2010-21270-C04-02; -03; -04), The Consolider-Ingenio2010 Program (MALTA CSD2007-0045), <strong>and</strong>The National Infra<strong>structure</strong> Program, by Ministerio de Economıay Competitividad <strong>of</strong> Spain (MINECO) within The Indo-Spanish Joint Programme <strong>of</strong> Cooperation in Science <strong>and</strong>Technology (PRI-PIBIN-2011-1153/DST-INT-Spain-P-38-11),<strong>and</strong> by the EU-FEDER funds (UCAN08-4E-008). S.F. Leon-Luis <strong>and</strong> V. Monteseguro wish to thank MICINN for the FPIgrants (BES-2008-003353 <strong>and</strong> BES-2011-044596). Dr V. Venkatramuis grateful to DAE-BRNS, Government <strong>of</strong> India for theaward <strong>of</strong> DAE Research Award for Young Scientists (no. 2010/20/34/5/BRNS/2223).Notes <strong>and</strong> references1 A. Speghini, F. Piccinelli <strong>and</strong> M. Bettinelli, Opt. Mater., 2011, 33, 247.2 F. Wang <strong>and</strong> X. Liu, Chem. Soc. Rev., 2009, 38, 976.3 V. Venkatramu, D. Falcomer, A. Speghini, M. Bettinelli <strong>and</strong>C. K. Jayasankar, J. Lumin., 2008, 128, 811.4 V. Venkatramu, M. Giarola, G. Mariotto, S. Enzo, S. Polizzi,C. K. Jayasankar, F. Piccinelli, M. Bettinelli <strong>and</strong> A. Speghini,Nanotechnology, 2010, 21, 175703.5 F. Vetrone, J. C. Boyer, J. A. Capobianco, A. Speghini <strong>and</strong>M. Bettinelli, J. Phys. Chem. B, 2003, 107, 1107.6 D. Hreniak, W. Strek, P. Gluchowski, M. Bettinelli <strong>and</strong> A. Speghini,Appl. Phys. B: Lasers Opt., 2008, 91, 89.7 E. Caponetti, D. C. Martino, M. L. Saladino <strong>and</strong> C. Leonelli,Langmuir, 2007, 23, 3947.8 R. Krsmanovic, V. A. Morozov, O. I. Lebedev, S. Polizzi,A. Speghini, M. Bettinelli <strong>and</strong> G. Van Tendeloo, Nanotechnology,2007, 18, 325604.9 R. Naccache, F. Vetrone, A. Speghini, M. Bettinelli <strong>and</strong>J. A. Capobianco, J. Phys. Chem. C, 2008, 112, 7750.10 F. Auzel, Chem. Rev., 2004, 104, 139.11 G. L. Vossler, C. L. Brooks <strong>and</strong> K. A. Winik, Electron. Lett., 1995, 31,1162.12 T. H. Whitley, C. A. Millar, R. Wyatt, M. C. Brierley <strong>and</strong>D. Szebesta, Electron. Lett., 1991, 27, 1785.13 J. E. Roman, P. Camy, M. Hempstead, W. S. Brocklesby, S. Nouth,A. Beguin, C. Lerminiaux <strong>and</strong> J. S. Wilkinson, Electron. Lett., 1995,31, 1345.14 A. Pollack <strong>and</strong> D. B. Chang, J. Appl. Phys., 1988, 64, 2885.15 L. H. Spangler, B. Farris, E. D. Filer <strong>and</strong> N. P. Bames, J. Appl. Phys.,1996, 79, 573.16 V. Mahalingam, F. Mangiarini, F. Vetrone, V. Venkatramu,M. Bettinelli, A. Speghini <strong>and</strong> J. A. Capobianco, J. Phys. Chem. C,2008, 112, 17745.17 G. H. Dieke <strong>and</strong> H. M. Crosswhite, Appl. Opt., 1963, 2, 675.18 S. S<strong>and</strong>ers, R. G. Waarts, D. G. Mehuys <strong>and</strong> D. F. Welch, Appl. Phys.Lett., 1995, 67, 1815.19 F. Hanson, Appl. Phys. Lett., 1995, 66, 3549.20 P. E.-A. M€obert, E. Heumann, G. Huber <strong>and</strong> B. H. T. Chai, Appl.Phys. Lett., 1998, 73, 139.21 F. Yu, D. Yuan, X. Cheng, X. Duan, X. Wang, L. Kong, L. Wang<strong>and</strong> Z. Li, Mater. Lett., 2007, 61, 2322.22 Y. X. Pan, M. Wu <strong>and</strong> Q. Su, Mater. Sci. Eng., B, 2004, 106, 251.23 A. Katelnikovas <strong>and</strong> A. Kareiva, Mater. Lett., 2008, 62, 1655.24 H. M. Rietveld, J. Appl. Crystallogr., 1969, 2, 65.25 J. Rodrıguez-Carvajal, Phys. Rev. B: Condens. Matter Mater. Phys.,1993, 192, 55.26 N. Matsushita, N. Tsuchiya, K. Kanatsuka <strong>and</strong> T. Yanagitani, J. Am.Ceram. Soc., 1999, 82, 1977.27 F. Euler <strong>and</strong> J. A. Bruce, Acta Crystallogr., 1965, 19, 971.28 K. Binnemans <strong>and</strong> C. J. G€orller-Walr<strong>and</strong>, Phys. Rev. B: Condens.Matter Mater. Phys., 1997, 9, 1637.29 K. Papagelis, J. Arvanitidis, E. Vinga, D. Christ<strong>of</strong>ilos,G. A. Kourouklis, H. Kimura <strong>and</strong> S. Ves, J. Appl. Phys., 2010, 107,113504.30 A. Leleckaite <strong>and</strong> A. Kareiva, Opt. Mater., 2004, 26, 123.31 J. P. Hurrell, S. P. S. Porto, I. F. Chang, S. S. Mitra <strong>and</strong>R. P. Bauman, Phys. Rev., 1958, 173, 851.32 R. L. Wadsack, J. L. Lewis, B. E. Argyle <strong>and</strong> B. K. Chang, Phys. Rev.B: Solid State, 1971, 3, 4342.33 J. J. Song, P. B. Klein, R. L. Wadsack, M. Selders, S. Mroczkowski<strong>and</strong> R. K. Chang, J. Opt. Soc. Am., 1973, 63, 1135.34 M. C. Saine, E. Husson <strong>and</strong> H. Brusset, Spectrochim. Acta, Part A,1982, 38, 25.13798 | J. Mater. Chem., 2012, 22, 13788–13799 This journal is ª The Royal Society <strong>of</strong> Chemistry 2012
35 K. Papagelis, G. Kanellis, S. Ves <strong>and</strong> G. A. Kourouklis, Phys. StatusSolidi B, 2002, 233, 134.36 B. G. Wybourne, Spectroscopic Properties <strong>of</strong> Rare Earths, Wiley-Interscience, 1965.37 M. J. Weber, Phys. Rev., 1967, 157, 262.38 G. H. Dieke, Spectra <strong>and</strong> Energy Levels <strong>of</strong> Rare-Earth Ions in Crystals,Wiley-Interscience, 1968.39 C. A. Morrison <strong>and</strong> R. P. Leavitt, H<strong>and</strong>book on the Physics <strong>and</strong>Chemistry <strong>of</strong> Rare Earths, ed. K A Gschneidner Jr <strong>and</strong> L. Eyring,Elsevier, Amsterdam, 1982, 5, 461.40 P. Dorenbos, J. Lumin., 2000, 91, 91.41 X. Chen, T. Nguyen, Q. Luu <strong>and</strong> B. Di Bartolo, J. Lumin., 2000, 85,295.42 B. Di Bartolo, Energy transfer among ions in solids in Energy Transferin Condensed Matter, ed. B. Di Bartolo, NATO ASI Series, PlenumPress, 1984, vol. 114.43 F. Auzel, F. Bonfigli, S. Gagliari <strong>and</strong> G. Baldacchini, J. Lumin., 2001,94–95, 293.44 F. Auzel, G. Baldacchini, L. Laversenne <strong>and</strong> G. Boulon, Opt. Mater.,2003, 24, 103.45 J. Fern<strong>and</strong>ez, R. Balda, A. Mendioroz, M. Sanz <strong>and</strong> J.-L. Adam, J.Non-Cryst. Solids, 2001, 287, 437.46 M. Pollnau, D. R. Gamelin, S. R. L€uthi, H. U. G€udel <strong>and</strong>M. P. Hehlen, Phys. Rev. B: Condens. Matter, 2000, 61, 3337.47 R. Valiente, O. S. Wenger <strong>and</strong> H. U. G€udel, J. Chem. Phys., 2002,116, 5196.This journal is ª The Royal Society <strong>of</strong> Chemistry 2012 J. Mater. Chem., 2012, 22, 13788–13799 | 13799