Most assessments <strong>of</strong> the returns on wheat research<strong>in</strong>vestments 2 have focused on productivityenhancement. <strong>The</strong>re are comparatively fewereconomic analyses <strong>of</strong> wheat ma<strong>in</strong>tenance research,particularly for pest and disease resistance breed<strong>in</strong>g(Doodson 1981; Heim and Blakeslee 1986; Blakeslee1987; Brennan and Murray 1988; Priestley and Bayles1988; Brennan et al. 1994; Morris et al. 1994; Coll<strong>in</strong>s1995; Smale et al. 1998; Marasas 1999). However,research at CIMMYT <strong>in</strong>dicates that resistancebreed<strong>in</strong>g has generated a substantial proportion <strong>of</strong> thereturns on <strong>in</strong>ternational wheat research over the pastdecades (Bohn and Byerlee 1993; Byerlee and Moya1993; Byerlee and Traxler 1995; Rajaram et al. 1996;Heisey et al. 1999). Analyses <strong>of</strong> trial results confirmedthat progress <strong>in</strong> protect<strong>in</strong>g yield potential through leafrust resistance has been greater than advances <strong>in</strong> yieldpotential itself (Sayre et al. 1998).Smale et al. (1998) estimated the returns onCIMMYT’s <strong>in</strong>vestment <strong>in</strong> a breed<strong>in</strong>g strategy for racenonspecificresistance, as compared to one for racespecificresistance, <strong>in</strong> the Yaqui Valley <strong>of</strong> northwesternMexico. A return <strong>of</strong> 40% was calculated for 1970-1990.<strong>The</strong> authors assumed average annual yield sav<strong>in</strong>gs <strong>of</strong>only 9% and a research-to-adoption lag <strong>of</strong> five years,which is reasonable for varieties released as close toCIMMYT as the Yaqui Valley. <strong>The</strong>y used detailed<strong>in</strong>formation on resistance genes and the longevity <strong>of</strong>useful resistance for each wheat variety grown s<strong>in</strong>ce1968. <strong>The</strong> Yaqui Valley represents a test<strong>in</strong>g ground forME1—the major environment <strong>in</strong> which CIMMYTrelatedspr<strong>in</strong>g bread wheat is grown. However, thatstudy covered only 150,000 <strong>of</strong> the estimated 66.5million hectares <strong>of</strong> spr<strong>in</strong>g bread wheat <strong>in</strong>cluded <strong>in</strong>this study.Similar genetic <strong>in</strong>formation was not available on aglobal basis to facilitate our analysis. <strong>The</strong> actuallongevity <strong>of</strong> useful leaf rust resistance is not knownfor each variety released <strong>in</strong> each productionenvironment <strong>of</strong> the develop<strong>in</strong>g world s<strong>in</strong>ce 1973. <strong>The</strong>genetic basis <strong>of</strong> resistance is also not known for allvarieties, and the presence <strong>of</strong> resistance sources <strong>in</strong> avariety’s ancestry does not ensure that it conta<strong>in</strong>s therelevant gene. Even if the gene is present, <strong>in</strong>teractionswith other genes and the environment eventuallydeterm<strong>in</strong>e the variety’s resistance level whenchallenged by pathogens <strong>in</strong> farmers’ fields. Moreover,consider<strong>in</strong>g that farmers <strong>in</strong> develop<strong>in</strong>g countries usevarieties with various types and levels <strong>of</strong> leaf rustresistance, our analysis encompassed race-specificand race-nonspecific resistance. <strong>The</strong> conceptualframework and methodology underly<strong>in</strong>g theeconomic analysis is expla<strong>in</strong>ed <strong>in</strong> the follow<strong>in</strong>gsections.Conceptual Framework<strong>The</strong> first step <strong>in</strong> measur<strong>in</strong>g the economic benefits <strong>of</strong>agricultural research is to compare the situation withresearch to one with no research, also known as the“with” and “without” scenarios (Gitt<strong>in</strong>ger 1982;Alston et al. 1995). Follow<strong>in</strong>g the background<strong>in</strong>formation provided <strong>in</strong> the previous sections, weassumed that the “with” scenario is represented byresistant varieties with different leaf rust resistancecategories, and the “without” scenario by susceptiblevarieties. Given the pathogen’s ability to overcomethe effects <strong>of</strong> previously resistant varieties, we arguedthat leaf rust resistance breed<strong>in</strong>g is an example <strong>of</strong>productivity ma<strong>in</strong>tenance. An economic surplusapproach adjusted for ma<strong>in</strong>tenance research and acapital <strong>in</strong>vestment analysis were applied to estimatethe returns on CIMMYT’s <strong>in</strong>vestment. <strong>The</strong> “with”and “without” scenarios are subsequently expla<strong>in</strong>edwith<strong>in</strong> an economic surplus framework.In the basic version <strong>of</strong> the surplus approach,productivity enhancement is <strong>of</strong>ten treated as a costreduc<strong>in</strong>grightward or downward shift <strong>in</strong> theaggregate supply function 3 <strong>of</strong> a commodity, as shownby S 1<strong>in</strong> Figure 1. This may result from yield <strong>in</strong>creasesor cost sav<strong>in</strong>gs attributable to the technology.Constant supply is assumed <strong>in</strong> the absence <strong>of</strong>2A review <strong>of</strong> previous studies, <strong>in</strong>clud<strong>in</strong>g wheat among other enterprises, can be found <strong>in</strong> Evenson (1998). Studies morerecently conducted <strong>in</strong> Africa are summarized <strong>in</strong> Marasas (1999), and impact assessment milestones <strong>of</strong> the ConsultativeGroup on International Agricultural Research are described by P<strong>in</strong>gali (2001).3<strong>The</strong> economic surplus approach for estimat<strong>in</strong>g the returns on agricultural research was pioneered by Griliches (1958).<strong>The</strong> progressive ref<strong>in</strong>ements that have s<strong>in</strong>ce appeared <strong>in</strong> the literature vary <strong>in</strong> their complexity and data requirements,and may differ <strong>in</strong> their functional form, nature <strong>of</strong> the demand and supply curves, and the nature <strong>of</strong> the research-<strong>in</strong>ducedshifts <strong>in</strong> the supply curve. <strong>The</strong>se assumptions <strong>in</strong>fluence the magnitude <strong>of</strong> the change <strong>in</strong> economic surplus, and itsdistribution between consumers and producers. For examples, which also <strong>in</strong>clude adaptations to crop breed<strong>in</strong>gprograms, see: Peterson (1967); Schmitz and Seckler (1970); Fishel (1971); Ayer and Schuh (1972); Ak<strong>in</strong>o and Hayami(1975); Hayami and Herdt (1977); L<strong>in</strong>dner and Jarrett (1978); Scobie and Posada (1978); Schuh and Toll<strong>in</strong>i (1979); Rose(1980); Wise and Fell (1980); Norton and Davis (1981); Alston et al. (1988); Byerlee (1990); Voon and Edwards (1991);Brennan (1992); Johnston et al. (1992); Renkow (1993); Morris et al. (1994); Alston et al. (1995); Coll<strong>in</strong>s (1995);Anandajayasekeram et al. (1996); and Marasas (1999).11
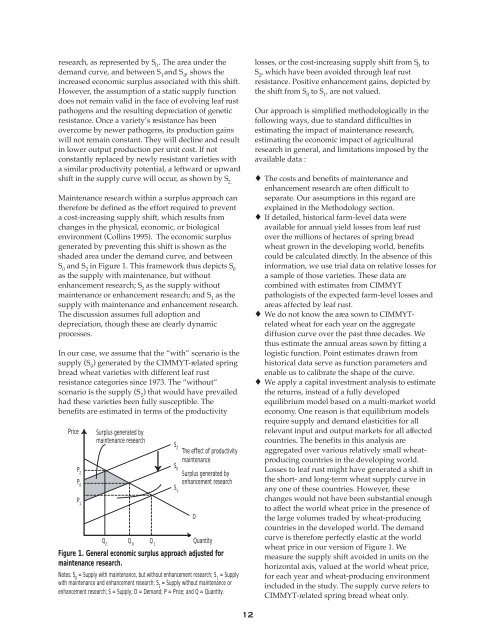
esearch, as represented by S 0. <strong>The</strong> area under thedemand curve, and between S 1and S 0, shows the<strong>in</strong>creased economic surplus associated with this shift.However, the assumption <strong>of</strong> a static supply functiondoes not rema<strong>in</strong> valid <strong>in</strong> the face <strong>of</strong> evolv<strong>in</strong>g leaf rustpathogens and the result<strong>in</strong>g depreciation <strong>of</strong> geneticresistance. Once a variety’s resistance has beenovercome by newer pathogens, its production ga<strong>in</strong>swill not rema<strong>in</strong> constant. <strong>The</strong>y will decl<strong>in</strong>e and result<strong>in</strong> lower output production per unit cost. If notconstantly replaced by newly resistant varieties witha similar productivity potential, a leftward or upwardshift <strong>in</strong> the supply curve will occur, as shown by S 2.Ma<strong>in</strong>tenance research with<strong>in</strong> a surplus approach cantherefore be def<strong>in</strong>ed as the effort required to preventa cost-<strong>in</strong>creas<strong>in</strong>g supply shift, which results fromchanges <strong>in</strong> the physical, economic, or biologicalenvironment (Coll<strong>in</strong>s 1995). <strong>The</strong> economic surplusgenerated by prevent<strong>in</strong>g this shift is shown as theshaded area under the demand curve, and betweenS 0and S 2<strong>in</strong> Figure 1. This framework thus depicts S 0as the supply with ma<strong>in</strong>tenance, but withoutenhancement research; S 2as the supply withoutma<strong>in</strong>tenance or enhancement research; and S 1as thesupply with ma<strong>in</strong>tenance and enhancement research.<strong>The</strong> discussion assumes full adoption anddepreciation, though these are clearly dynamicprocesses.In our case, we assume that the “with” scenario is thesupply (S 0) generated by the CIMMYT-related spr<strong>in</strong>gbread wheat varieties with different leaf rustresistance categories s<strong>in</strong>ce 1973. <strong>The</strong> “without”scenario is the supply (S 2) that would have prevailedhad these varieties been fully susceptible. <strong>The</strong>benefits are estimated <strong>in</strong> terms <strong>of</strong> the productivityPriceP 2P 0Surplus generated byma<strong>in</strong>tenance researchP 1Q 0<strong>The</strong> effect <strong>of</strong> productivityma<strong>in</strong>tenanceSurplus generated byenhancement researchDQ 2Q 1QuantityFigure 1. General economic surplus approach adjusted forma<strong>in</strong>tenance research.Notes: S 0= Supply with ma<strong>in</strong>tenance, but without enhancement research; S 1= Supplywith ma<strong>in</strong>tenance and enhancement research; S 2= Supply without ma<strong>in</strong>tenance orenhancement research; S = Supply; D = Demand; P = Price; and Q = Quantity.S 2S 0S 1losses, or the cost-<strong>in</strong>creas<strong>in</strong>g supply shift from S 0toS 2, which have been avoided through leaf rustresistance. Positive enhancement ga<strong>in</strong>s, depicted bythe shift from S 0to S 1, are not valued.Our approach is simplified methodologically <strong>in</strong> thefollow<strong>in</strong>g ways, due to standard difficulties <strong>in</strong>estimat<strong>in</strong>g the impact <strong>of</strong> ma<strong>in</strong>tenance research,estimat<strong>in</strong>g the economic impact <strong>of</strong> agriculturalresearch <strong>in</strong> general, and limitations imposed by theavailable data :♦ <strong>The</strong> costs and benefits <strong>of</strong> ma<strong>in</strong>tenance andenhancement research are <strong>of</strong>ten difficult toseparate. Our assumptions <strong>in</strong> this regard areexpla<strong>in</strong>ed <strong>in</strong> the Methodology section.♦ If detailed, historical farm-level data wereavailable for annual yield losses from leaf rustover the millions <strong>of</strong> hectares <strong>of</strong> spr<strong>in</strong>g breadwheat grown <strong>in</strong> the develop<strong>in</strong>g world, benefitscould be calculated directly. In the absence <strong>of</strong> this<strong>in</strong>formation, we use trial data on relative losses fora sample <strong>of</strong> those varieties. <strong>The</strong>se data arecomb<strong>in</strong>ed with estimates from CIMMYTpathologists <strong>of</strong> the expected farm-level losses andareas affected by leaf rust.♦ We do not know the area sown to CIMMYTrelatedwheat for each year on the aggregatediffusion curve over the past three decades. Wethus estimate the annual areas sown by fitt<strong>in</strong>g alogistic function. Po<strong>in</strong>t estimates drawn fromhistorical data serve as function parameters andenable us to calibrate the shape <strong>of</strong> the curve.♦ We apply a capital <strong>in</strong>vestment analysis to estimatethe returns, <strong>in</strong>stead <strong>of</strong> a fully developedequilibrium model based on a multi-market worldeconomy. One reason is that equilibrium modelsrequire supply and demand elasticities for allrelevant <strong>in</strong>put and output markets for all affectedcountries. <strong>The</strong> benefits <strong>in</strong> this analysis areaggregated over various relatively small wheatproduc<strong>in</strong>gcountries <strong>in</strong> the develop<strong>in</strong>g world.Losses to leaf rust might have generated a shift <strong>in</strong>the short- and long-term wheat supply curve <strong>in</strong>any one <strong>of</strong> these countries. However, thesechanges would not have been substantial enoughto affect the world wheat price <strong>in</strong> the presence <strong>of</strong>the large volumes traded by wheat-produc<strong>in</strong>gcountries <strong>in</strong> the developed world. <strong>The</strong> demandcurve is therefore perfectly elastic at the worldwheat price <strong>in</strong> our version <strong>of</strong> Figure 1. Wemeasure the supply shift avoided <strong>in</strong> units on thehorizontal axis, valued at the world wheat price,for each year and wheat-produc<strong>in</strong>g environment<strong>in</strong>cluded <strong>in</strong> the study. <strong>The</strong> supply curve refers toCIMMYT-related spr<strong>in</strong>g bread wheat only.12