esults showed that the annual progress <strong>in</strong> gra<strong>in</strong> yieldpotential achieved through resistance breed<strong>in</strong>g,averaged over six trials, was 0.48% for fungicideprotected plots and 2.21% for plots not protected byfungicide. Thus, although the gra<strong>in</strong> yield potential <strong>of</strong>CIMMYT-related cultivars has improved significantlyover the past 30 years, the progress <strong>in</strong> protect<strong>in</strong>g thisyield potential through rust resistance breed<strong>in</strong>g wasestimated to be at least four times greater. <strong>The</strong> trialdata imply that leaf rust resistance has accounted for82% <strong>of</strong> the average annual progress <strong>in</strong> gra<strong>in</strong> yieldpotential between 1966 and 1988 <strong>in</strong> northwesternMexico. This estimate was used to adjust the averageannual yield series for ME 1. <strong>The</strong> follow<strong>in</strong>g logl<strong>in</strong>earmodel was used for this purpose:ln (y t) = α + βX + ε (4)<strong>The</strong> parameters are: ln (y t), the natural logarithm <strong>of</strong> y t,the average annual farm-level yield <strong>of</strong> CIMMYTrelatedspr<strong>in</strong>g bread wheat <strong>in</strong> ME 1; α, a constant; β,the average annual yield growth rate; X, time <strong>in</strong> yearsfrom 1973 to 1998; and ε, the error term.<strong>The</strong> logl<strong>in</strong>ear ln (y t) <strong>of</strong> the orig<strong>in</strong>al ME 1 yield series y twas regressed to estimate the coefficient on time β,represent<strong>in</strong>g the average annual percent growth <strong>in</strong>yield from 1973 to 1998. <strong>The</strong> coefficient was adjustedby 82% to <strong>in</strong>clude only the proportion <strong>of</strong> growthattributable to leaf rust resistance breed<strong>in</strong>g, asestimated from the CIMMYT trial data by Sayre et al.(1998). This resulted <strong>in</strong> a new coefficient ˆβ, which wasused to generate a new logl<strong>in</strong>ear yield series ln( ŷ t).<strong>The</strong> antilog resulted <strong>in</strong> a yield series ( ŷ t) <strong>in</strong>clud<strong>in</strong>gonly the growth attributable to leaf rust resistance,net <strong>of</strong> yield enhancement and other research effects,and thus correspond<strong>in</strong>g to around 82% <strong>of</strong> the orig<strong>in</strong>alseries y t. As before, we regressed the data to projectyields to 2007, and repeated the analysis bysubstitut<strong>in</strong>g y twith ŷ t<strong>in</strong> equations (1) to (3).Area to which yield sav<strong>in</strong>gs applyParameter a t<strong>in</strong> equations (1) to (3) represents theaverage annual area to which yield sav<strong>in</strong>gs apply, bygenetic resistance category and ME, from 1973 to2007. This is calculated as the product <strong>of</strong>: (1) thepercent area grown to CIMMYT-related spr<strong>in</strong>g breadwheat by ME s<strong>in</strong>ce 1973; (2) the average annualpercent area potentially affected by leaf rust by ME;(3) the percent distribution <strong>of</strong> area by geneticresistance category and ME; and (4) the averageannual area sown to CIMMYT-related spr<strong>in</strong>g breadwheat by ME, from 1973 to 2007.Percent area grown to CIMMYT-related spr<strong>in</strong>gbread wheat. <strong>The</strong> proportion <strong>of</strong> area sown toCIMMYT-related spr<strong>in</strong>g bread wheat varieties s<strong>in</strong>ce1973 was estimated by diffusion curves with alogistic function (Griliches 1957; CIMMYT 1993).<strong>The</strong> logistic function produces an S-shaped curverepresent<strong>in</strong>g the cumulative proportion <strong>of</strong> adoptionover time. This assumes slow <strong>in</strong>itial growth <strong>in</strong> theuse <strong>of</strong> the new technology, followed by a more rapid<strong>in</strong>crease and then a slow rate <strong>of</strong> <strong>in</strong>crease as adoptionapproaches a ceil<strong>in</strong>g asymptotically. S<strong>in</strong>ce Griliches’study <strong>of</strong> hybrid maize adoption <strong>in</strong> 1957, the S-shaped logistic curve has <strong>of</strong>ten been used <strong>in</strong> studies<strong>of</strong> seed technology adoption. <strong>The</strong> function isexpressed as:P = –––––––K(5)1+e -(a+bt)Parameters are: P, the cumulative percent arearepresent<strong>in</strong>g the cumulative path <strong>of</strong> adoption; K, theceil<strong>in</strong>g or upper bound <strong>of</strong> adoption; t, time; b, aconstant related to the slope or rate <strong>of</strong> adoption; anda, a constant related to the time when adoptionbeg<strong>in</strong>s.Historical CIMMYT Global Wheat <strong>Impact</strong>s Surveydata from 1977, 1990, and 1997 on adoption levelsand adoption lags were used to solve for the logisticfunction parameters algebraically (Table 1). Thisenabled the estimation <strong>of</strong> cumulative adoption rates<strong>in</strong> <strong>in</strong>terven<strong>in</strong>g years. Estimates <strong>of</strong> the cumulativepercent area planted to CIMMYT-related spr<strong>in</strong>gbread wheat by ME <strong>in</strong> 1997 (Heisey et al. 2002) wereassumed as the adoption ceil<strong>in</strong>g <strong>in</strong> eachenvironment. <strong>The</strong> 1997 estimates were comb<strong>in</strong>edwith 1977 (CIMMYT 1989) and 1990 (Byerlee andMoya 1993) 7 data to calibrate the diffusion curves atthree po<strong>in</strong>ts <strong>in</strong> time, and subsequently to estimatethe total time period <strong>of</strong> diffusion <strong>in</strong> each ME. <strong>The</strong>same sources were used to estimate the adoptionlag, or the period from varietal release until its <strong>in</strong>itialadoption by farmers, <strong>in</strong> each ME. We assumed that7Adoption reported <strong>in</strong> ME 3 for 1997 (Heisey et al. 2002) is lower than for 1990 (Byerlee and Moya 1993). This is expla<strong>in</strong>edby the relatively high number <strong>of</strong> improved tall varieties that cont<strong>in</strong>ued to be released and sown <strong>in</strong> Brazil. S<strong>in</strong>ce they aretall, they were not accounted for <strong>in</strong> the adoption estimates for semidwarf varieties by Heisey et al. (2002). However, theyprobably <strong>of</strong>ten conta<strong>in</strong> improved and/or CIMMYT germplasm, and could still be considered as CIMMYT-relatedmaterial. For all wheat production environments other than MEs 2 and 4a, there is fairly strong evidence that adoptionceil<strong>in</strong>gs have been reached, unless major genetic changes are accomplished, such as for drought tolerance.19
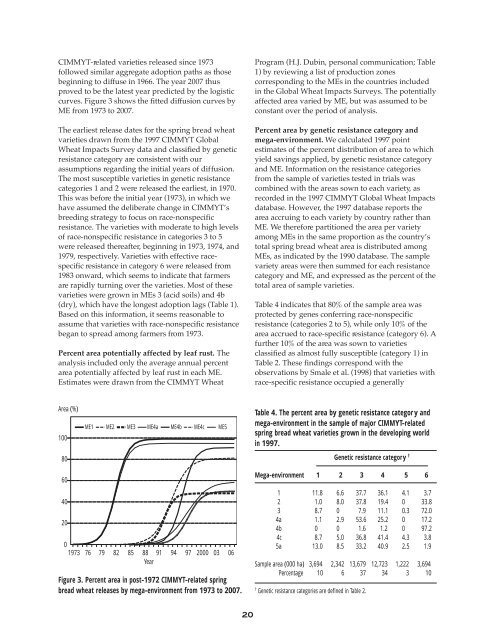
CIMMYT-related varieties released s<strong>in</strong>ce 1973followed similar aggregate adoption paths as thosebeg<strong>in</strong>n<strong>in</strong>g to diffuse <strong>in</strong> 1966. <strong>The</strong> year 2007 thusproved to be the latest year predicted by the logisticcurves. Figure 3 shows the fitted diffusion curves byME from 1973 to 2007.<strong>The</strong> earliest release dates for the spr<strong>in</strong>g bread wheatvarieties drawn from the 1997 CIMMYT GlobalWheat <strong>Impact</strong>s Survey data and classified by geneticresistance category are consistent with ourassumptions regard<strong>in</strong>g the <strong>in</strong>itial years <strong>of</strong> diffusion.<strong>The</strong> most susceptible varieties <strong>in</strong> genetic resistancecategories 1 and 2 were released the earliest, <strong>in</strong> 1970.This was before the <strong>in</strong>itial year (1973), <strong>in</strong> which wehave assumed the deliberate change <strong>in</strong> CIMMYT’sbreed<strong>in</strong>g strategy to focus on race-nonspecificresistance. <strong>The</strong> varieties with moderate to high levels<strong>of</strong> race-nonspecific resistance <strong>in</strong> categories 3 to 5were released thereafter, beg<strong>in</strong>n<strong>in</strong>g <strong>in</strong> 1973, 1974, and1979, respectively. Varieties with effective racespecificresistance <strong>in</strong> category 6 were released from1983 onward, which seems to <strong>in</strong>dicate that farmersare rapidly turn<strong>in</strong>g over the varieties. Most <strong>of</strong> thesevarieties were grown <strong>in</strong> MEs 3 (acid soils) and 4b(dry), which have the longest adoption lags (Table 1).Based on this <strong>in</strong>formation, it seems reasonable toassume that varieties with race-nonspecific resistancebegan to spread among farmers from 1973.Percent area potentially affected by leaf rust. <strong>The</strong>analysis <strong>in</strong>cluded only the average annual percentarea potentially affected by leaf rust <strong>in</strong> each ME.Estimates were drawn from the CIMMYT WheatProgram (H.J. Dub<strong>in</strong>, personal communication; Table1) by review<strong>in</strong>g a list <strong>of</strong> production zonescorrespond<strong>in</strong>g to the MEs <strong>in</strong> the countries <strong>in</strong>cluded<strong>in</strong> the Global Wheat <strong>Impact</strong>s Surveys. <strong>The</strong> potentiallyaffected area varied by ME, but was assumed to beconstant over the period <strong>of</strong> analysis.Percent area by genetic resistance category andmega-environment. We calculated 1997 po<strong>in</strong>testimates <strong>of</strong> the percent distribution <strong>of</strong> area to whichyield sav<strong>in</strong>gs applied, by genetic resistance categoryand ME. Information on the resistance categoriesfrom the sample <strong>of</strong> varieties tested <strong>in</strong> trials wascomb<strong>in</strong>ed with the areas sown to each variety, asrecorded <strong>in</strong> the 1997 CIMMYT Global Wheat <strong>Impact</strong>sdatabase. However, the 1997 database reports thearea accru<strong>in</strong>g to each variety by country rather thanME. We therefore partitioned the area per varietyamong MEs <strong>in</strong> the same proportion as the country’stotal spr<strong>in</strong>g bread wheat area is distributed amongMEs, as <strong>in</strong>dicated by the 1990 database. <strong>The</strong> samplevariety areas were then summed for each resistancecategory and ME, and expressed as the percent <strong>of</strong> thetotal area <strong>of</strong> sample varieties.Table 4 <strong>in</strong>dicates that 80% <strong>of</strong> the sample area wasprotected by genes conferr<strong>in</strong>g race-nonspecificresistance (categories 2 to 5), while only 10% <strong>of</strong> thearea accrued to race-specific resistance (category 6). Afurther 10% <strong>of</strong> the area was sown to varietiesclassified as almost fully susceptible (category 1) <strong>in</strong>Table 2. <strong>The</strong>se f<strong>in</strong>d<strong>in</strong>gs correspond with theobservations by Smale et al. (1998) that varieties withrace-specific resistance occupied a generallyArea (%)10080ME1 ME2 ME3 ME4a ME4b ME4c ME5Table 4. <strong>The</strong> percent area by genetic resistance category andmega-environment <strong>in</strong> the sample <strong>of</strong> major CIMMYT-relatedspr<strong>in</strong>g bread wheat varieties grown <strong>in</strong> the develop<strong>in</strong>g world<strong>in</strong> 1997.Genetic resistance category †60402001973 76 79 82 85 88 91 94 97 2000 03 06YearFigure 3. Percent area <strong>in</strong> post-1972 CIMMYT-related spr<strong>in</strong>gbread wheat releases by mega-environment from 1973 to 2007.Mega-environment 1 2 3 4 5 61 11.8 6.6 37.7 36.1 4.1 3.72 1.0 8.0 37.8 19.4 0 33.83 8.7 0 7.9 11.1 0.3 72.04a 1.1 2.9 53.6 25.2 0 17.24b 0 0 1.6 1.2 0 97.24c 8.7 5.0 36.8 41.4 4.3 3.85a 13.0 8.5 33.2 40.9 2.5 1.9Sample area (000 ha) 3,694 2,342 13,679 12,723 1,222 3,694Percentage 10 6 37 34 3 10†Genetic resistance categories are def<strong>in</strong>ed <strong>in</strong> Table 2.20