MethodologyIn the capital <strong>in</strong>vestment analysis, the researchreturns were estimated <strong>in</strong> terms <strong>of</strong> the net presentvalue, <strong>in</strong>ternal rate <strong>of</strong> return, and benefit-cost ratio,as def<strong>in</strong>ed by Gitt<strong>in</strong>ger (1982). <strong>The</strong> net present value<strong>of</strong> leaf rust resistance breed<strong>in</strong>g <strong>in</strong> CIMMYT-relatedspr<strong>in</strong>g bread wheat can be most generally expressedas:n1Net present value = Σ ––––– [(p λy a)-C ]t t t t (1)t=1(1+i) tEssential parameters are: (1) λ, the average annualfarm-level percent yield loss avoided throughvarieties with different leaf rust resistance categories;(2) y, the average annual farm-level wheat yield perhectare, and (3) a, the area sown to CIMMYT-relatedspr<strong>in</strong>g bread wheat that is potentially affected byleaf rust. <strong>The</strong> product <strong>of</strong> these terms represents theproduction sav<strong>in</strong>gs by leaf rust resistance categoryand wheat breed<strong>in</strong>g environment. This is valued bythe (4) real world wheat price p. <strong>The</strong> differencebetween the gross benefits and the (5) research costC is calculated for (6) each year t. <strong>The</strong> benefits start<strong>in</strong> 1973, the year <strong>of</strong> release <strong>of</strong> the first variety (Torim73) recognized and promoted for race-nonspecificresistance. Costs are assumed s<strong>in</strong>ce 1967 (t 1) to allowa research lag for the varieties released <strong>in</strong> 1973. <strong>The</strong>benefits end n years later <strong>in</strong> 2007 (t n), the year thelast adoption ceil<strong>in</strong>g predicted <strong>in</strong> our logisticdiffusion curves is reached. <strong>The</strong> net benefits arediscounted s<strong>in</strong>ce 1967 by the (7) <strong>in</strong>terest rate i toobta<strong>in</strong> the net present value.<strong>The</strong> net present value is an economic <strong>in</strong>dicator <strong>of</strong> themagnitude <strong>of</strong> net benefits generated by the<strong>in</strong>vestment. By contrast, the <strong>in</strong>ternal rate <strong>of</strong> returnexpresses the magnitude <strong>of</strong> net benefits relative tothe <strong>in</strong>vestment outlay. It represents the maximum<strong>in</strong>terest that can be paid for the resources used if an<strong>in</strong>itiative is to recover its <strong>in</strong>vestment. <strong>The</strong> <strong>in</strong>ternalrate <strong>of</strong> return is estimated by sett<strong>in</strong>g the net presentvalue equal to zero <strong>in</strong> equation (1) and solv<strong>in</strong>g for iarithmetically:n1Σ ––––– [(p λy a )-C ] = 0t t t tt=1(1+i) t(2)<strong>The</strong> <strong>in</strong>vestment returns can also be expressed as theratio <strong>of</strong> benefits generated relative to the funds<strong>in</strong>vested. For this purpose, the benefit-cost ratio iscalculated by divid<strong>in</strong>g the present value <strong>of</strong> the grossbenefits by the present value <strong>of</strong> the research costs:n1 (p tλy ta t)Benefit-cost ratio = Σ––––– ––––––– (3)t=1(1+i) t C tIn this report, we first compare the gross benefits byresistance category and wheat breed<strong>in</strong>g environment,s<strong>in</strong>ce the research costs could not be separated onthis basis. <strong>The</strong> economic returns on CIMMYT’s<strong>in</strong>vestment <strong>in</strong> wheat genetic improvement are thencalculated. Sensitivity analysis is conducted byvary<strong>in</strong>g assumptions related to research costs, thediscount rate, and yield losses avoided. Varioussources <strong>of</strong> primary and secondary data wereemployed, <strong>in</strong>clud<strong>in</strong>g: (1) the 1990 and 1997 CIMMYTGlobal Wheat <strong>Impact</strong>s Surveys; (2) data from theFood and Agriculture Organization (FAO) on annualnational wheat yields and areas; (3) data from trialsconducted at El Batán, Mexico, <strong>in</strong> 2000 and previousyears; and (4) other CIMMYT publications andestimates. Calculation <strong>of</strong> each <strong>of</strong> the parameters <strong>in</strong>equations (1) to (3) is described next, with detailsrelated to data sources and assumptions. A summary<strong>of</strong> parameter assumptions is presented <strong>in</strong> Table 1.Yield losses avoidedParameter λy t<strong>in</strong> equations (1) to (3) is def<strong>in</strong>ed as theaverage annual farm-level yield losses avoidedthrough grow<strong>in</strong>g CIMMYT-related spr<strong>in</strong>g breadwheat varieties, by genetic resistance category andME, from 1973 to 2007. This is calculated as theproduct <strong>of</strong>: (1) the percent yield loss avoided throughresistant relative to susceptible varieties, byresistance category; (2) the average annual farm-levelpercent yield loss with susceptible varieties, by ME;and (3) the average annual farm-level yield <strong>of</strong>CIMMYT-related spr<strong>in</strong>g bread wheat, by ME from1973 to 2007. Calculation <strong>of</strong> each <strong>of</strong> these terms isexpla<strong>in</strong>ed <strong>in</strong> the follow<strong>in</strong>g sections.Percent yield loss avoided through resistant relativeto susceptible varieties. A list <strong>of</strong> varieties was drawnfrom CIMMYT’s latest Global Wheat <strong>Impact</strong>s Survey,which provides data on the area sown to the majorspr<strong>in</strong>g bread wheat varieties grown by farmers <strong>in</strong>develop<strong>in</strong>g countries <strong>in</strong> 1997 (see Heisey et al. 2002and summary <strong>in</strong> Heisey et al. 1999). A similar surveywas implemented <strong>in</strong> 1990 (Byerlee and Moya 1993).In 1997, questionnaires were sent to 41 develop<strong>in</strong>gcountries where at least 20,000 tons <strong>of</strong> wheat are13
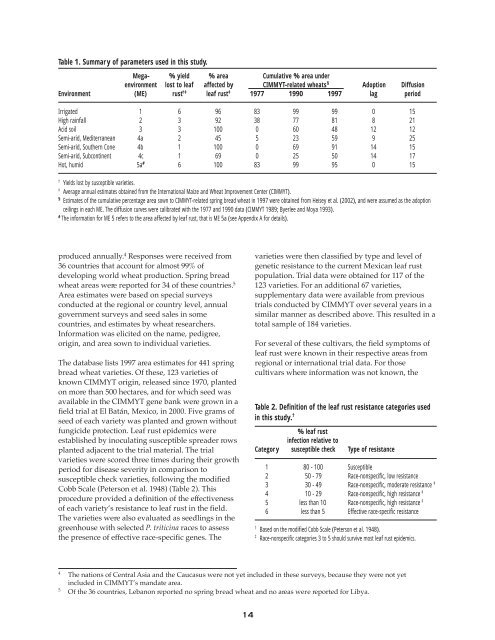
Table 1. Summary <strong>of</strong> parameters used <strong>in</strong> this study.Mega- % yield % area Cumulative % area underenvironment lost to leaf affected by CIMMYT-related wheats § Adoption DiffusionEnvironment (ME) rust †‡ leaf rust ‡ 1977 1990 1997 lag periodIrrigated 1 6 96 83 99 99 0 15High ra<strong>in</strong>fall 2 3 92 38 77 81 8 21Acid soil 3 3 100 0 60 48 12 12Semi-arid, Mediterranean 4a 2 45 5 23 59 9 25Semi-arid, Southern Cone 4b 1 100 0 69 91 14 15Semi-arid, Subcont<strong>in</strong>ent 4c 1 69 0 25 50 14 17Hot, humid 5a # 6 100 83 99 95 0 15†Yields lost by susceptible varieties.‡Average annual estimates obta<strong>in</strong>ed from the International Maize and Wheat Improvement Center (CIMMYT).§ Estimates <strong>of</strong> the cumulative percentage area sown to CIMMYT-related spr<strong>in</strong>g bread wheat <strong>in</strong> 1997 were obta<strong>in</strong>ed from Heisey et al. (2002), and were assumed as the adoptionceil<strong>in</strong>gs <strong>in</strong> each ME. <strong>The</strong> diffusion curves were calibrated with the 1977 and 1990 data (CIMMYT 1989; Byerlee and Moya 1993).#<strong>The</strong> <strong>in</strong>formation for ME 5 refers to the area affected by leaf rust, that is ME 5a (see Appendix A for details).produced annually. 4 Responses were received from36 countries that account for almost 99% <strong>of</strong>develop<strong>in</strong>g world wheat production. Spr<strong>in</strong>g breadwheat areas were reported for 34 <strong>of</strong> these countries. 5Area estimates were based on special surveysconducted at the regional or country level, annualgovernment surveys and seed sales <strong>in</strong> somecountries, and estimates by wheat researchers.Information was elicited on the name, pedigree,orig<strong>in</strong>, and area sown to <strong>in</strong>dividual varieties.<strong>The</strong> database lists 1997 area estimates for 441 spr<strong>in</strong>gbread wheat varieties. Of these, 123 varieties <strong>of</strong>known CIMMYT orig<strong>in</strong>, released s<strong>in</strong>ce 1970, plantedon more than 500 hectares, and for which seed wasavailable <strong>in</strong> the CIMMYT gene bank were grown <strong>in</strong> afield trial at El Batán, Mexico, <strong>in</strong> 2000. Five grams <strong>of</strong>seed <strong>of</strong> each variety was planted and grown withoutfungicide protection. Leaf rust epidemics wereestablished by <strong>in</strong>oculat<strong>in</strong>g susceptible spreader rowsplanted adjacent to the trial material. <strong>The</strong> trialvarieties were scored three times dur<strong>in</strong>g their growthperiod for disease severity <strong>in</strong> comparison tosusceptible check varieties, follow<strong>in</strong>g the modifiedCobb Scale (Peterson et al. 1948) (Table 2). Thisprocedure provided a def<strong>in</strong>ition <strong>of</strong> the effectiveness<strong>of</strong> each variety’s resistance to leaf rust <strong>in</strong> the field.<strong>The</strong> varieties were also evaluated as seedl<strong>in</strong>gs <strong>in</strong> thegreenhouse with selected P. tritic<strong>in</strong>a races to assessthe presence <strong>of</strong> effective race-specific genes. <strong>The</strong>varieties were then classified by type and level <strong>of</strong>genetic resistance to the current Mexican leaf rustpopulation. Trial data were obta<strong>in</strong>ed for 117 <strong>of</strong> the123 varieties. For an additional 67 varieties,supplementary data were available from previoustrials conducted by CIMMYT over several years <strong>in</strong> asimilar manner as described above. This resulted <strong>in</strong> atotal sample <strong>of</strong> 184 varieties.For several <strong>of</strong> these cultivars, the field symptoms <strong>of</strong>leaf rust were known <strong>in</strong> their respective areas fromregional or <strong>in</strong>ternational trial data. For thosecultivars where <strong>in</strong>formation was not known, theTable 2. Def<strong>in</strong>ition <strong>of</strong> the leaf rust resistance categories used<strong>in</strong> this study. † % leaf rust<strong>in</strong>fection relative toCategory susceptible check Type <strong>of</strong> resistance1 80 - 100 Susceptible2 50 - 79 Race-nonspecific, low resistance3 30 - 49 Race-nonspecific, moderate resistance ‡4 10 - 29 Race-nonspecific, high resistance ‡5 less than 10 Race-nonspecific, high resistance ‡6 less than 5 Effective race-specific resistance†Based on the modified Cobb Scale (Peterson et al. 1948).‡Race-nonspecific categories 3 to 5 should survive most leaf rust epidemics.4<strong>The</strong> nations <strong>of</strong> Central Asia and the Caucasus were not yet <strong>in</strong>cluded <strong>in</strong> these surveys, because they were not yet<strong>in</strong>cluded <strong>in</strong> CIMMYT’s mandate area.5Of the 36 countries, Lebanon reported no spr<strong>in</strong>g bread wheat and no areas were reported for Libya.14