

The Economic Impact in Developing Countries of ... - AgEcon Search
The Economic Impact in Developing Countries of ... - AgEcon Search
The Economic Impact in Developing Countries of ... - AgEcon Search
- No tags were found...

Create successful ePaper yourself
Turn your PDF publications into a flip-book with our unique Google optimized e-Paper software.
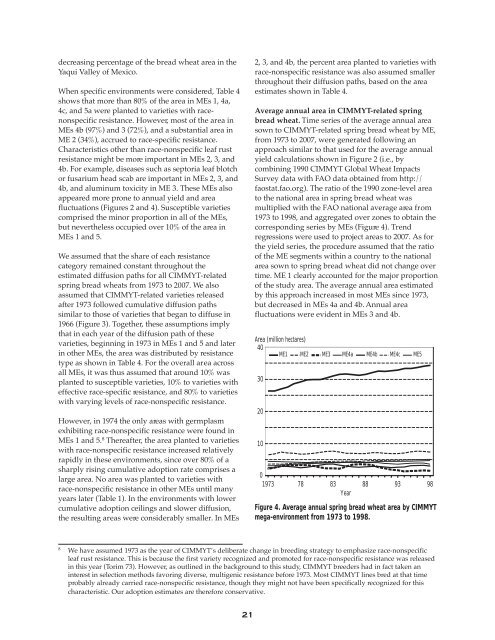
decreas<strong>in</strong>g percentage <strong>of</strong> the bread wheat area <strong>in</strong> theYaqui Valley <strong>of</strong> Mexico.When specific environments were considered, Table 4shows that more than 80% <strong>of</strong> the area <strong>in</strong> MEs 1, 4a,4c, and 5a were planted to varieties with racenonspecificresistance. However, most <strong>of</strong> the area <strong>in</strong>MEs 4b (97%) and 3 (72%), and a substantial area <strong>in</strong>ME 2 (34%), accrued to race-specific resistance.Characteristics other than race-nonspecific leaf rustresistance might be more important <strong>in</strong> MEs 2, 3, and4b. For example, diseases such as septoria leaf blotchor fusarium head scab are important <strong>in</strong> MEs 2, 3, and4b, and alum<strong>in</strong>um toxicity <strong>in</strong> ME 3. <strong>The</strong>se MEs alsoappeared more prone to annual yield and areafluctuations (Figures 2 and 4). Susceptible varietiescomprised the m<strong>in</strong>or proportion <strong>in</strong> all <strong>of</strong> the MEs,but nevertheless occupied over 10% <strong>of</strong> the area <strong>in</strong>MEs 1 and 5.We assumed that the share <strong>of</strong> each resistancecategory rema<strong>in</strong>ed constant throughout theestimated diffusion paths for all CIMMYT-relatedspr<strong>in</strong>g bread wheats from 1973 to 2007. We alsoassumed that CIMMYT-related varieties releasedafter 1973 followed cumulative diffusion pathssimilar to those <strong>of</strong> varieties that began to diffuse <strong>in</strong>1966 (Figure 3). Together, these assumptions implythat <strong>in</strong> each year <strong>of</strong> the diffusion path <strong>of</strong> thesevarieties, beg<strong>in</strong>n<strong>in</strong>g <strong>in</strong> 1973 <strong>in</strong> MEs 1 and 5 and later<strong>in</strong> other MEs, the area was distributed by resistancetype as shown <strong>in</strong> Table 4. For the overall area acrossall MEs, it was thus assumed that around 10% wasplanted to susceptible varieties, 10% to varieties witheffective race-specific resistance, and 80% to varietieswith vary<strong>in</strong>g levels <strong>of</strong> race-nonspecific resistance.However, <strong>in</strong> 1974 the only areas with germplasmexhibit<strong>in</strong>g race-nonspecific resistance were found <strong>in</strong>MEs 1 and 5. 8 <strong>The</strong>reafter, the area planted to varietieswith race-nonspecific resistance <strong>in</strong>creased relativelyrapidly <strong>in</strong> these environments, s<strong>in</strong>ce over 80% <strong>of</strong> asharply ris<strong>in</strong>g cumulative adoption rate comprises alarge area. No area was planted to varieties withrace-nonspecific resistance <strong>in</strong> other MEs until manyyears later (Table 1). In the environments with lowercumulative adoption ceil<strong>in</strong>gs and slower diffusion,the result<strong>in</strong>g areas were considerably smaller. In MEs2, 3, and 4b, the percent area planted to varieties withrace-nonspecific resistance was also assumed smallerthroughout their diffusion paths, based on the areaestimates shown <strong>in</strong> Table 4.Average annual area <strong>in</strong> CIMMYT-related spr<strong>in</strong>gbread wheat. Time series <strong>of</strong> the average annual areasown to CIMMYT-related spr<strong>in</strong>g bread wheat by ME,from 1973 to 2007, were generated follow<strong>in</strong>g anapproach similar to that used for the average annualyield calculations shown <strong>in</strong> Figure 2 (i.e., bycomb<strong>in</strong><strong>in</strong>g 1990 CIMMYT Global Wheat <strong>Impact</strong>sSurvey data with FAO data obta<strong>in</strong>ed from http://faostat.fao.org). <strong>The</strong> ratio <strong>of</strong> the 1990 zone-level areato the national area <strong>in</strong> spr<strong>in</strong>g bread wheat wasmultiplied with the FAO national average area from1973 to 1998, and aggregated over zones to obta<strong>in</strong> thecorrespond<strong>in</strong>g series by MEs (Figure 4). Trendregressions were used to project areas to 2007. As forthe yield series, the procedure assumed that the ratio<strong>of</strong> the ME segments with<strong>in</strong> a country to the nationalarea sown to spr<strong>in</strong>g bread wheat did not change overtime. ME 1 clearly accounted for the major proportion<strong>of</strong> the study area. <strong>The</strong> average annual area estimatedby this approach <strong>in</strong>creased <strong>in</strong> most MEs s<strong>in</strong>ce 1973,but decreased <strong>in</strong> MEs 4a and 4b. Annual areafluctuations were evident <strong>in</strong> MEs 3 and 4b.Area (million hectares)40ME1 ME2 ME3 ME4a ME4b ME4c ME530201001973 78 83 88 93 98YearFigure 4. Average annual spr<strong>in</strong>g bread wheat area by CIMMYTmega-environment from 1973 to 1998.8We have assumed 1973 as the year <strong>of</strong> CIMMYT’s deliberate change <strong>in</strong> breed<strong>in</strong>g strategy to emphasize race-nonspecificleaf rust resistance. This is because the first variety recognized and promoted for race-nonspecific resistance was released<strong>in</strong> this year (Torim 73). However, as outl<strong>in</strong>ed <strong>in</strong> the background to this study, CIMMYT breeders had <strong>in</strong> fact taken an<strong>in</strong>terest <strong>in</strong> selection methods favor<strong>in</strong>g diverse, multigenic resistance before 1973. Most CIMMYT l<strong>in</strong>es bred at that timeprobably already carried race-nonspecific resistance, though they might not have been specifically recognized for thischaracteristic. Our adoption estimates are therefore conservative.21


