ACOUSTIC THEORY OF SPEECH PRODUCTION ... - Ling.cam.ac.uk
ACOUSTIC THEORY OF SPEECH PRODUCTION ... - Ling.cam.ac.uk
ACOUSTIC THEORY OF SPEECH PRODUCTION ... - Ling.cam.ac.uk

You also want an ePaper? Increase the reach of your titles
YUMPU automatically turns print PDFs into web optimized ePapers that Google loves.
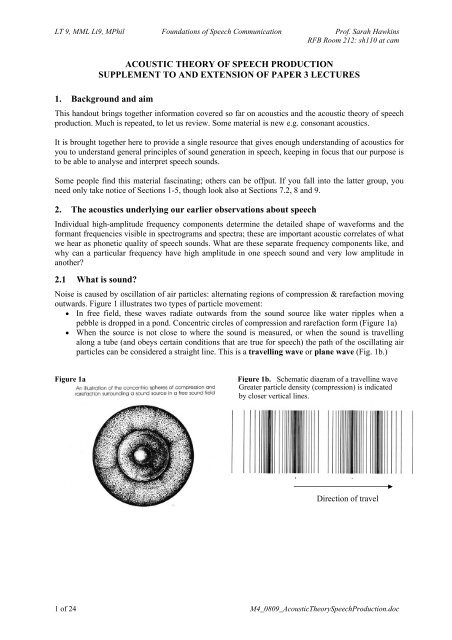
LT 9, MML Li9, MPhil Foundations of Speech Communication Prof. Sarah HawkinsRFB Room 212: sh110 at <strong>cam</strong><strong>ACOUSTIC</strong> <strong>THEORY</strong> <strong>OF</strong> <strong>SPEECH</strong> <strong>PRODUCTION</strong>SUPPLEMENT TO AND EXTENSION <strong>OF</strong> PAPER 3 LECTURES1. B<strong>ac</strong>kground and aimThis handout brings together information covered so far on <strong>ac</strong>oustics and the <strong>ac</strong>oustic theory of speechproduction. Much is repeated, to let us review. Some material is new e.g. consonant <strong>ac</strong>oustics.It is brought together here to provide a single resource that gives enough understanding of <strong>ac</strong>oustics foryou to understand general principles of sound generation in speech, keeping in focus that our purpose isto be able to analyse and interpret speech sounds.Some people find this material fascinating; others can be offput. If you fall into the latter group, youneed only take notice of Sections 1-5, though look also at Sections 7.2, 8 and 9.2. The <strong>ac</strong>oustics underlying our earlier observations about speechIndividual high-amplitude frequency components determine the detailed shape of waveforms and theformant frequencies visible in spectrograms and spectra; these are important <strong>ac</strong>oustic correlates of whatwe hear as phonetic quality of speech sounds. What are these separate frequency components like, andwhy can a particular frequency have high amplitude in one speech sound and very low amplitude inanother?2.1 What is sound?Noise is caused by oscillation of air particles: alternating regions of compression & raref<strong>ac</strong>tion movingoutwards. Figure 1 illustrates two types of particle movement:• In free field, these waves radiate outwards from the sound source like water ripples when apebble is dropped in a pond. Concentric circles of compression and raref<strong>ac</strong>tion form (Figure 1a)• When the source is not close to where the sound is measured, or when the sound is travellingalong a tube (and obeys certain conditions that are true for speech) the path of the oscillating airparticles can be considered a straight line. This is a travelling wave or plane wave (Fig. 1b.)Figure 1aFigure 1b. Schematic diagram of a travelling waveGreater particle density (compression) is indicatedby closer vertical lines.Direction of travel1 of 24 M4_0809_AcousticTheorySpeechProduction.doc
2 of 24 Paper 9 etc: AcThSpProd2.2 Sound at a single frequency: sine waves and simple harmonic motionFigure 2. At their simplest, these particle oscillations aresymmetrical around the centre point, like the route describedby the end of a pendulum. The route taken by the end of thependulum can be described in terms of progress at a constantrate around a circle, rather than a b<strong>ac</strong>k and forth movement:this is called simple harmonic motion (SHM): the linearprojection of circular movement.Another way to think about SHM: as the shadow, projected against awall, of a tall funnel on a toy train as it moves once round a circulartr<strong>ac</strong>k. See demo.SHM is the simplest form of movement that gives rise to sound. Such sounds are called sine waves:their shape is described by the sines of the angles formed as a point progresses round the 360° cycle at <strong>ac</strong>onstant rate. A sine wave has only one frequency. (All other sounds are complex waves.)E<strong>ac</strong>h sine wave can be completely described in terms of its• frequency number of complete cycles per second; measured in Hertz (Hz); psych. experience ≅ pitch.• amplitude extent of vibration or displ<strong>ac</strong>ement; various measures e.g. volts; psych. experience ≅ loudness.• phase point in the 360° cycle where a sine wave starts, relative to another sine wave; used to describethe relative timing of two sine wavesLike any periodic complex wave, e<strong>ac</strong>h sine wave also has a• period duration of one complete cycle: 1/f (f =frequency): 100 Hz cycle = 10 ms period; 125 Hz = 8 ms• wavelength distance between equivalent points in two adj<strong>ac</strong>ent periods; i.e. distance travelled in one cycle:c/f (c = speed of sound in a medium); lower-frequency sounds have longer wavelengths.Figure 3.The spectrum of a sine wave thus has a single frequency component (of a particular amplitude).ampampfreqfreqAssuming the axes are on the same scale, the right hand spectrum shows a sine wave with about twicethe frequency and two-thirds the amplitude of that in the left hand spectrum.M4_0809_AcousticTheorySpeechProduction.doc
Paper 9 etc: M4_AcThSpProd 3 of 24Figure 4. Sinusoidal oscillation of air particles can be described in different ways, as:• displ<strong>ac</strong>ement• velocity• <strong>ac</strong>celeration• instantaneous sound pressure• Acceleration leads velocity by90°; velocity leads displ<strong>ac</strong>ementby 90°.• When the particle is close to thesource, displ<strong>ac</strong>ement is in phase(0°) with the source.• For a plane wave which has noreflections, instantaneous soundpressure is in phase with particlevelocity.• When the sound is in a resonatorsuch as a tube, there arereflections from the ends of thetube, and then velocity andpressure are out of phase. This isimportant in creating formant, orresonant frequencies, as we seelater.2.3 Combining sine waves by adding them togetherWhen sine waves are combined, the resultant wave can be calculated simply by adding the amplitudesof the two waves at enough points in time to allow the new waveform to be plotted.When sine waves of the same frequency are combined, the result is another sine wave.Figure 5. Combination of sinusoids of the samefrequency. In (a), (b) and (c) the top twosinusoids (1 & 2) are added, thus forming thelower one (R) . The amplitudes of (1) and (2) areidentical, but have a phase difference of 0°, 90°and 180° in (a), (b) and (c) respectively.This figure shows that when all component sinewaves have the same frequency, another sinewave results, usually with a different amplitudeand phase. The frequency remains the same.Or else silence results….just when the twowaves have identical amplitudes and frequenciesbut are 180° out of phase.M4_0809_AcousticTheorySpeechProduction.doc
4 of 24 Paper 9 etc: AcThSpProdWhen sine waves of different frequencies are combined, the result is a complex wave – so calledbecause the waveshape is complex compared with that of a sine wave.Figure 6. When the sine waves to be added together have different frequencies, the result is a complex wave: thatis, e<strong>ac</strong>h frequency is preserved in the resultant wave. The waveshape of this complex wave depends onthe relative frequency, amplitude and phase of e<strong>ac</strong>h component sine wave. Top left panel (from Fry)shows two sine waves. Adding the amplitudes together by simply summing the two amplitudes atsuitable points in time (remembering the positive or negative sign of e<strong>ac</strong>h) produces the complex wavesat the bottom left. This is like an [u] sound. The right panel (Fig. 1.5 from Johnson) is a complex periodicwaves composed of a 100 Hz sine wave and 1,000 Hz sine waves. One cycle of the fundamentalfrequency (f0) is labelled. The waveshape of this is rather like an [i] sound, although the frequencies aretoo low to have come from a human vocal tr<strong>ac</strong>t: what would they be for a human [i]?2.4 Making periodic and aperiodic complex wavesWhen the component frequencies are related such that higher frequencies are integer (whole-number)multiples of the lowest one, then the complex waveform is periodic, and we hear a pitch.E<strong>ac</strong>h component frequency is called a harmonic. The lowest is H1; next is H2 = 2 (H1). H3 = 3 (H1).The highest common f<strong>ac</strong>tor of the harmonics (normally, the lowest frequency) is the fundamentalfrequency (f0, = H1). It is f0 that determines the period of the complex waves.Under most conditions, the perceived pitch is directly related to the fundamental frequency.The f0 does not have to be physically present in a periodic complex wave in order for us to hear itspitch.This has interesting implications for hearing, and how the ear/brain processes sound to hear pitch. Butfor speech, the way the vocal fold vibrate means that f0 is always the lowest frequency component ofthe periodic glottal waveform.M4_0809_AcousticTheorySpeechProduction.doc
Paper 9 etc: M4_AcThSpProd 5 of 24Table 1. Harmonic components in three different (periodic) complex waves, two with f0 = 100 Hz, onewith f0 = 200 Hz.Component frequencies (Hz)H7 700 1400 700H6 600 1200H5 500 1000 500H4 400 800 400H3 300 600 300H2 200 400 200H1 (f0) 100 200Amplitude and phase changes in the components of a complex wave affect its shape but not its periodi.e. not its fundamental frequency.Most complex waves in the natural world contain many frequencies that are not mathematically relatedin any way. Such random combinations of frequencies produce aperiodic waveforms, with no regularlyrepeating pattern in the waveshape (thus no period) and no true pitch.The dft spectra of Figures 2 and 3 in handout lab3_M08_SpeechandSpectralAnalysis show the f0 andthe harmonic frequencies of the vowels they are taken from.If we were to plot the spectrum of an aperiodic speech waveform, there would be no harmonicfrequencies, and we would normally plot only the spectral envelope. This is done by using the Long-Term Average (LTA) spectrum (which is really the average of a succession of spectra with short timewindows taken over the duration of the aperiodicity, as if stepping through it. Usually, successivespectra used in this way overlap one another. Thus an LTA spectrum smooths out any temporaryrandom fluctuation in the spectrum.)3. The basics of resonanceWhy can a particular frequency have high amplitude in one speech sound and very low amplitude inanother?It is because the complex wave travels through a tube (the vocal tr<strong>ac</strong>t), which <strong>ac</strong>ts as a resonator.Resonance can be defined as vibration of an object at its natural frequency (or frequencies) in responseto the same or similar frequencies applied by a driving force (either transient (impulse) or continuous).A driving force is an external source of sound. Frequencies in the external sound that are close to theresonance frequencies of the object will be amplified, because it takes least energy to move the airparticles at those frequencies i.e. there’s a large sound output for a small input of energy.You can check this by singing a glissando into a bottle or a tube. Certain pitches will sound louder thanothers. When they sound loud, you will feel the bottle vibrate: it is resonating in sympathy with theexcitation from your voice. Tubes/bottles of different lengths and shapes resonate at differentfrequencies. A resonator’s natural frequencies can be calculated using well-understood principles.Likewise, as the vocal tr<strong>ac</strong>t changes shape, or the sound source changes from the glottis to somewherein the oral cavity, then the resonance or formant frequencies change.3.1 Bandwidth and damping of resonance frequenciesObjects vary in what frequencies they respond to, and how strongly they respond.Bandwidth: the frequency range over which an object will respondDamping: how quickly the object’s response dies away after excitation by a single impulse.When the input is an impluse:narrow-bandwith response — lightly damped (e.g. tuning fork); high amplitude; response rings onwide-bandwidth response — heavily damped (e.g. table); low amplitude; short responseM4_0809_AcousticTheorySpeechProduction.doc
6 of 24 Paper 9 etc: AcThSpProdFigure 7. Left panel: Waveforms and spectral envelopes from narrow-bandwidth (N) and widebandwidth(W) systems excited by a single impulse. The single impulse produces a sound that diesaway, hence the waveforms are of the decaying sinusoidal waveform that would be produced by e<strong>ac</strong>hresonator. The narrowband one is lightly damped; the wideband one is heavily damped.Right panel: The effect on the resultant waveform of passing a second impulse, 7.5 ms after the firstone, through the same resonators as in the upper panel. The narrowband filter produces continuoussound; the wideband filter produces discrete sounds, heard as clicks.Figure 8. Spectra showing resonancecurves for lightly damped (narrowbandwidth) and highly damped (widebandwidth) systems, responding to thethe same sound input.This is what is found in speech: for thesame centre frequency and amplitude ofthe input sound, a wide-bandwidthspectral prominence is normally muchlower in amplitude than a narrowbandwidth prominence.Wide bandwidths are associated withnasal and lateral sounds i.e. whenevertwo cavities are “in parallel”.In less technical language:• a narrowband system “rings on”: it “sees” frequencies very well, but is vague about time• a wideband system decays quickly: it discriminates poorly between similar frequencies, but isprecise about the time at which a sound happensThat is, frequency and temporal resolution are inversely related:• narrowband: good frequency resolution, poor temporal resolution• wideband: poor frequency resolution, good temporal resolutionResonances are regions of extra intensity in the frequency spectrum, so they appear as:• prominent regions in a spectrum (showing amplitude x frequency);• bl<strong>ac</strong>k bars in a wide-band spectrogram (showing frequency x time, with amplitude as bl<strong>ac</strong>kness).Resonances in speech are called formants. They are labelled F1, F2, F3, etc, starting with the lowestfrequency.M4_0809_AcousticTheorySpeechProduction.doc
Paper 9 etc: M4_AcThSpProd 7 of 24E<strong>ac</strong>h resonance, or formant, is described in terms of its centre frequency, amplitude, and bandwidth.How it <strong>ac</strong>tually appears in a spectrum or spectrogram depends also on the properties of the filter systemused to make the spectrum/spectrogram.Consider only voiced speech sounds, which have complex periodic waveforms (from vocal foldvibration), and hence, by definition, a fundamental frequency f0 and harmonics. The lowest f0 is likelyto be greater than 80 Hz:• Narrow-bandwidth sgm has a bandwidth of c. 45 Hz. It shows f0 and harmonic components(more-or-less horizontal stripes), but not precise temporal events.• Wide-bandwidth sgm has a bandwidth of c. 300 Hz. It shows only broad regions of resonance,but precise temporal events (e<strong>ac</strong>h short-term vertical striation reflects a single glottal pulse(vocal-fold vibration).INTERIM SUMMARY: THE BASICSSound is either periodic the same pattern repeats more or less regularly: phonated sounds like [i ɑ u].or aperiodic there is no regularly repeating pattern: voiceless sounds lie [s].A sine wave is periodic but has only one frequency.A complex wave comprises two or more frequencies. All speech sounds are complex, and all havemany frequencies.If a complex wave is periodic, then its components are harmonics.(If there are a few nonharmonic frequencies (enharmonic partials) amongs the harmonic partials, thenthe signal is almost periodic, or quasi-periodic.)Table 2TYPES <strong>OF</strong> COMPLEX WAVEDefinitionPropertiesIn speechPeriodicRegularly repeating waveform i.e. repeatedcycles of the same shape.The waveform comprises a fundamentalfrequency (f0) and harmonic frequencies(nf0). The harmonics are integer multiples ofthe f0. Thus f0 is the slowest component, andalso the highest common denominator of theharmonics. We hear a pitch.Voiced sounds e.g. vowels, nasals.Produced at the glottis (phonation)AperiodicIrregular waveform; i.e. no cyclic repetition.Has components at non-integer multiples ofthe lowest frequency (i.e. there is no f0, andno true pitch).Voiceless sounds e.g. /f, s, p, t/.Produced at the glottis (aspiration noise)or above the glottis (frication noise)E<strong>ac</strong>h periodic waveform in a speech signal contains many frequencies because the laryngeal soundsource contains many frequencies. The frequencies with the greatest amplitudes—usually the formants,or resonance frequencies—can normally be seen and measured in the waveform, spectrogram, andspectrum. Because e<strong>ac</strong>h speech sound has distinctive formant frequencies, it also has a distinctivechar<strong>ac</strong>teristic waveshape (pattern).Resonance is fundamental to speech <strong>ac</strong>oustics because most differences in phonetic quality stem fromdifferences in resonance patterns of the vocal tr<strong>ac</strong>t as it changes shape. Thus we study the resonanceproperties of tubes, representing a simplified model of the vocal tr<strong>ac</strong>t. The length and shape of the vocaltr<strong>ac</strong>t are the main determinants of the formant frequencies of speech soundsM4_0809_AcousticTheorySpeechProduction.doc
8 of 24 Paper 9 etc: AcThSpProd4. The Acoustic Theory of Speech Production [Gunnar Fant & others c.1950-60]sourcevocal tr<strong>ac</strong>t transferfunctionradiationchar<strong>ac</strong>teristicoutput(sound pressure)Examples of different types of source and vocal tr<strong>ac</strong>t shape. (Mid-sagittal sections)[e][s][m]output locationsound sourceOutput depends on:1. Source spectrum:• periodic (narrow/complete constriction at glottis → regular vocal fold vibration)• aperiodic (incomplete laryngeal or supralaryngeal constriction → turbulence noise)• mixed (periodic (phonated/voiced) + turbulence noise)2. Transfer function: determined by length and shape of vocal tr<strong>ac</strong>ta. vocal tr<strong>ac</strong>t length – longer vocal tr<strong>ac</strong>ts have lower natural frequencies (i.e. resonances)b. vocal tr<strong>ac</strong>t shape – strictly, the cross-sectional area at e<strong>ac</strong>h point along the VT, simplymodelled as the cross-sectional area at the point or points of maximal constriction3. Radiation function: attenuates low frequencies as they emerge at the lips (c. +6 dB per octave)A resonator <strong>ac</strong>ts as a filter on the original source of sound. Think of it as rearranging the input energy sothat frequencies that are at or near the resonance frequencies are amplified, at the expense of thosefrequencies that are not near the resonance frequencies.Figure 9 illustrates these principles. It shows spectra of• the glottal source (periodic, dropping off at -12 dB per octave for modal voice)• the vocal tr<strong>ac</strong>t transfer function, when the vocal tr<strong>ac</strong>t is unconstricted, as for schwa.• the radiation function (as the sound emerges at the lips: always the same: +6 dB per octave)• the final output spectrumRadiation functiondBLog. frequencyAt its simplest, just think about the process as one of melding a series of independent patterns so thatthe final pattern shows the combined influence of all of the initial and intermediate patterns.M4_0809_AcousticTheorySpeechProduction.doc
Paper 9 etc: M4_AcThSpProd 9 of 24Figure 10. Upper panels, left to right. A glottal source spectrum with f0 = 100 Hz. An idealizedtransfer function for an unconstricted tube of about 17 cm: this has formant frequencies at about 500Hz, 1500 Hz, and 2500 Hz, and sounds like schwa. The output spectrum. Lower panels, left to right.The same, except that the f0 of the glottal source is 200 Hz. Formant definition is not so clear. Thinkabout what this could mean for intelligibility at high fundamentals.5. Resonance in more detailResonance is fundamental to speech <strong>ac</strong>oustics because most differences in phonetic quality stem fromdifferences in resonance patterns of the vocal tr<strong>ac</strong>t (VT) as it changes shape. We study the resonanceproperties of tubes, representing a simplified model of the vocal tr<strong>ac</strong>t.Two types of tube are relevant: bottle-shaped tubes, and straight-sided tubes. Most speech sounds arebest modelled using a series of straight-sided tubes. Bottle-shaped tubes model only some special casesin speech, but as they are more familiar, we start with them.5.1 Helmholtz resonators: cavities with narrow necks e.g. bottles.They give a single resonance whose frequency depends on the relationship between the <strong>ac</strong>oustic mass(the plug of air in the neck) and compliance (the relatively springy particles in the body of the bottle) inthe system. Helmholtz resonances in speech are always low frequency and only occur in special cases,e.g. lowest resonance (F1) of high vowels ([i u]). (Narrow mouth opening with one or two large cavitiesbehind it.)Figure 11. Some Helmholtz resonators:masscompliance(springiness)Formula: only bother with it if you want to!Resonance frequency = c2πAVlwhere c = speed of sound in [air]A = cross-sectional area of neckV = volume of bottle area (b<strong>ac</strong>k cavity)l = length of neckModel for [i]:a single HelmholtzresonatorDraw the model for [u] hereas two Helmholtz resonators:M4_0809_AcousticTheorySpeechProduction.doc
10 of 24 Paper 9 etc: AcThSpProd5.2 Simple tubes of uniform cross-sectional areaThe tube shape with the most general application to speech is a straight tube of uniform cross-sectionalarea—i.e. no constrictions. The vocal-tr<strong>ac</strong>t shape for schwa ([´]) can be modelled as a single suchunconstricted tube:Figure 12closed end: glottisopen end: lipsVocal tr<strong>ac</strong>t (VT) shapes for all other sounds must be modelled by more than one tube, because theyinvolve at least one constriction, but the principles are essentially the same.6. What causes resonance in a straight-sided tube?For ideal tubes of uniform cross-sectional area, resonance arises whenstanding waves of pressure (and velocity) occur.A small volume of air in a tube can have a velocity (hence kinetic energy); it can also be compressedand expanded so that there are variations in sound pressure (hence in potential energy). A wave ofsound pressure or velocity travelling down a tube is called a travelling, or plane wave. In an ordinarytravelling wave of any given frequency, velocity and pressure (kinetic and potential energy) fluctuatetogether, either 0° or 180° out of phase.When a sound wave travels down a tube, it is reflected b<strong>ac</strong>k upon re<strong>ac</strong>hing the end of the tube. Cf.slinky spring.Reflections occur because the ends of tubes form <strong>ac</strong>oustic boundaries. (There are <strong>ac</strong>oustic boundarieseven when a tube’s ends are open enough to allow air to flow out, as the lips are in the production of avowel. Compare the way it can be hard to hear someone who’s talking inside a car with the windowopen, when you are outside the car.)All travelling waves in a tube are reflected from the ends. The amplitude of the incident (→) andreflected (←) waves sum to give the overall pattern of pressure and velocity fluctuation.Reflections of waves at most frequencies tend to create complex but variable patterns that do not exciteresonances. But at certain frequencies, the pattern of incident and reflected waves sums to a simplepattern whose peak amplitude at any given pl<strong>ac</strong>e in the tube is maintained (“stands still”) over time.Hence the term standing waves.Standing waves thus arise when incident (→) and reflected (←) waves sum in such a way that:• their combined peak amplitude is constant over time at any one point in the tube, but• there are differences in peak amplitude at different pl<strong>ac</strong>es in the tube.There are only certain frequencies at which this can happen in any given tube (of uniform crosssectionalarea). In order for it to happen, the the wavelength of the sound must be the right length tofulfil certain boundary conditions.M4_0809_AcousticTheorySpeechProduction.doc
Paper 9 etc: M4_AcThSpProd 11 of 24Figure 13: Review: Relationship between wavelength and frequencyAB0.01 0.02 0.03 0.04 0.05 0.06 0.07 0.08 0.09 0.10 0.11time(s)Wavelength = distance (cm) travelled in one cycleThus, wavelength depends on speed of sound (referred to as c)In air, c = 34000 cm/sWavelength = c/frequencyThus, higher frequencies (e.g. A) have shorter wavelengths than lower frequencies (e.g. B).)6.1 Boundary conditionsWhen the wavelength of a sound is the right length to fulfill these boundary conditions, the sound willkeep being reflected by e<strong>ac</strong>h end of the tube (it will keep bouncing b<strong>ac</strong>k and forth along it) and it willbe amplified because it takes less energy to move the air particles. A frequency at which thisamplification arises is a resonance frequency.You can think of it as happening when the boundary conditions are such that the particular frequencykeeps bouncing b<strong>ac</strong>k and forth along the tube, reinforcing itself as it goes, rather than causing randomfluctuation or cancelling itself out as it goes b<strong>ac</strong>k and forth. More technically, reinforcement rather thanrandom fluctuation or cancellation takes pl<strong>ac</strong>e when the boundary conditions cause pressure andvelocity waves of the same frequency to become 90° rather than 0° out of phase.The boundary conditions necessary for standing waves to occur depend on the state of the tube's ends.closed end: pressure maximum;open end: pressure minimumL = length of tubei.e.,Lwhen the end is closed, pressure must be at a maximum (velocity at a minimum);when the end is open, pressure must be at a minimum (velocity at a maximum).For a tube of uniform cross-sectional area that is closed at one end and open at the other, the lowestfrequency that meets these boundary conditions has a wavelength 4 times the length of the tube: i.e. onequarter of one period of this particular sine wave fits into the tube such that it meets the boundaryconditions of having a pressure maximum at the closed end, and a pressure minimum at the open end.relative amplitudeof pressure+10-1Lamplitude envelope of loweststanding wave of pressure,which is a ¼ wavelength of asinusoidal sound wave.Only the upper (positive) half of theenvelope need be shown, since the upperand lower parts are symmetrical.M4_0809_AcousticTheorySpeechProduction.doc
12 of 24 Paper 9 etc: AcThSpProdFigure 14. The three lowestfrequencypressure waves thatmeet the boundary ocnditionsfor resonating in anunconstricted vocal tr<strong>ac</strong>t as inschwa. They are labeled F1,F2 and F3 for vowel formants1, 2 and 3.The formula for the lowestresonance of such a tube isF1 = c where c = speed of sound (c. 34,000 cm/s in air);4LL = length of tube (16-17 cm for a man; c. 14 cm for a woman.)in speech, L represents distance from glottis;glottis is modelled as closed; lips are modelled as openSuccessively higher resonances occur at odd-number integer multiples:F2 = 3c , F3 = 5c & so on.4L4LWork out that this must be so if the above statements are right. Check your reasoning vs. Figure 15.Figure 15. Amplitude envelopes of standing waves of velocity for a tube of uniform cross-sectional area,closed at one end, open at the other. Draw in the standing waves of pressure for yourself. (They are 90° out ofphase with velocity (see last point in Figure 4), so should have maxima at the closed end, minima at the open end.)|U(x)| = volume velocity (absolute value)SWP = standing wave pattern in this Figure(not “of pressure”)A tube that is closed at one end and open atthe other is called a “quarter-waveresonator”.An average man’s vocal tr<strong>ac</strong>t is 17 cm long,so for [ə], which is modelled as a singleunconstricted tube, his formant frequenciesare:F1 : 34,000 = 500 Hz4 x 17F2: 3(500) = 1500 HzF3: 5(500) = 2500 HzM4_0809_AcousticTheorySpeechProduction.doc
Paper 9 etc: M4_AcThSpProd 13 of 246.2 For a tube that is closed at both ends, or a tube that is open at both ends:The same boundary conditions apply: there must be a pressure maximum at a closed end, and aminimum at an open end. The lowest frequencies that meet these boundary conditions are shown inFigure 16.Figure 16. The lowest three standing waves of pressure for a tube that is closed at both ends (left) and one thatis open at both ends (right)tube:closed closed open openF1 = c2l+10-1L+10-1LF2 = 2c2l+10-1L+10-1LF3 = 3c2l+10-1L+10-1LWe call these tubes “half-wave resonators”.Half-wave resonator models are used for obstruent consonants, and for [i].7. Two ways to apply this information to speech1. tube models2. perturbation theory7.1 Tube modelsYou can estimate the formant frequencies of a given vocal-tr<strong>ac</strong>t shape if you know:(a) the overall length of the vocal tr<strong>ac</strong>t (glottis-to-lips);(b) how many tubes of uniform cross-sectional area reasonably approximate that shape (Usually 2for vowels and 2 or 3 for consonants. For 2 tubes, the b<strong>ac</strong>k cavity extends from the glottis to themajor constriction, and the front cavity from the major constriction to the lips. See below.)(c) what the <strong>ac</strong>oustic boundaries of e<strong>ac</strong>h tube are (closed or open).M4_0809_AcousticTheorySpeechProduction.doc
14 of 24 Paper 9 etc: AcThSpProdA constriction effectively divides the vocal tr<strong>ac</strong>t into two tubes, e<strong>ac</strong>h with its own resonancefrequencies.• the location of the major constriction in the vocal tr<strong>ac</strong>t determines the length of the front and b<strong>ac</strong>kcavities;• the cross-sectional area of one tube relative to the adj<strong>ac</strong>ent tube determines whether its ends aremodelled as closed or open. This principle is illustrated in Figure 17. It’s not crucial that youunderstand it, but if you do, then you can work out formant frequencies for yourself using a tubemodel of the VT.Figure 17: To determine boundary conditions: (c = closed; o = open)openclosed closed open c c o oThe type of boundary condition is what you would mainly see if you were inside one tube, looking outfrom one end (or, towards its end): mainly “closed” wall, or mainly “open” air.7.1.1 Examples for vowelsTwo tubes, e<strong>ac</strong>h of uniform cross-sectional area.Figure 18: Model for [ɑ]gLbcLflglcglottislipspoint (or region)of maximumconstrictionLb = length of b<strong>ac</strong>k cavity (glottis to point of maximum constriction)Lf = length of front cavity (point of maximum constriction to lips)Boundary conditions: both b<strong>ac</strong>k and front cavities are modelled as closed-open.So the quarter-wavelength model (as for schwa) is used for e<strong>ac</strong>h tube separately. Roughly:Lb = 7cmLf = 10cmc/4l 34000/28 = 1215 Hz34000/40 = 850 Hz3(c/4l) 3 (1215) = 3645 Hz 3 (850) = 2550 HzFirst 3 formant frequencies measured at lips for this vowel should be:F1 = 850 Hz (lowest front-cavity resonance)F2 = 1215 Hz (lowest b<strong>ac</strong>k-cavity resonance)F3 = 2550 Hz (second front-cavity resonance)These values are slightly high for an adult male, because the model is too simple to allow preciseprediction of formant values. But the general pattern of formants is right: for [ɑ], F1 is high and close toF2.M4_0809_AcousticTheorySpeechProduction.doc
Paper 9 etc: M4_AcThSpProd 15 of 24Figure 19: Model for [i]gclglcglottislipspoint (or region)of maximumconstriction[i]LbLfF1 is a Helmholtz resonance. (“Bottle-shaped” tube, with a single low resonance.)Higher formants: b<strong>ac</strong>k cavity: closed-closed; front cavity: open-open.Lb = 9 cmc/2l 34000/18 = 1890 HzLf = 8 cm34000/16 = 2125 HzThese formants are raised further in frequency because the b<strong>ac</strong>k cavity is tapered towards theconstriction, and a tapered end raises resonance frequencies.N.B. If you start calculating formant frequencies to see if you understand, don't give up if your answersdon't match real speech well. Rather, talk with your supervisor. Your calculations may be right, butyour estimates of tube lengths may be wrong, and additionally, a number of adjustments have to madeto match real speech (like fat in the cheek walls, warm moist air, overall VT shape in some specialcases......).7.1.2 ObstruentsFigure 20. Model for [s][s] Lb Lc LfThree cavities (tubes):• b<strong>ac</strong>k cavity: closed-closed• constriction: open-open• front cavity: closed-open.Lc = length of constriction (when it’s long enough, it <strong>ac</strong>ts as another tube with its own resonances)The b<strong>ac</strong>k cavity is excited relatively little by a supralaryngeal noise source, and the amplitudes of itsresonances are further reduced by antiformants (zeros) arising from inter<strong>ac</strong>tions between front and b<strong>ac</strong>kcavity resonances. Therefore, the b<strong>ac</strong>k cavity contributes little to the output.Greater <strong>ac</strong>cur<strong>ac</strong>y is <strong>ac</strong>hieved when other f<strong>ac</strong>tors are taken into <strong>ac</strong>count (eg length of constriction, shapeof b<strong>ac</strong>k cavity near constriction, wall compliance, whether the airstream hits a sharp edge like teeth).M4_0809_AcousticTheorySpeechProduction.doc
16 of 24 Paper 9 etc: AcThSpProdThus, for a voiceless obstruent like [s], source and transfer functions combine as inFigure 21ampNoise source (supralaryngeal except for [h] )frequencyampTransfer function(for the [s] vocal tr<strong>ac</strong>t shape shown above)frequencyampRadiation function (+6 dB per octave)log. frequencyampOutput spectrumfrequencyM4_0809_AcousticTheorySpeechProduction.doc
Paper 9 etc: M4_AcThSpProd 17 of 247.2 Perturbation theoryYou can estimate the general shape and range of the vowel quadrilateral using perturbation theory. Thispredicts the effect on formant frequencies of squishing a tube (recall the electrolarynx and tube demo).The comparison is with the formant frequencies of the unconstricted tube. There are two basicprinciples:• if you constrict a tube at a pl<strong>ac</strong>e along its length where there is a minimum in a standing waveof pressure, then the frequency of the corresponding resonance will fall, relative to its frequencyin the unconstricted tube.• conversely, if you constrict a tube at a pl<strong>ac</strong>e along its length where there is a maximum in astanding wave of pressure, then the frequency of the corresponding resonance will rise, relativeto its frequency in the unconstricted tube.The main principles can be summarised as follows:Since most vowels can be adequately modelled using only the lowest two formants (relative to a fairlyconstant F3), then you can constrict the tube in different pl<strong>ac</strong>es such that you create all 4 possiblepatterns of change relative to their values in the unconstricted tube (schwa):F1 falls and F2 falls in frequencyF1 falls and F2 risesF1 rises and F2 fallsF1 rises and F2 risesIn a 17 cm vocal tr<strong>ac</strong>t, F1 for schwa is about 500 Hz (c/4L), and F2 is about 3(500) = 1500 Hz.So, constricting the tube will produce changes that shift F1 away from 500 Hz (up or down) and F2away from 1500 Hz (up or down).Figure 22.∆ (delta) is the standard symbol meaning “change in” the variable being measured. In Figure 22 andhereafter, ∆F means the change in frequency of a formant above (+) or below (-) a reference frequency,which in this case is the formant frequency that would be the case in an unconstricted tube .M4_0809_AcousticTheorySpeechProduction.doc
18 of 24 Paper 9 etc: AcThSpProdFigure 23. Effects on formant frequencies of changes in vocal-tr<strong>ac</strong>t shape away from schwaMaking a local constriction in a tube of uniform cross-sectional area has the following results, relativeto the natural frequencies of schwa (the unconstricted tube):• Constriction at a pressure minimum (points x above) → decrease in natural frequency relativeto that of schwa (the unconstrictied condition)• Constriction at a pressure maximum (points y above) → increase in natural frequency• Widening the tube at these pl<strong>ac</strong>es causes the opposite change in natural frequency (an increaseif widened at a pressure minimum; a decrease if widened at a pressure maximum)• Changes in cross-sectional area midway between a pressure maximum and a pressure minimum(points z above) cause very little change in natural frequency.Changes in cross-sectional area at velocity maxima and minima cause the opposite effects from atpressure max and min: e.g. constrincting at a velocity maximum cause the natural frequency todecrease.So, for example, a constriction at the front of the tube will decrease all formant frequencies relative tothose of schwa (the unconstricted condition).Higher formant frequencies change little because their pressure maxima and minima are closely sp<strong>ac</strong>edin the vocal tr<strong>ac</strong>t, and, since most vocal-tr<strong>ac</strong>t constrictions extend 1-2 cm, both maxima and minimatend to be affected by changes in cross-sectional area, leading to a net change of zero.M4_0809_AcousticTheorySpeechProduction.doc
Paper 9 etc: M4_AcThSpProd 19 of 247.2.1 LIMITS ON THE VOWEL QUADRILATERAL USING PERTURBATION <strong>THEORY</strong>F1 and F2 frequencies change most (they have widely-sp<strong>ac</strong>ed maxima and minima).Four ways that F1 and F2 can change: both can go up; both down; F1 up and F2 down; F1 down and F2up. E<strong>ac</strong>h of these changes leads to a different quality of sound. By making the largest possible changes,we can approximate the four extreme vowels of the vowel quadrilateral.Figure 24M4_0809_AcousticTheorySpeechProduction.doc
20 of 24 Paper 9 etc: AcThSpProdM4_0809_AcousticTheorySpeechProduction.doc
Paper 9 etc: M4_AcThSpProd 21 of 24Figure 25.F2 high (> 1500 Hz)i1500uF2 low (< 1500 Hz)F1 low (< 500 Hz)ə500 HzaɑF1 high (> 500 Hz)The resultant frequencies of such constrictions can be calculated fairly precisely, but for our purposesit is enough to understand that, by making a constriction in the appropriate location along the tube,you can shift the formant frequencies of schwa so that you hear another vowel quality, as we did withthe electrolarynx and tube, and that the limits of such shifts for a given vocal tr<strong>ac</strong>t length define thelimits of the vowel quadrilateral.Other vowels can be added using various principles, for example:• “filling in” sp<strong>ac</strong>es between the extremes• nasalization (normally broadens and flattens spectral prominences in F1 region, tending tomake most nasalized vowels sound slightly centralized)• changing the lip rounding• changing duration, voice quality, etcAs you learn more about the <strong>ac</strong>oustics of speech sounds, this will begin to make a lot of sense. (E.g.youy know that lip rounding will lower formants. Think where a lip-rounded vowel will be in thequadrilateral relative to one that is identical but has spread lips.)M4_0809_AcousticTheorySpeechProduction.doc
22 of 24 Paper 9 etc: AcThSpProd8. Quantal theory: using <strong>ac</strong>oustic principles to predict why some sounds are morecommon than others in languagesFigure 26Part of schematic nomogram showing the change in frequency of lowest two resonance frequenciesof a two-tube model for vowels, as a function of length of b<strong>ac</strong>k cavity.freq (kHz)4F2 (BCR)F2 (FCR)32solid line: b<strong>ac</strong>k cavityresonancedotted line: front cavityresonance1F1 (FCR)xF1 (BCR)2 4 6 8 10 12 14Length of b<strong>ac</strong>k cavity, in cm1) At certain frequencies, F1 is associated with the b<strong>ac</strong>k cavity and F2 with the front cavity, and viceversa. The same principle applies to higher pairs of formants (eg F2 and F3).2) Formants cannot intersect; when close in frequency, they “push e<strong>ac</strong>h other apart” (at region x).Quantal Theory (Stevens 1989):Regions where formants “push e<strong>ac</strong>h other apart” are among the regions from which languages favourchoosing sounds. In these regions, fairly large variations in the length of the front and b<strong>ac</strong>k cavitiesresult in only small changes in the frequency of a formant, or pair of formants. Thus, a certain amountof articulatory “slop” can be tolerated, without compromising the <strong>ac</strong>oustic output.Proposed quantal sounds include:• Vowels in which two formants are close in frequency (eg high front vowels, high b<strong>ac</strong>k roundedvowels, low vowels)• Consonants where two formants are close in frequency during the transitions into and out of theconsonant (For velars, F2 and F3 – the “velar pinch”. For pharyngeals, F1 and F2. Forretroflexes, normally F3 and F4.)• Consonants produced with turbulence at a constriction (eg fricatives). The amplitude of thenoise source remains fairly constant over a wide range of constriction degrees (0.03 – 0.2 cm 2 ).Frication can be maintained stably as the articulators move into and out of a constriction.• Voice qualities: modal, breathy and pressedQuantal Theory is based on solid <strong>ac</strong>oustic theory and modelling (though for a limited range ofcontexts). There is support for some of its predictions from articulatory investigations.However, it is controversial, and is not complete as an <strong>ac</strong>count of sound systems:• Some “quantal” sounds are rare <strong>ac</strong>ross languages (eg retroflexes), and there are commonsounds that the theory doesn’t explain (e.g. alveolars).• Quantal Theory is narrow, whereas speech is a multif<strong>ac</strong>eted system that probably involvescompeting constraints. Lindblom (1989) argues that Quantal Theory wrongly focuses onthose sounds that contrast maximally with others; instead, the emphasis should be on“sufficient contrast”, combined with “economy of effort”.Nonetheless, Quantal Theory may explain certain basic contrasts in speech sounds well, and is worthdeveloping.M4_0809_AcousticTheorySpeechProduction.doc
Paper 9 etc: M4_AcThSpProd 23 of 249. Two special sounds9.1 [h]• A glottal fricative.• Source: aperiodic (turbulence noise)• Transfer function: excites the whole vocal tr<strong>ac</strong>t, therefore full formant structure• F1 may have a wider bandwidth, and be slightly higher than with voiced equivalent, because thetr<strong>ac</strong>hea can be coupled in to the system• Can be thought of as a voiceless vowel.• Also functions as aspiration noise at the release of voiceless stops9.2 [ɹ ɻ] and other retroflex sounds• Made with the tongue tip raised towards the palate.• When this small structure makes a short constriction just at a pressure minimum in a standingwave, it should lower the higher formants (F3, F4 and higher). Higher formants are normallyunaffected by longer constrictions, because the standing wave maxima and minima are closetogether, so both are equally affected by longer constrictions (see perturbation theory).• Lip rounding will further lower all formant frequencies.• (But, though this works well in outline, in reality it is much more complicated, at least for [ɹ].)M4_0809_AcousticTheorySpeechProduction.doc
24 of 24 Paper 9 etc: AcThSpProdReadingStandard – the pl<strong>ac</strong>e to startThe following are relatively nontechnical <strong>ac</strong>counts of <strong>ac</strong>oustics for phoneticians. They cover the samematerial with different appro<strong>ac</strong>hes and emphases. Read at least one—whichever suits you best. Othersare on your supervision reading list.Denes, P.B., and Pinson, E.N. (1973/1963). The Speech Chain. Murray Hill, NJ: Bell Telephone. Ch 3, 4.Clark, J., and Yallop, C. (1995/1990). Phonetics and Phonology. Oxford: Bl<strong>ac</strong>kwell. Ch 7.1-7.13.Pickett, J.M. (1999). The Acoustics of Speech Communication: Fuandmentals, Speech Perception Theory, andTechnology. Needham Heights, MA: Allyn & B<strong>ac</strong>on. Ch. 2-4Or Pickett, J.M. (1980) The Sounds of Speech Communication. Baltimore: University Park Press. Ch 1-4.Johnson, K. (1997). Acoustic and Auditory Phonetics. Oxford: Bl<strong>ac</strong>kwell. Chs. 1, 2, (3), 4, 5.Hayward, K. (2000). Experimental Phonetics. London: Longman. Chs. 2-4.Borden, J. & Harris, K.S. (1980) Speech Science Primer. Baltimore: Williams & Wilkins. Ch 3; ch 4 pp 89-130.Fry, D.B. (1979). The Physics of Speech. Cambridge: CUP. Ch 1-9.Rosen, S. and Howell, P. (1991). Signals and Systems for Speech and Hearing. Academic Press. Clearly writtenand relatively nontechnical, but much more detail than the above books. Try it if you enjoy more scientificappro<strong>ac</strong>hes. Relevant sections are spread over several chapters—find them in Table of Contents & Index.CD ROM. Speech Production and Perception 1. Sensimetrics. Available from MML Library front desk, foruse in CALL lab. Good for self-p<strong>ac</strong>ed, hands-on work in a number of areas—try it out.Advanced If you are very interested, or if your maths or physics is A level or better, then try some of these:Stevens, K.N. (1998) Acoustic Phonetics. Cambridge, MA: MIT Press. (The New Bible.)Fant, G. (1960) Acoustic Theory of Speech Production.The Hague, Netherlands: Mouton. (The Old Bible.)Fant, G. (1968) Analysis and synthesis of speech processes. In B. Malmberg, B. (ed.) (1968). Manual ofPhonetics. Amsterdam: North Holland. Most of the chapter is a short version of the <strong>ac</strong>oustic theory ofspeech production—excellent, but technical. pp 236-253 provides excellent spectrographic material.Hardcastle, W.J., and Laver, J. (1997). Handbook of the Phonetic Sciences. Oxford: Bl<strong>ac</strong>kwell. Ch 3 AcousticPhonetics (Fujimura and Erickson) [MML L9A.H.6]Ask me for advanced notes on mathematical basis for resonance.Quantal theoryStevens, K.N. (1989). On the quantal nature of speech. Journal of Phonetics 17: 3-45. [Advanced; read for gist]And commentaries in the same volume, esp. Lindblom and Engstrand.Pickett, J.M. (1999). The Acoustics of Speech Communication: Fundamentals, Speech Perception Theory, andTechnology. Needham Heights, MA: Allyn & B<strong>ac</strong>on. Ch. 14 (Hawkins).Hawkins, S. (1994) Quantal theory of speech. R.E. Asher (ed.) The Encyclopedia of Language and <strong>Ling</strong>uistics.Oxford: Pergamon Press, Vol. 6, 3417-3420.If you get interested in this area, ask me for pointers towards new, advanced material.Reading waveformsAll textbooks discuss spectrogram reading to some extent. Some useful short papers on reading waveforms:Ladefoged, P. (1991) Reading waveforms. Journal of the International Phonetic Association 21(1), 33-35.Maddieson, I. (1991) Commentary on ‘Reading waveforms’. JIPA 21(2), 89-91.Pickett (1999:62-68). See above for full reference.Electronic resourcesA standing wave demo: http://www.walter-fendt.de/ph11e/stlwaves.htmAnother one, using styrofoam pellets in a tubehttp://www.physics.ucla.edu/demoweb/demomanual/<strong>ac</strong>oustics/effects_of_sound/kundts_tube.htmlSee also excellent demos from music re e.g. violin making. Try the YouTube demo onhttp://chambermusictoday.blogspot.com/2007/05/violin-physics-chladni-patterns.htmland playing the saw (which exploits standing waves): www.sawlady.com/whatis.htm(N.B. I can demonstrate the reality of pressure maxima and minima associated with standing waves by pl<strong>ac</strong>ing amicrophone in a tube that is open at one end, and closed at the other end by a loudspeaker. With the loudspeakeremitting a sine wave at one of the tube’s resonance frequencies, you can move the microphone down the tube,and watch/listen to the amplitude of that frequency changing dramatically. If interested, ask me todo it in a lab.)M4_0809_AcousticTheorySpeechProduction.doc